. 2019 Sep 20;10(1):4310.
doi: 10.1038/s41467-019-12209-2.

Linked-read sequencing of gametes allows efficient genome-wide analysis of meiotic recombination

Affiliations

Linked-read sequencing of gametes allows efficient genome-wide analysis of meiotic recombination

Hequan Sun et al. Nat Commun. .

Abstract

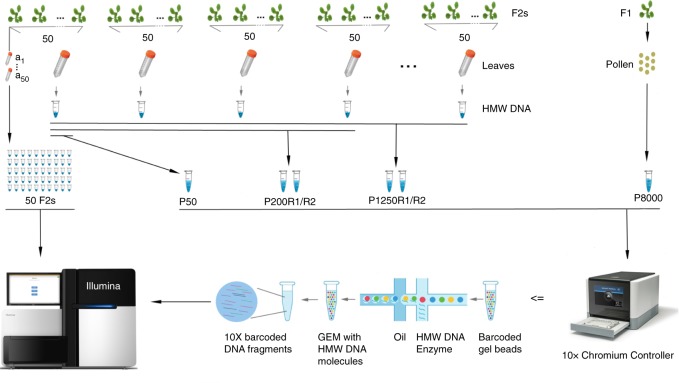
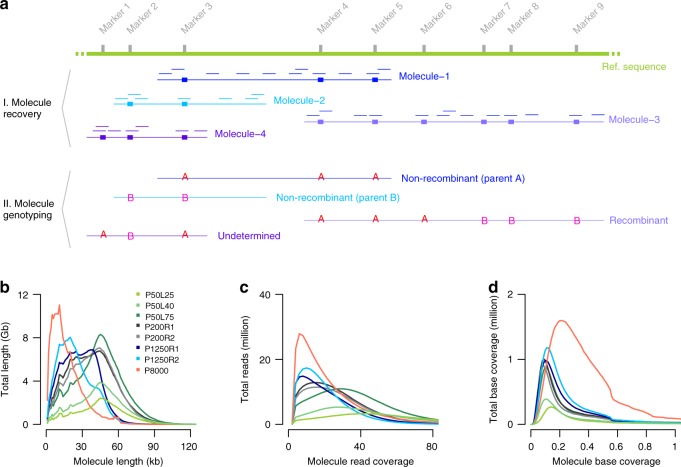
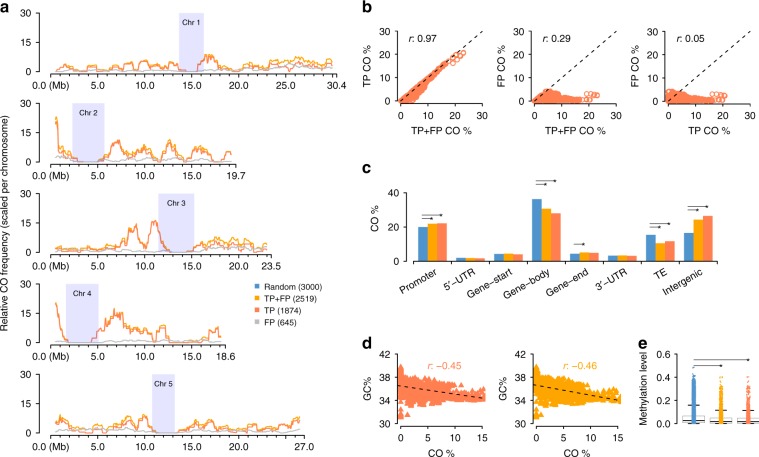
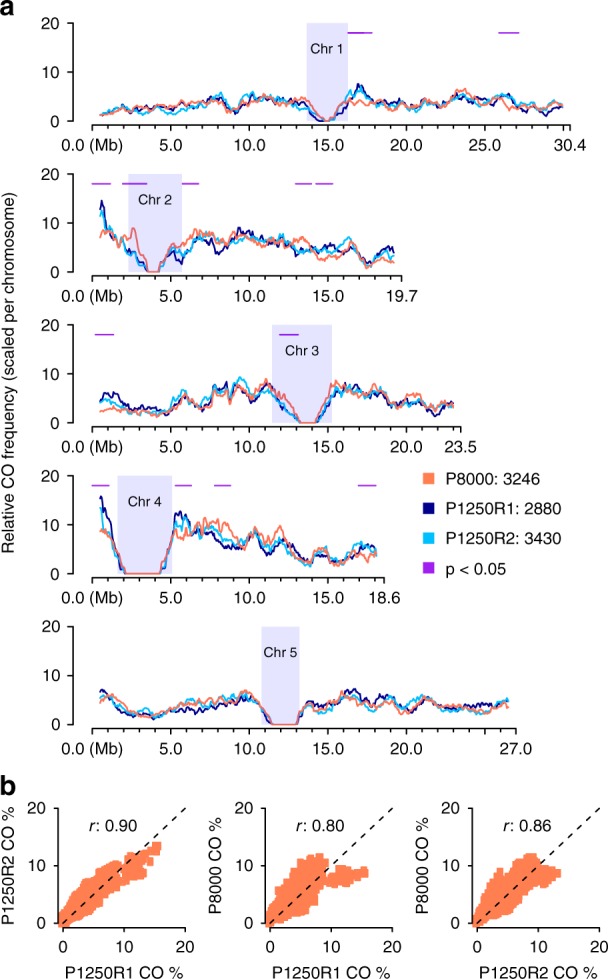
Meiotic crossovers (COs) ensure proper chromosome segregation and redistribute the genetic variation that is transmitted to the next generation. Large populations and the demand for genome-wide, fine-scale resolution challenge existing methods for CO identification. Taking advantage of linked-read sequencing, we develop a highly efficient method for genome-wide identification of COs at kilobase resolution in pooled recombinants. We first test this method using a pool of Arabidopsis F2 recombinants, and recapitulate results obtained from the same plants using individual whole-genome sequencing. By applying this method to a pool of pollen DNA from an F1 plant, we establish a highly accurate CO landscape without generating or sequencing a single recombinant plant. The simplicity of this approach enables the simultaneous generation and analysis of multiple CO landscapes, accelerating the pace at which mechanisms for the regulation of recombination can be elucidated through efficient comparisons of genotypic and environmental effects on recombination.


Conflict of interest statement

The authors declare no competing interests.

Figures

Fig. 1
Fig. 1
Experimental design and CO detection using linked-reads. F1 and F2 plants were derived from crosses of two divergent A. thaliana accessions. Leaf sampling: Leaves of 50 selected F2s were individually sampled (a1~50). In addition, the leaves of all other plants were pooled in batches of 50 F2s (for further merging), where the 50 individually sampled plants formed one of the pools. Also, pollen from a single F1 plant was sampled. DNA extraction: DNA from individual the samples a1~50 were extracted for Illumina whole-genome sequencing, while the DNA of the 50-F2 and pollen samples were extracted with a protocol for high molecular weight DNA (see Methods and Mayjonade et al. ). Pooling: Four and twenty-five 50-F2 samples were merged leading to 200-F2 and 1,250-F2 pools (P200 and P1250), each with two replicates (R1 and R2). The 50-F2 pool composed of the 50 F2s that were individually sequenced was labelled as P50, while the pollen pool was labelled as P8000. Library preparation: 50 individual F2 DNA samples were used for preparing Illumina DNA TruSeq libraries. The P50 DNA sample was loaded into a 10X Chromium Controller (illustration modified from 10X Genomics with official permissions) with three different amounts of DNA including 0.25 ng, 0.40 ng and 0.75 ng (P50L25, P50L40, and P50L75). P200R1/R2 and P1250R1/R2 were loaded using 0.75 ng and P8000 was loaded using 1.00 ng. Sequencing: All libraries were sequenced on Illumina HiSeq3000/4000 sequencers
Fig. 2
Fig. 2
Molecule recovery and genotyping using DrLink, and molecule characteristics. a Reads with the same barcode (represented by short lines in matching colors) that were aligned within close proximity (less than 25 kb apart) have been connected to recover molecules (Molecule-1 to Molecule-4). The genotypes that can be assessed with the read alignments of each recovered molecule fall into three major categories, non-recombinant (Molecule-1, Molecule-2), recombinant (Molecule-3), and undetermined (Molecule-4). b Length of recovered molecules for each of the 10X libraries. c Number of reads per recovered molecule. d Recovered molecule base coverage. Source Data are provided as a Source Data file Source_Data_main_Figure_2.zip
Fig. 3
Fig. 3
Genome-wide CO landscape formation and feature association. a Sliding window-based (window size 1 Mb, step size 50 kb) recombination landscapes calculated for true positives (TP), false positives (FP) and the combined set of TP + FP recombinant molecules of P50L75. Heterochromatic regions are indicated by rectangles in light blue. b Correlation tests of regional CO frequencies comparing TP vs. TP + FP (Pearson’s r 0.97), FP vs. TP + FP (Pearson’s r 0.25) and FP vs. TP (Pearson’s r 0.05). c Association of the TP and TP + FP sets with different genomic features in contrast to the random expectation (permutation test). d. Correlation tests of regional GC-content with CO frequency within the TP and TP + FP sets. e Association of TP or TP + FP sets with DNA methylation, compared with a random expectation (t-test; Methods). Note: in c and e, the expectations were obtained based on randomly sampled intervals within the reference genome excluding heterochromatic regions. The middle position of a CO interval was used for associations with genomic features in c, where the promoter of a gene was defined as the 1000 bp region upstream of the transcription start site, and the gene start/end as the first/last 200 bp of a gene. For each feature, a permutation test (oneway test in R coin package) was performed between the TP set (or TP + FP set) with 1,000 sets of randomly sampled 3000 intervals. The asterisks indicate the observed values (either from the TP or the TP + FP set) were significantly different from a random expectation. Source Data are provided as a Source Data file Source_Data_main_Figure_3.zip
Fig. 4
Fig. 4
Genome-wide recombination landscape in pollen. a Comparison of sliding window-based (window size 1 Mb, step size 50 kb) recombination landscapes in pollen and F2 populations (P1250R1/R2), showing genome-wide consistencies but with 13 regional differences (1.1 ± 0.2 Mb) as indicated by horizontal lines in purple with p < 0.05 (i.e., p-values of Fisher’s exact test; Methods). Heterochromatic regions are indicated by rectangles in light blue. b Correlation of genome-wide CO frequencies in pollen and F2s (Correlation test, Pearson’s r 0.80~0.86, both p-value < 2.2e-16). Source Data are provided as a Source Data file Source_Data_main_Figure_4.zip

References

    1. Barton NH, Charlesworth B. Why sex and recombination? Science. 1998;281:1986–1990. doi: 10.1126/science.281.5385.1986. - DOI - PubMed
    1. Rice WR, Chippindale AK. Sexual recombination and the power of natural selection. Science. 2001;294:555–559. doi: 10.1126/science.1061380. - DOI - PubMed
    1. McDonald MJ, Rice DP, Desai MM. Sex speeds adaptation by altering the dynamics of molecular evolution. Nature. 2016;531:233–236. doi: 10.1038/nature17143. - DOI - PMC - PubMed
    1. Mancera E, Bourgon R, Brozzi A, Huber W, Steinmetz LM. High-resolution mapping of meiotic crossovers and non-crossovers in yeast. Nature. 2008;454:479–485. doi: 10.1038/nature07135. - DOI - PMC - PubMed
    1. Kauppi L, Jeffreys AJ, Keeney S. Where the crossovers are: recombination distributions in mammals. Nat. Rev. Genet. 2004;5:413–424. doi: 10.1038/nrg1346. - DOI - PubMed

Publication types