. 2019 Sep 20;10(1):4316.
doi: 10.1038/s41467-019-12295-2.

Time elapsed between Zika and dengue virus infections affects antibody and T cell responses

Affiliations

Time elapsed between Zika and dengue virus infections affects antibody and T cell responses

Erick X Pérez-Guzmán et al. Nat Commun. .

Abstract

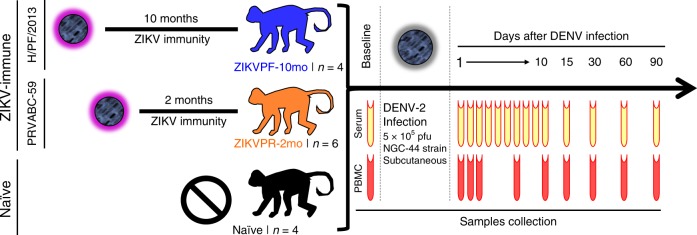
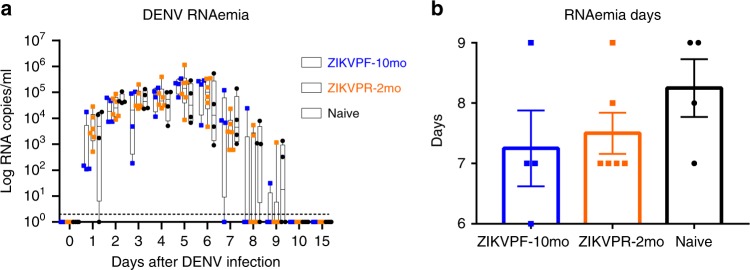
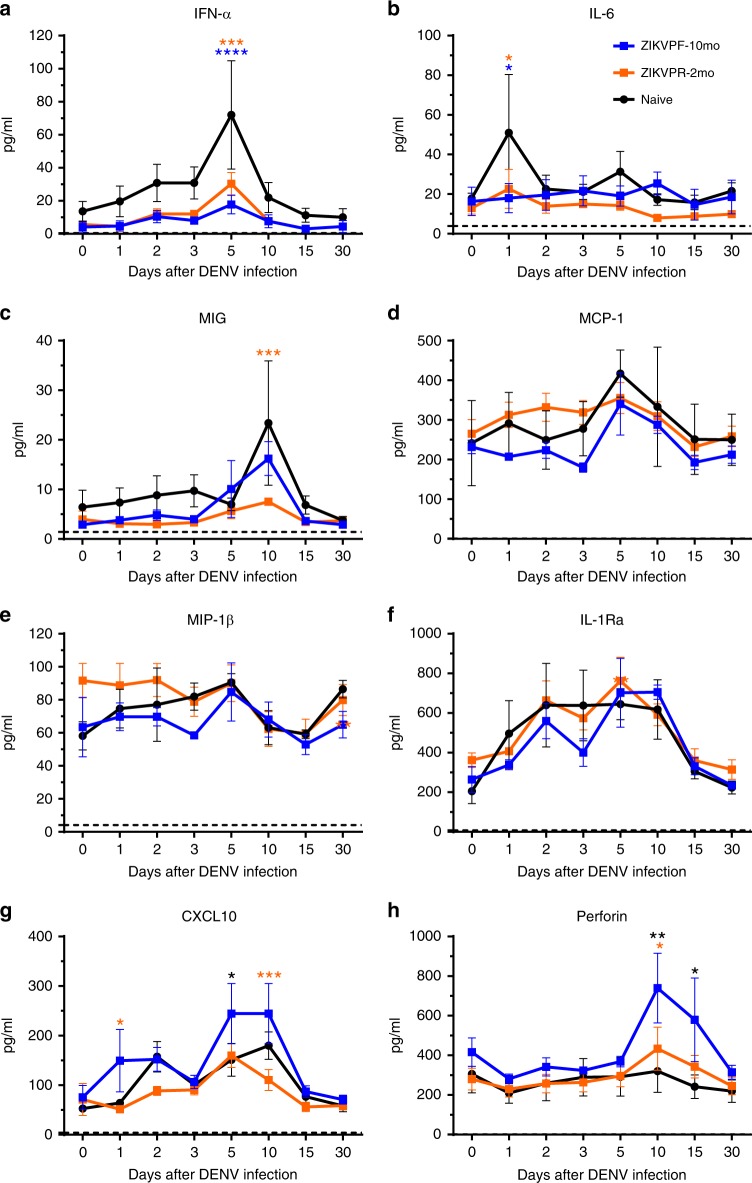
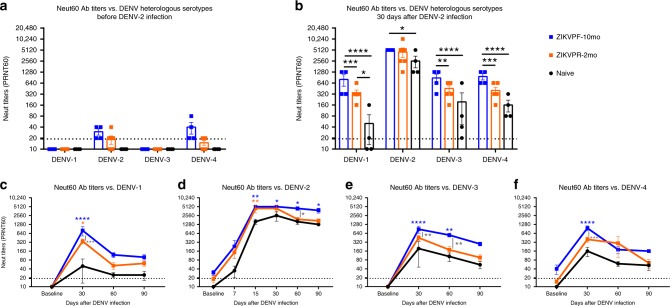
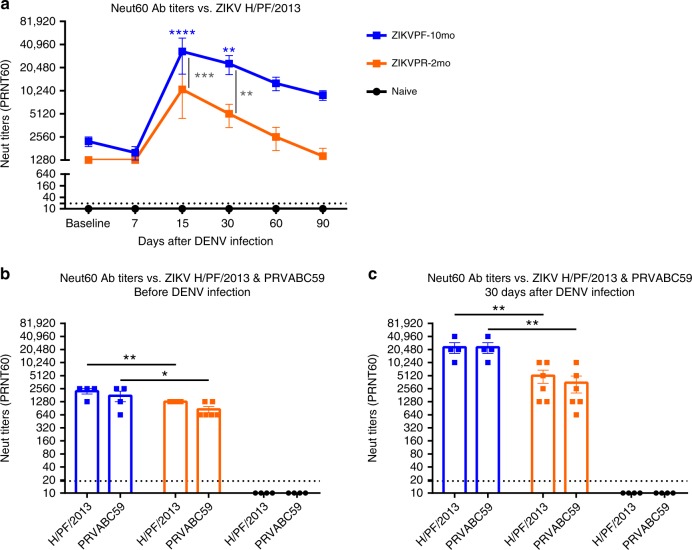
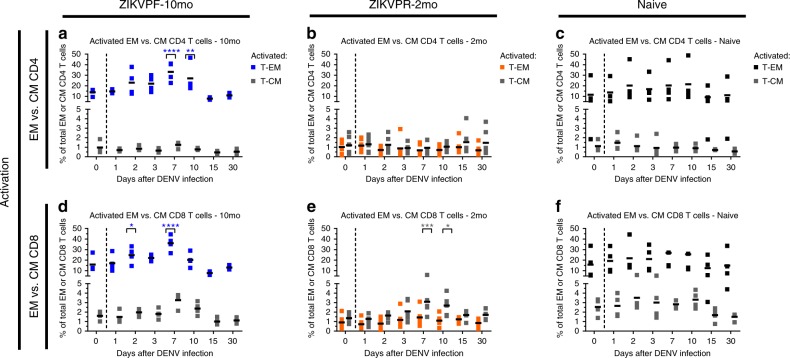
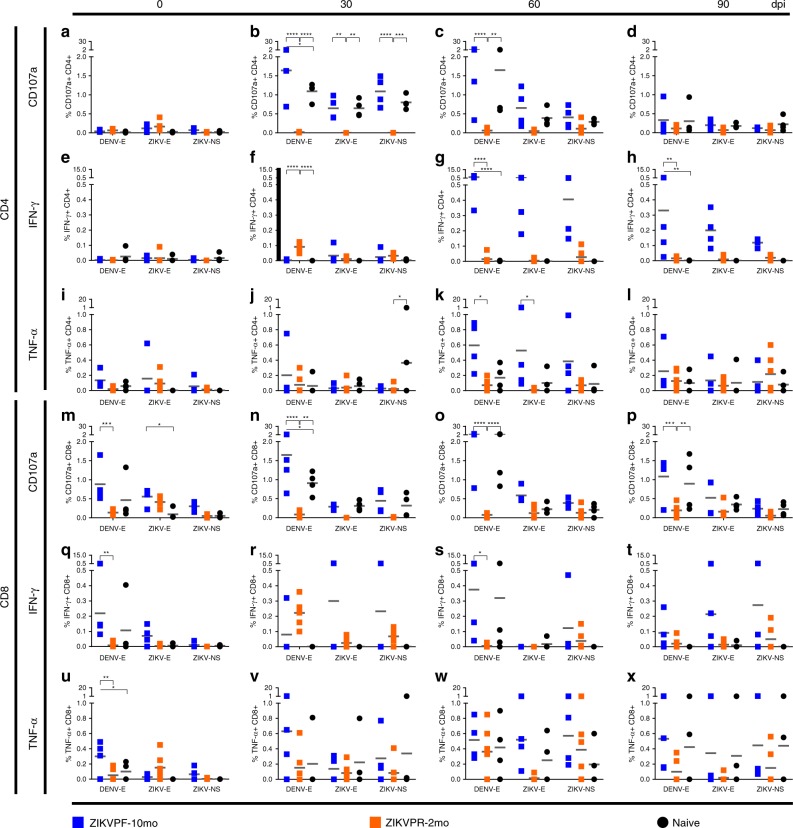
Zika virus (ZIKV) and dengue virus (DENV) are co-endemic in many parts of the world, but the impact of ZIKV infection on subsequent DENV infection is not well understood. Here we show in rhesus macaques that the time elapsed after ZIKV infection affects the immune response to DENV infection. We show that previous ZIKV exposure increases the magnitude of the antibody and T cell responses against DENV. The time interval between ZIKV and subsequent DENV infection further affects the immune response. A mid-convalescent period of 10 months after ZIKV infection results in higher and more durable antibody and T cell responses to DENV infection than a short period of 2 months. In contrast, previous ZIKV infection does not affect DENV viremia or pro-inflammatory status. Collectively, we find no evidence of a detrimental effect of ZIKV immunity in a subsequent DENV infection. This supports the implementation of ZIKV vaccines that could also boost immunity against future DENV epidemics.


Conflict of interest statement

The authors declare no competing interests.

Figures

Fig. 1
Fig. 1
Experimental design for DENV-2 challenge of ZIKV-immune and naive macaques. Fourteen young adult male rhesus macaques (Macaca mulatta), matched in age and weight, were divided into three cohorts. ZIKVPF-10mo (n = 4): composed of four animals (5K6, CB52, 2K2, and 6N1) that were inoculated with 1 × 106 pfu/500 µl of the ZIKV H/PF/2013 strain subcutaneously 10 months before (middle convalescence) DENV-2 challenge. ZIKVPR-2mo (n = 6): composed of six animals (MA067, MA068, BZ34, MA141, MA143, and MA085) that were inoculated with 1 × 106 pfu/500 µl of the contemporary ZIKV PRVABC59 strain 2 months before (early convalescence) DENV-2 challenge. Both ZIKV strains used for previous exposure of these groups are > 99.99% comparable in amino acid identity (Supplementary Table 1). Naive (n = 4): composed of four ZIKV/DENV naive animals (MA123, MA023, MA029, and MA062) as a control group. Prior to DENV-2 challenge, all animals were subjected to quarantine period. All cohorts challenged subcutaneously (deltoid area) with 5 × 105 pfu/500 µl of DENV-2 New Guinea 44 strain (NGC44). After DENV-2 challenge, all animals were extensively monitored for evidence of disease and clinical status by vital signs, such as external temperature (°C), weight (Kg), CBC, and CMP panels at the Caribbean Primate Research Center (CPRC). Blood samples were collected at baseline, 1–10, 15, 30, 60, and 90 days after DENV infection. In all timepoints, the blood samples were used for serum separation (yellow). PBMCs isolation (red) was performed in different tubes with citrate as anticoagulant at baseline, 1, 2, 3, 7, 10, 15, 30, 60, and 90 days after DENV infection
Fig. 2
Fig. 2
Previous ZIKV immunity does not contribute to an increase of DENV RNAemia. a DENV-2 RNA kinetics in ZIKV-immune and naive animals at baseline, day 1–10, and day 15 after DENV infection. RNA genome copies (Log10) per milliliter of serum were measured by qRT-PCR. Symbols represent individual animals per cohort: blue squares (ZIKVPF-10mo), orange squares (ZIKVPR-2mo), and black circles (naive). Box and whiskers show the distribution of log-transformed values per group per timepoint. Boxes include the mean value per group, while whiskers depict the minimum and maximum values for each group. Cutted line mark the limit of detection (20 genomes copies). Statistically significant differences between groups were determined using two-way ANOVA adjusted for Tukey’s multiple comparisons test including 12 families, and 3 comparisons per family. b The total days that DENV-2 RNAemia was detected for each animal within cohorts. Bars represent mean days per cohort. Source data are provided as a Source Data file
Fig. 3
Fig. 3
ZIKV immunity does not exacerbate levels of pro-inflammatory cytokines. Cytokines and chemokines expression levels were determined in serum (pg/ml) by multiplex bead assay (Luminex) at baseline, 1, 2, 3, 5, 10, 15, and 30 days after DENV infection. The panel includes: a interferon alpha (IFN-α), b interleukin-6 (IL-6), c monokine induced by IFN-gamma (MIG/CXCL9), d monocyte chemoattractant protein 1 (MCP-1/CCL2), e macrophage inflammatory protein 1-beta (MIP-1β/CCL4), f IL-1 receptor antagonist (IL-1RA), g C–X–C motif chemokine 10 (CXCL10/IP-10), and h perforin. Symbols connected with lines represent mean expression levels detected of each cytokine/chemokine per cohort over time: blue squares (ZIKVPF-10mo), orange squares (ZIKVPR-2mo), and black circles (naive). Error bars indicate the standard error of the mean (SEM) for each cohort per timepoint. Cutted line marks the limit of detection for each individual cytokine/chemokine. Statistically significant differences between groups were calculated using two-way ANOVA adjusted for Tukey’s multiple comparisons test including eight families, and three comparisons per family. Significant multiplicity adjusted p-values (*< 0.05, **< 0.01, ***<0.001, ****< 0.0001) are shown colored representing the cohort against that particular point where is a statistically significant difference between groups. Source data are provided as a Source Data file
Fig. 4
Fig. 4
Neutralization of DENV serotypes by ZIKV-immune animals is higher in magnitude. The magnitude of the neutralizing antibody (NAb) response was determined (a) before and (b) 30 days after DENV infection by plaque reduction neutralization test (PRNT) against all DENV serotypes. cf The durability of the neutralizing response was assessed measuring NAb titers up to 90 dpi against all DENV serotypes. Symbols connected with full lines indicate mean levels of NAb titers detected per cohort over time: blue squares (ZIKVPF-10mo), orange squares (ZIKVPR-2mo), and black circles (naive). Error bars represent the standard error of the mean (SEM). PRNT60: NAb titer capable of reduce 60% or more of DENV serotypes plaque-forming units (pfu) compared with the mock (control of virus without serum). A PRNT60 1:20 titer was considered positive, and < 1:20 as a negative Neut titer. Dotted line mark < 1:20 for the negative results. Non-neutralizing titers (< 1:20) were assigned with one-half of the limit of detection for graphs visualization (1:10). Statistically significant differences between groups were calculated using two-way ANOVA adjusted for Tukey’s multiple comparisons test including four and six families for heterologous serotypes and DENV-2, respectively, and three comparisons per family. Significant multiplicity adjusted p-values (*< 0.05, **< 0.01, ***< 0.001, ****< 0.0001) are shown. Blue and orange asterisks represent significant difference between the corresponded ZIKV immune groups and naive group, and gray asterisks indicate a significant difference between ZIKV immune groups. Source data are provided as a Source Data file
Fig. 5
Fig. 5
ZIKV neutralization is boosted after DENV infection, and is strain independent. a NAb titers against ZIKV H/PF/2013 were determined by PRNT60 at baseline, 7, 15, 30, 60, and 90 days after DENV infection. Comparison of NAb titers between pre-infecting ZIKV strains was performed (b) before and (c) after DENV infection. Symbols connected with full lines indicate mean levels of NAb titers detected per cohort over time: blue squares (ZIKVPF-10mo), orange squares (ZIKVPR-2mo), and black circles (naive). Error bars represent the standard error of the mean (SEM). PRNT60: NAb titer capable of reduce 60% or more of ZIKV strains plaque-forming units (pfu) compared with the mock (control of virus without serum). A PRNT60 1:20 titer was considered positive, and < 1:20 as a negative Neut titer. Dotted line mark < 1:20 for negative results. Non-neutralizing titers (< 1:20) were assigned with one-half of the limit of detection for graphs visualization (1:10). Statistically significant differences between groups were calculated using two-way ANOVA adjusted for Tukey’s multiple comparisons test including six and two families for panel a and b, c, respectively, and three comparisons per family. Significant multiplicity adjusted p-values (*< 0.05, **< 0.01, ***< 0.001, ****< 0.0001) are shown. Blue and orange asterisks represent significant difference between the corresponded ZIKV-immune groups and naive group, and gray asterisks indicate a significant difference between ZIKV-immune groups. Source data are provided as a Source Data file
Fig. 6
Fig. 6
Activation of effector and central memory CD4+ and CD8+ T cells after DENV infection. Activation (CD69+) of effector memory (T-EM: CD3+CD4+CD28CD95+) and central memory (T-CM: CD3+CD4+CD28+CD95+) T cells within (ac) CD4+ and (df) CD8+ T-cell compartments before and after DENV infection. Percent of cells were determined by immunophenotyping using flow cytometry (Supplementary Fig. 7 for gating strategy). Blue, orange, and black squares represent T-EM for ZIKVPF-10mo, ZIKVPR-2mo, and naive, respectively. Gray squares represent T-CM for each group. Short black lines mark mean value for each group per timepoint. Cutted line divide % of T-EM and T-CM cells quantified before and after DENV infection. Statistically significant differences within groups were determined using two-way ANOVA adjusted for Dunnett’s multiple comparisons test (comparison of each group response at each timepoint versus baseline of the same group) including two families, and seven comparisons per family. Significant differences are reported as multiplicity adjusted p-values (*< 0.05, **< 0.01, ***< 0.001, ****< 0.0001). Asterisks represent significant difference between the corresponded timepoint and baseline within the same group. Source data are provided as a Source Data file
Fig. 7
Fig. 7
Longevity of ZIKV immunity shapes the T cell functional response. T cell functional effector response was determined by the quantification (%) of (ad; mp) CD107a-expressing and (eh; qt) IFN-γ or (il; ux) TNF-α-producing CD4+ and CD8+ T cells before (0) and 30, 60, and 90 days after DENV infection. Responses to several peptide pools that encode for DENV and ZIKV envelope (E) proteins or ZIKV nonstructural (NS) protein were quantified. After antigenic stimulation, intracellular cytokine staining was performed using flow-cytometry analysis (Supplementary Fig. 14 for gating strategy). Individual symbols represent each animal per antigenic stimulation over time: blue squares (ZIKVPF-10mo), orange squares (ZIKVPR-2mo), and black circles (naive). Short gray lines mark mean value for each group. Statistically significant differences between groups were calculated using two-way ANOVA adjusted for Tukey’s multiple comparisons test including three families, and three comparisons per family. Significant multiplicity adjusted p-values (*< 0.05, **< 0.01, ***< 0.001, ****< 0.0001) are shown. Asterisks represent significant difference between indicated groups. Source data are provided as a Source Data file

Similar articles

Cited by

References

    1. Metsky HC, et al. Zika virus evolution and spread in the Americas. Nature. 2017;546:411–415. doi: 10.1038/nature22402. - DOI - PMC - PubMed
    1. de Oliveira WK, et al. Infection-related microcephaly after the 2015 and 2016 Zika virus outbreaks in Brazil: a surveillance-based analysis. Lancet. 2017;390:861–870. doi: 10.1016/S0140-6736(17)31368-5. - DOI - PubMed
    1. Li C, et al. Zika virus disrupts neural progenitor development and leads to microcephaly in mice. Cell Stem Cell. 2016;19:672. doi: 10.1016/j.stem.2016.10.017. - DOI - PubMed
    1. Mlakar J, et al. Zika virus associated with microcephaly. New Engl. J. Med. 2016;374:951–958. doi: 10.1056/NEJMoa1600651. - DOI - PubMed
    1. Guo C, et al. Global epidemiology of dengue outbreaks in 1990-2015: a systematic review and meta-analysis. Front. Cell. Infect. Microbiol. 2017;7:317. doi: 10.3389/fcimb.2017.00317. - DOI - PMC - PubMed

Publication types