. 2019 Sep 20;10(1):4291.
doi: 10.1038/s41467-019-12262-x.

Endogenous nicotinamide riboside metabolism protects against diet-induced liver damage

Affiliations

Endogenous nicotinamide riboside metabolism protects against diet-induced liver damage

Audrey Sambeat et al. Nat Commun. .

Abstract

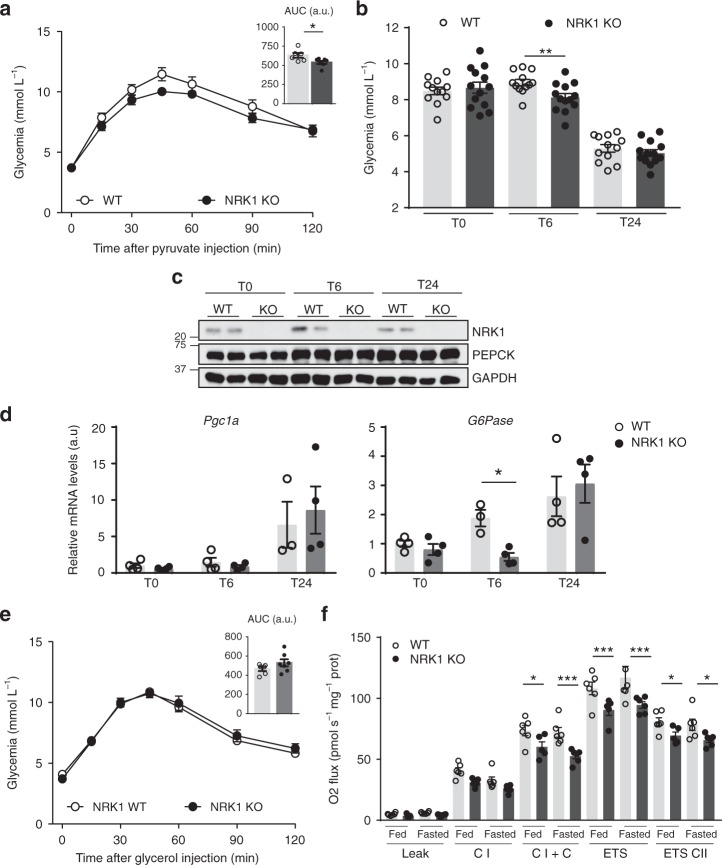
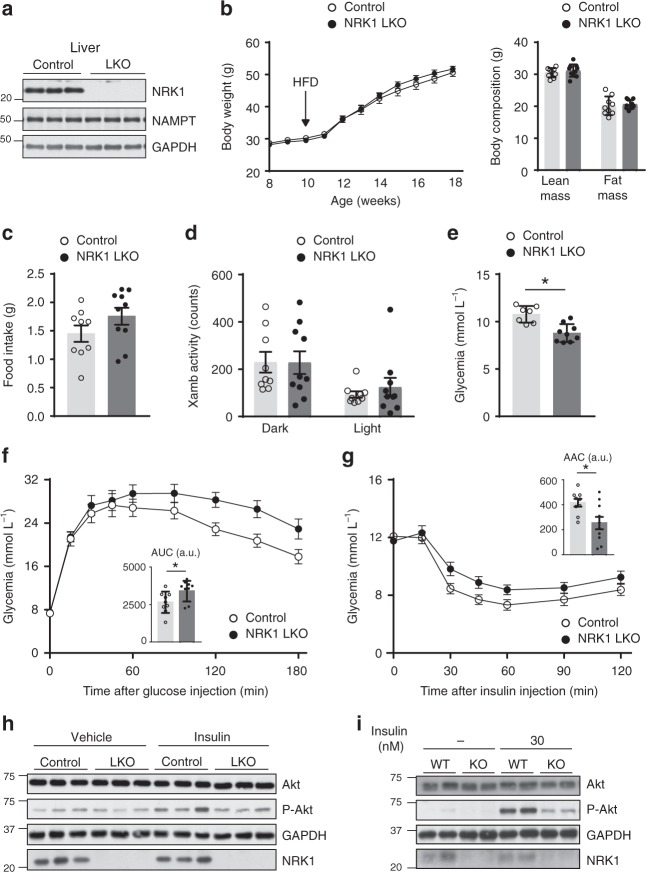
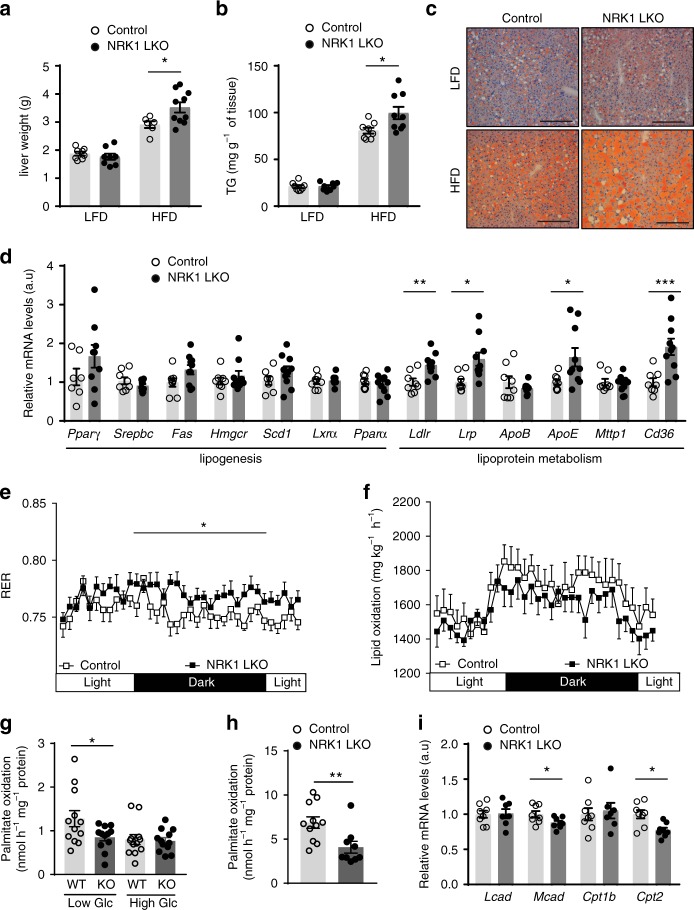
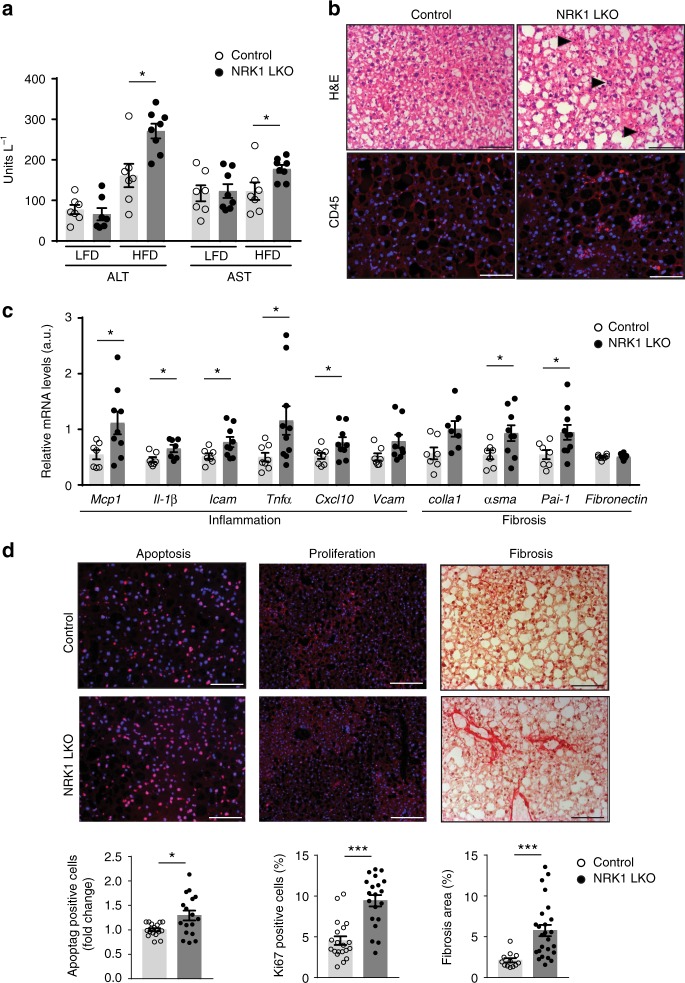
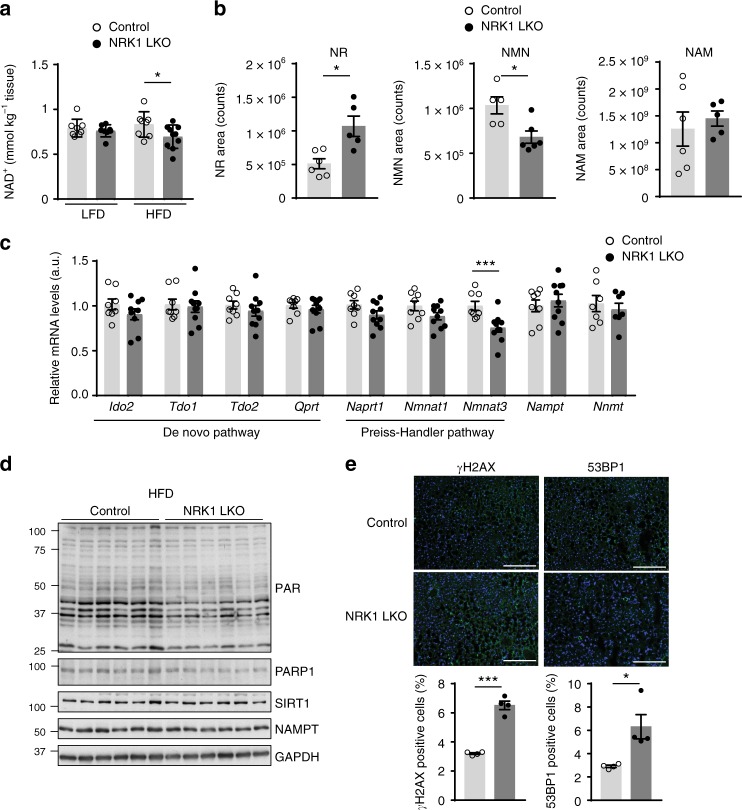
Supplementation with the NAD+ precursor nicotinamide riboside (NR) ameliorates and prevents a broad array of metabolic and aging disorders in mice. However, little is known about the physiological role of endogenous NR metabolism. We have previously shown that NR kinase 1 (NRK1) is rate-limiting and essential for NR-induced NAD+ synthesis in hepatic cells. To understand the relevance of hepatic NR metabolism, we generated whole body and liver-specific NRK1 knockout mice. Here, we show that NRK1 deficiency leads to decreased gluconeogenic potential and impaired mitochondrial function. Upon high-fat feeding, NRK1 deficient mice develop glucose intolerance, insulin resistance and hepatosteatosis. Furthermore, they are more susceptible to diet-induced liver DNA damage, due to compromised PARP1 activity. Our results demonstrate that endogenous NR metabolism is critical to sustain hepatic NAD+ levels and hinder diet-induced metabolic damage, highlighting the relevance of NRK1 as a therapeutic target for metabolic disorders.


Conflict of interest statement

All authors are employees of Nestlé Research S.A.

Figures

Fig. 1
Fig. 1
NRK1 KO mice display lower gluconeogenic capacity. a Blood glucose levels during intraperitoneal pyruvate tolerance tests in NRK1 KO (n = 7) and control (WT) (n = 6) mice. b Blood glucose levels in NRK1 KO (n = 13) and WT (n = 12) mice subjected to a fasting time course. c Livers were snap frozen at the indicated time-points during a fasting time course. A piece of liver was then homogenized for protein extraction. Then, 20 μg of protein were used to evaluate NRK1, PEPCK, and GAPDH protein levels through western blot. d Livers were snap frozen at the indicated time points during fasting time course. Then, RNA was extracted to evaluate mRNA levels of genes involved in gluconeogenesis (n = 4 mice per group). e Blood glucose level during intraperitoneal glycerol tolerance test (n = 6 for WT mice, n = 7 for NRK1 KO mice). f Mitochondrial respiratory capacity properties were evaluated in liver homogenates from NRK1 KO and WT mice in fed and 24h-fasted conditions (n = 6 for WT mice; n = 5 for NRK1 KO mice). Results shown are mean ± SEM; * and *** indicate statistical difference between genotypes at p < 0.05 and p < 0.001, respectively. The individual values and statistical tests used for each panel can be found in the Source Data file
Fig. 2
Fig. 2
Liver-specific NRK1 deficiency exacerbates diet-induced insulin resistance. a Validation of NRK1 deletion and protein level of NAMPT and GAPDH in liver homogenates from NRK1 LKO and control (Ctrl) mice. b Body weight and body composition of NRK1 LKO (n = 10) and control (n = 9) mice on high-fat diet (HFD) at the indicated ages. c, d Food intake c and locomotor activity d of NRK1 LKO (n = 9) and control (n = 8) mice on HFD at 18 weeks of age. e Glycemia levels after 6h-fasting in NRK1 LKO (n = 9) and control (n = 7) mice on HFD at 24 weeks of age. f, g Blood glucose level during intraperitoneal glucose (n = 8 mice in the control group, n = 10 mice in the NRK1 LKO group) f and insulin g tolerance test in NRK1 LKO and control mice on HFD (n = 9 mice for the control group, n = 10 mice for the NRK1 LKO group) at 20 and 22 weeks of age, respectively. h Protein level of Akt, P-Akt, GAPDH, and NRK1 in the liver of NRK1 LKO and Ctrl mice on HFD 15 min after insulin injection (1U kg−1) (n = 3 mice per group). i Protein levels of Akt, P-Akt, GAPDH and NRK1 in primary hepatocytes from NRK1 KO and WT mice stimulated with insulin at the indicated concentration. Results shown are mean ± SEM, * indicates statistical difference vs the respective control value at p < 0.05. The individual values and statistical tests used for each panel can be found in the Source Data file
Fig. 3
Fig. 3
NRK1 deficiency promotes hepatic steatosis by impairing fatty acid oxidation. a, b Liver weight a and triglycerides (TG) levels b in liver of NRK1 LKO and control mice on LFD and HFD (n = 7 mice for the control group; n = 10 mice for the NRK1 LKO group; 24 weeks of age). c Oil-Red O staining of liver sections from NRK1 LKO and control mice on LFD and HFD (scale bars: 200 μm). d mRNA level of genes involved in lipogenesis and lipoprotein metabolism in the liver of HFD-fed NRK1 LKO and control mice (n = 8 mice for the control group; n = 10 mice in the NRK1LKO group). e Respiratory exchange ratio (RER) in NRK1 LKO and control mice on HFD (n = 9 mice for the control group; n = 10 mice for the NRK1LKO group). f Lipid oxidation of NRK1 LKO and control mice on HFD. Data calculated from indirect calorimetry measurements: lipid oxidation = (1.67 x VO2) – (1.67 x VCO2) (n = 9 mice for the control group; n = 10 mice for the NRK1 LKO group). g Fatty acid oxidation in primary hepatocytes isolated from 10 to 20 week-old WT and NRK1 KO mice. 3H-Palmitate oxidation was measured in conditions of low and high glucose (n = 12 for all groups). h Fatty acid oxidation in primary hepatocytes isolated from 8 to 12 week-old WT and NRK1 KO mice. 3H-Palmitate oxidation was measured in condition of lipid overload. i. mRNA level of genes involved in β-oxidation in the liver of HFD-fed NRK1 LKO and control mice (n = 8 for WT hepatocytes; n = 7 for KO hepatocytes). Results shown are mean ± SEM, *, **, and *** indicate statistical difference vs. respective control group at p < 0.05, p < 0.01 and p < 0.001, respectively. The individual values and statistical tests used for each panel can be found in the Source Data file
Fig. 4
Fig. 4
NRK1 liver-specific deletion fosters the development of NAFLD. a Plasma levels of liver damage markers, alanine transaminase (ALT) and aspartate transaminase (AST) in NRK1 LKO and control mice on LFD and HFD (n = 7 for all groups except NRK1 LKO on HFD, n = 8). b Representative H&E (top) and CD45 (bottom) staining on liver sections from NRK1 LKO and control mice on HFD showing immune cells infiltration (black arrows) (×20 magnification, scale bars: 100 μm). c Gene expression of markers of inflammation (left) and fibrosis (right) in the liver of NRK1 LKO mice and control mice on HFD (n = 8 for the control group; n = 10 for the NRK1 LKO group). d Immunohistochemistry on liver sections from NRK1 LKO and control mice on HFD. Representative staining (top) and quantification (bottom) for Apoptag (left), Ki-67 (center) (DAPI counterstaining) (×10 magnification, scale bars: 200 μm) and Sirius Red (right) (×20 magnification, scale bars: 100 μm) (n = 4 mice per group). Results shown are mean ± SEM, * and *** indicate p < 0.05 and p < 0.001, respectively, vs. the control group. The individual values and statistical tests used for each panel can be found in the Source Data file
Fig. 5
Fig. 5
NRK1 deletion curbs PARP activity and exacerbates DNA damage. a NAD+ levels in the liver of NRK1 LKO mice upon LFD and HFD (n = 8 for all groups except NRK1 LKO on HFD, n = 10; 24 weeks of age). b NR (left), NMN (center) and NAM (right) levels in the liver of NRK1 LKO and control mice upon HFD (n = 6 mice per group). c mRNA level of genes involved in the NAD+ biosynthesis pathways (n = 8 mice for the control group, n = 10 mice for the NRK1 LKO group). d Levels of poly(ADP-ribose) protein modification, PARP1, SIRT1, NAMPT, and GAPDH in the liver of NRK1 LKO and control mice on HFD. e Representative staining (top) and quantification (bottom) of γH2AX (left) and 53BP1 (right) immunofluorescence on liver sections from NRK1 LKO and control mice on HFD (n = 4 mice per group, ×10 magnification, DAPI counterstaining, scale bars: 200 μm). Results shown are mean ± SEM, * and *** indicate statistical difference vs. control group at p < 0.05 and p < 0.001, respectively. The individual values and statistical tests used for each panel can be found in the Source Data file

References

    1. Bieganowski P, Brenner C. Discoveries of nicotinamide riboside as a nutrient and conserved NRK genes establish a Preiss-Handler independent route to NAD+ in fungi and humans. Cell. 2004;117:495–502. doi: 10.1016/S0092-8674(04)00416-7. - DOI - PubMed
    1. Canto C, Menzies KJ, Auwerx J. NAD(+) metabolism and the control of energy homeostasis: a balancing act between mitochondria and the nucleus. Cell Metab. 2015;22:31–53. doi: 10.1016/j.cmet.2015.05.023. - DOI - PMC - PubMed
    1. Yoshino Jun, Baur Joseph A., Imai Shin-ichiro. NAD+ Intermediates: The Biology and Therapeutic Potential of NMN and NR. Cell Metabolism. 2018;27(3):513–528. doi: 10.1016/j.cmet.2017.11.002. - DOI - PMC - PubMed
    1. Gariani K, et al. Eliciting the mitochondrial unfolded protein response by nicotinamide adenine dinucleotide repletion reverses fatty liver disease in mice. Hepatology. 2016;63:1190–1204. doi: 10.1002/hep.28245. - DOI - PMC - PubMed
    1. Braidy N, et al. Age related changes in NAD+ metabolism oxidative stress and Sirt1 activity in wistar rats. PLoS ONE. 2011;6:e19194. doi: 10.1371/journal.pone.0019194. - DOI - PMC - PubMed

Publication types

MeSH terms