. 2019 Sep 20;9(1):13615.
doi: 10.1038/s41598-019-49944-x.

Structure of full-length wild-type human phenylalanine hydroxylase by small angle X-ray scattering reveals substrate-induced conformational stability

Affiliations

Structure of full-length wild-type human phenylalanine hydroxylase by small angle X-ray scattering reveals substrate-induced conformational stability

Catarina S Tomé et al. Sci Rep. .

Erratum in

Abstract

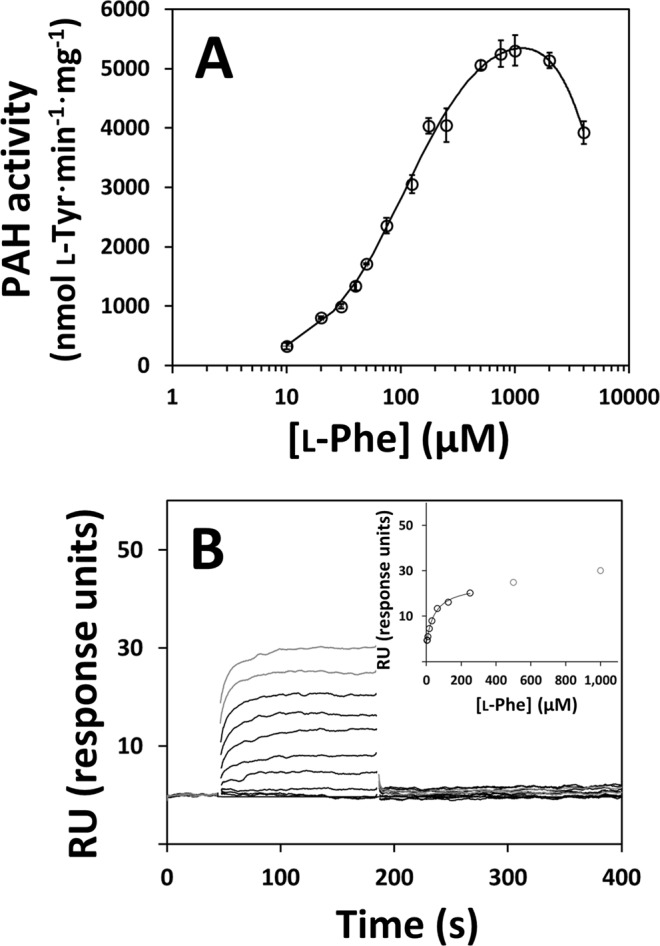
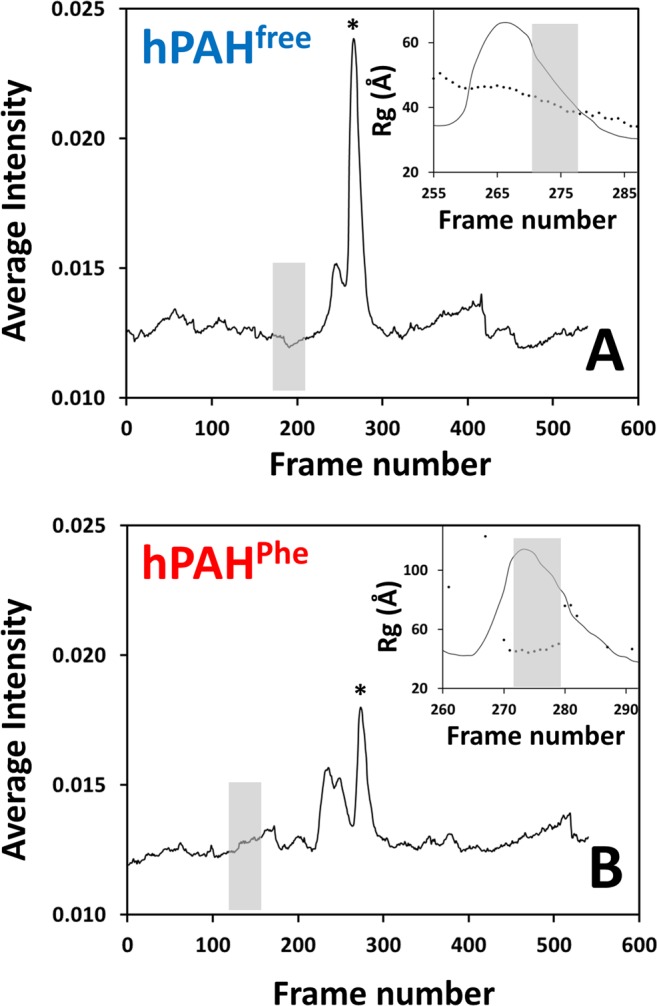
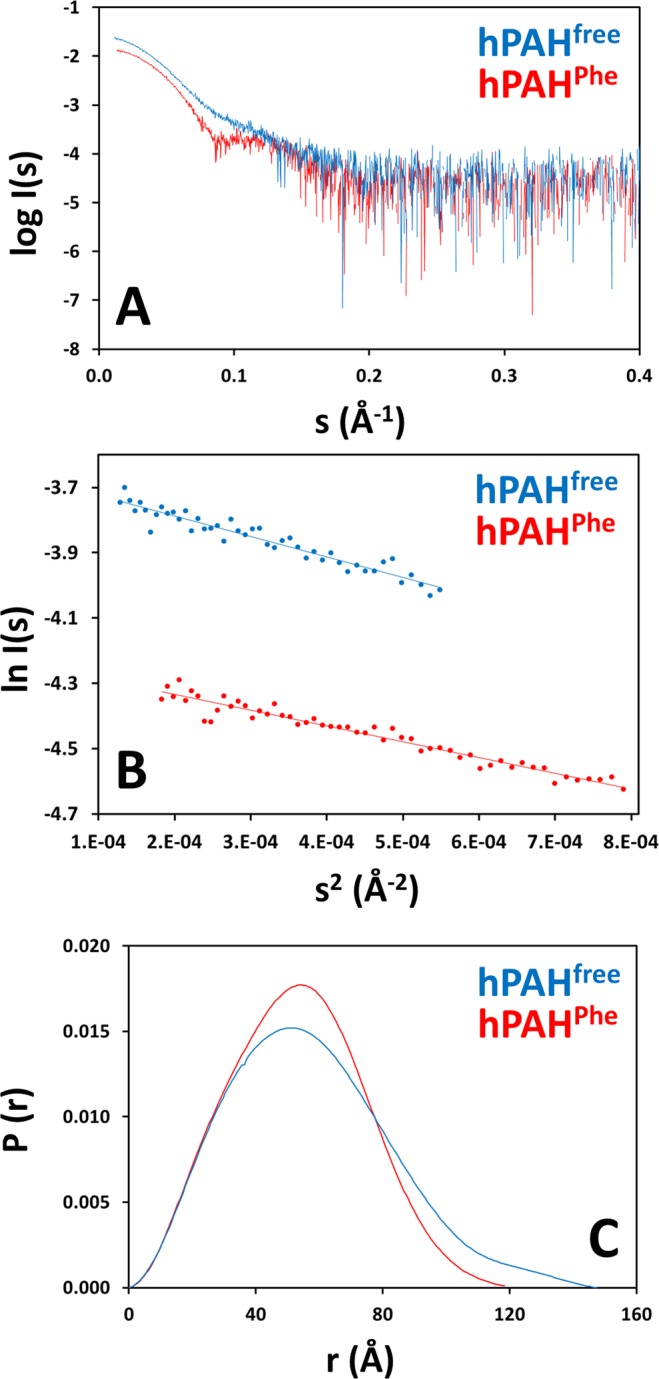
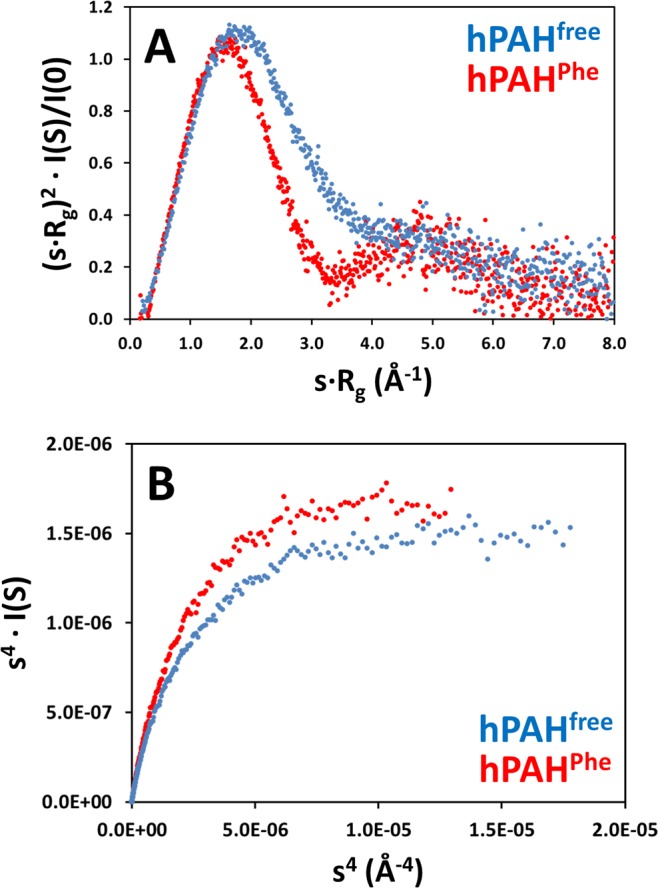
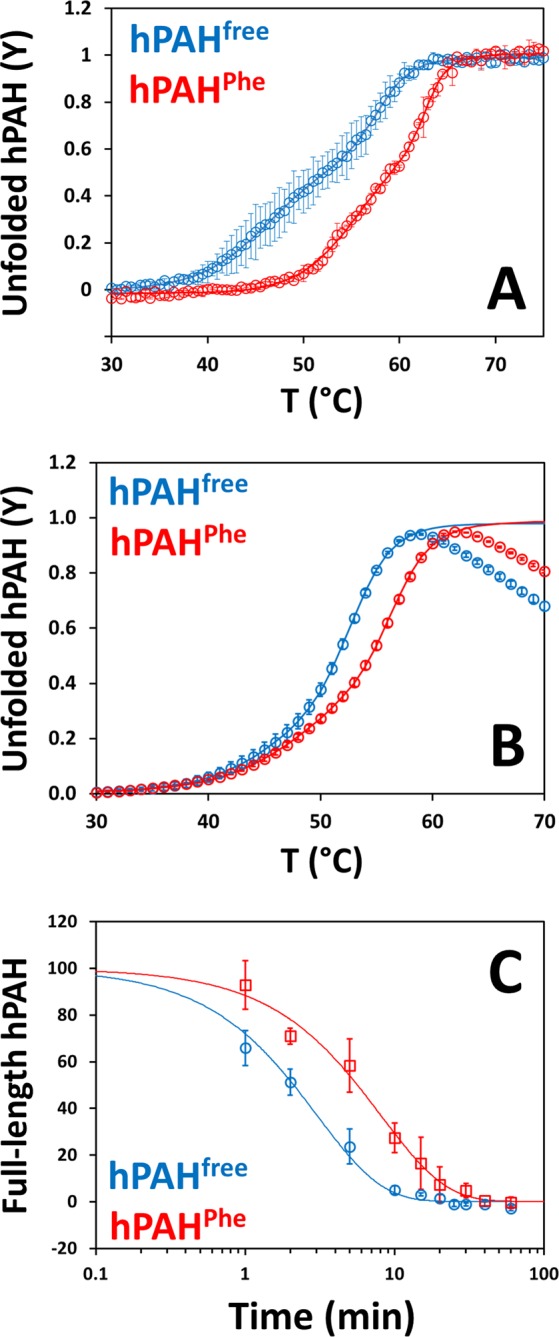
Human phenylalanine hydroxylase (hPAH) hydroxylates L-phenylalanine (L-Phe) to L-tyrosine, a precursor for neurotransmitter biosynthesis. Phenylketonuria (PKU), caused by mutations in PAH that impair PAH function, leads to neurological impairment when untreated. Understanding the hPAH structural and regulatory properties is essential to outline PKU pathophysiological mechanisms. Each hPAH monomer comprises an N-terminal regulatory, a central catalytic and a C-terminal oligomerisation domain. To maintain physiological L-Phe levels, hPAH employs complex regulatory mechanisms. Resting PAH adopts an auto-inhibited conformation where regulatory domains block access to the active site. L-Phe-mediated allosteric activation induces a repositioning of the regulatory domains. Since a structure of activated wild-type hPAH is lacking, we addressed hPAH L-Phe-mediated conformational changes and report the first solution structure of the allosterically activated state. Our solution structures obtained by small-angle X-ray scattering support a tetramer with distorted P222 symmetry, where catalytic and oligomerisation domains form a core from which regulatory domains protrude, positioning themselves close to the active site entrance in the absence of L-Phe. Binding of L-Phe induces a large movement and dimerisation of regulatory domains, exposing the active site. Activated hPAH is more resistant to proteolytic cleavage and thermal denaturation, suggesting that the association of regulatory domains stabilises hPAH.


Conflict of interest statement

The authors declare no competing interests.

Figures

Figure 1
Figure 1
Kinetic characterisation of hPAH. Panel A, Effect of substrate concentration on the enzymatic activity of hPAH. Activity was measured at 25 °C in HEPES buffer pH 7.0 with 0.112 µM hPAH and 75 µM BH4. The obtained values for Vmax, S0.5, h, Kcat/S0.5 and activation ratio are summarised in Supplementary Table 1. Panel B, Binding of l-Phe to hPAH determined by surface plasmon resonance. Inset, effect of l-Phe concentration on the steady-state response units.
Figure 2
Figure 2
SEC-SAXS elution profiles of hPAHfree (non-incubated, panel A) and hPAHPhe (incubated with 1 mM l-Phe, panel B). Frames are plotted in respect to the elution time. The size-exclusion chromatography column coupled to the beam allowed separating the tetramer peak (marked with *) from higher-order aggregates. Insets represent the Rg values for each frame along the tetramer peak. The sample frames were manually selected from the region where the Rg is constant. Buffer frames were selected using the “Buffer Automatic Selection” function of CHROMIXS.
Figure 3
Figure 3
SAXS analysis of hPAHfree (non-incubated; blue) and hPAHPhe (incubated with 1 mM l-Phe; red). Panel A, experimental scattering curves. A shift in the middle-s region suggests a structural difference between the free and Phe-bound protein consistent with domain rearrangement. Panel B, Guinier plots within the range of 0.50 < sRg < 1.02 for hPAHfree and 0.52 < sRg < 1.08 for hPAHPhe. Dots represent experimental points and lines represent linear regressions. No significant deviations from linearity are observed in the Guinier plot, thus no direct evidence of aggregation or polydispersity is observed. Panel C, pair-distribution functions P(r) derived from the scattering profiles. The P(r) function represents the sample in the real space. The differences in both curves suggest a conformational change upon addition of l-Phe: the loss of the extended tail at large r and the Dmax decrease indicate a transition between an elongated conformation in hPAHfree and a compact conformation in hPAHPhe.
Figure 4
Figure 4
Analysis of flexibility versus conformational changes. Panel A, dimensionless Kratky plots (blue, non-incubated hPAH; red, l-Phe-incubated hPAH). Panel B, Porod-Debye plots limited by the s value corresponding to the major Kratky peak. Dots represent experimental data for hPAHfree (non-incubated; blue) and hPAHPhe (1 mM l-Phe; red). The parabolic peak of the Kratky function with a maximum of 1.1 at sRg = √3 and convergence to zero reveals folded proteins. The differences at high s between hPAHfree and hPAHPhe suggest a conformational change that is confirmed by the Porod-Debye plot that shows two discrete plateaus.
Figure 5
Figure 5
Evaluation of rigid-body modeling of hPAHfree (non-incubated; panel A) and hPAHPhe (1 mM l-Phe; panel B). For each sample, five reconstructions were performed and superimposed to check for consistency of the models. In all models, tetramer cores (catalytic and oligomerisaton domains) are represented in gray. Regulatory domains are shown in a different color for each reconstruction. The chi-square of each model is displayed in its corresponding color. Dots represent the reconstruction of the N-terminus for the most representative model. The obtained structures from multiple rigid body refinements show identical position of domains, indicating reliability of the models.
Figure 6
Figure 6
SAXS models of hPAHfree (non-incubated; panel A) and hPAHPhe (1 mM l-Phe; panel B). Reconstruction was based on the coordinates of hPAH regulatory domain (PDB 5FII) and hPAH catalytic/oligomerisation domains (PDB 2PAH), using P222 symmetry. The models are shown in surface mode in two orientations, the bottom view being rotated 90° around the horizontal axis. Each color represents a monomer (regulatory domains are shown in darker tones). The scattering curves below each model (panel C, non-incubated hPAH; panel D, l-Phe-incubated hPAH) show the fit between experimental data (black line) and the corresponding model (red line). While the assembly of tetramer core is not altered by 1 mM l-Phe, the regulatory domains show a large-scale movement to form a dimeric structure above the four-helix bundle. This rearrangement explains the structural differences observed in the scattering profile of both hPAH states.
Figure 7
Figure 7
Response of hPAHfree (non-incubated; blue) and hPAHPhe (1 mM l-Phe; red) to thermal denaturation and tryptic digestion. Panel A, thermal unfolding profile of hPAH as determined by far-UV CD. Each data point represents the mean of two independent assays and error bars represent the standard error. Panel B, thermal denaturation profiles of hPAH as determined by DSF. Both far-UV CD and DSF show two transitions that correspond to denaturation of the regulatory (first midpoint; Tm1) and catalytic (second midpoint; Tm2) domains. 1 mM l-Phe stabilises hPAH, resulting in an increase of both Tm values. Panel C, degradation of full-length hPAH by trypsin as a function of time. In each time point, the percentage of remaining full-length protein is normalised with respect to time 0 min. Each data point represents the mean of independent assays and error bars represent the standard error, where n = 4 for hPAHfree and n = 3 for hPAHPhe. The free enzyme is more susceptible to fast digestion. Conformational changes induced by l-Phe make hPAH more resistant to trypsin. The obtained melting temperatures (Tm) and proteolytic rates (kobs) are summarised in Table 2.

References

    1. van Wegberg AMJ, et al. The complete European guidelines on phenylketonuria: diagnosis and treatment. Orphanet Journal of Rare Diseases. 2017;12(1):162. - PMC - PubMed
    1. Erlandsen H, Patch MG, Gamez A, Straub M, Stevens RC. Structural studies on phenylalanine hydroxylase and implications toward understanding and treating phenylketonuria. Pediatrics. 2003;112(6 Pt 2):1557–65. - PubMed
    1. Erlandsen H, et al. Correction of kinetic and stability defects by tetrahydrobiopterin in phenylketonuria patients with certain phenylalanine hydroxylase mutations. Proc Natl Acad Sci U S A. 2004;101(48):16903–8. - PMC - PubMed
    1. Fitzpatrick PF. Structural insights into the regulation of aromatic amino acid hydroxylation. Curr Opin Struct Biol. 2015;35:1–6. - PMC - PubMed
    1. Andersen OA, Flatmark T, Hough E. High resolution crystal structures of the catalytic domain of human phenylalanine hydroxylase in its catalytically active Fe(II) form and binary complex with tetrahydrobiopterin. J Mol Biol. 2001;314(2):279–91. - PubMed

Publication types