

Feedlot performance and biological responses to coated and non-coated steroidal implants containing trenbolone acetate and estradiol benzoate in finishing beef steers1,2,3
- PMID: 31541251
- PMCID: PMC6827416
- DOI: 10.1093/jas/skz298
Feedlot performance and biological responses to coated and non-coated steroidal implants containing trenbolone acetate and estradiol benzoate in finishing beef steers1,2,3
Abstract
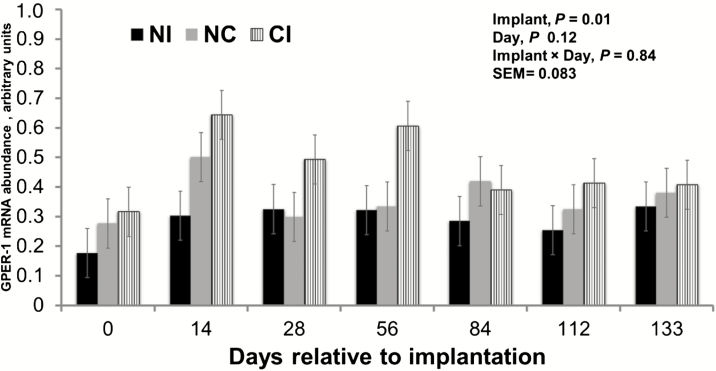
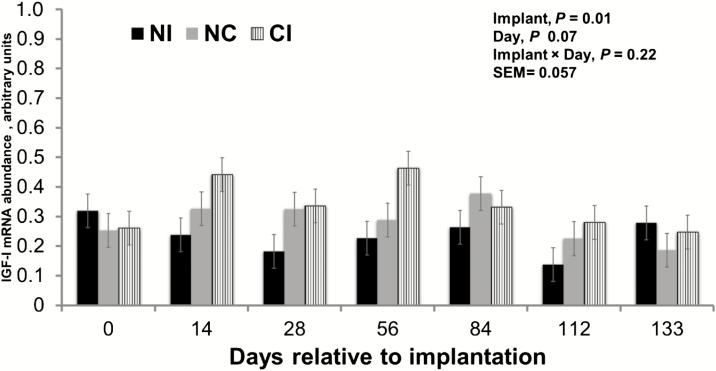
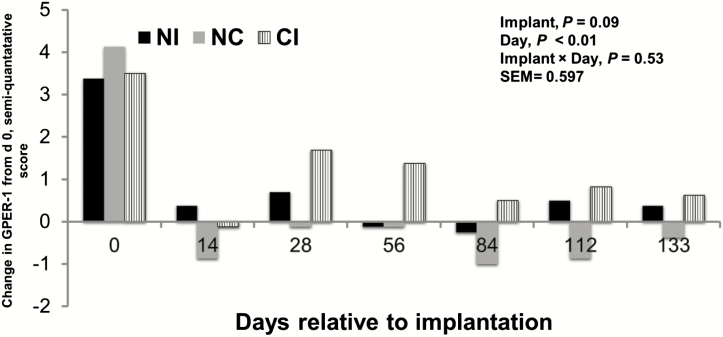
Predominately Angus steers (n = 24; initial BW = 435 ± 28.3 kg) were used to evaluate non-coated (NC) and coated implants (CI) containing equal amounts of trenbolone acetate (TBA; 200 mg) and estradiol benzoate (EB; 28 mg) in finishing steers on sera metabolite responses, gene expression, and immunohistochemical analyses of the Longissimus muscle (LM). Performance data were analyzed as a randomized complete block design, and all other data were analyzed as repeated measures for a completely randomized design. Treatments were no implant (NI), NC (Synovex-PLUS; Zoetis, Parsippany, NJ), and CI (Synovex-One Feedlot) implant. There were 2 pen replicates per treatment (n = 4 steers/pen). LM biopsies, blood, and BW were collected before feeding on days 0, 14, 28, 56, 84, 112, and 133, with final BW being captured on day 140. Genes of interest were determined by RT-qPCR using two housekeeping genes. Sera was analyzed for estradiol-17β (E2),17β-trenbolone (TbOH), insulin-like growth factor 1 (IGF-I), NEFA, and urea-N (SUN). An α of 0.10 determined significance for performance and sera data; α of 0.05 was used for gene and histology data. No performance differences (P ≥ 0.10) were detected. An implant × day interaction (P ≤ 0.10) for E2, IGF-I, and SUN was detected; implants elevated (P ≤ 0.10) E2, 17β-TbOH, and IGF-I; and decreased SUN across day of the study, meaning sera metabolites are not altered with time on feed. An implant × day interaction was detected for myogenic factor 5 (MYF-5) positive cells and proportions of MHCIIX. In LM, CI had greater (P < 0.10) IGF-I in LM over NI. CI increased (P < 0.05) G protein-coupled estrogen receptor 1 (GPER1) expression, as well as, GPER1 semi-quantitative scores over NI and NC. An implant × day interaction (P ≤ 0.05) for estrogen and androgen receptor-positive nuclei was detected; implants had increased (P ≤ 0.05) estrogen and androgen receptor-positive nuclei compared to NI. CIs increase genes associated with muscle tissue growth.
Keywords: beef; estradiol; insulin-like growth factor I; satellite cell; trenbolone.
© The Author(s) 2019. Published by Oxford University Press on behalf of the American Society of Animal Science. All rights reserved. For permissions, please e-mail: journals.permissions@oup.com.
Figures


Similar articles
-
Effects of implant status and breed type on feedlot performance, carcass characteristics, sera metabolites, and immunohistochemical responses in finishing steers.J Anim Sci. 2025 Jan 4;103:skaf003. doi: 10.1093/jas/skaf003. J Anim Sci. 2025. PMID: 39760134
-
Evaluation of coated steroidal implants containing trenbolone acetate and estradiol-17β on live performance, carcass traits, and sera metabolites in finishing steers.J Anim Sci. 2018 May 4;96(5):1704-1723. doi: 10.1093/jas/sky095. J Anim Sci. 2018. PMID: 29534183 Free PMC article.
-
Biological responses of beef steers to steroidal implants and zilpaterol hydrochloride.J Anim Sci. 2014 Aug;92(8):3348-63. doi: 10.2527/jas.2013-7221. Epub 2014 Jul 1. J Anim Sci. 2014. PMID: 24987078 Clinical Trial.
-
MEAT SCIENCE AND MUSCLE BIOLOGY SYMPOSIUM--role of satellite cells in anabolic steroid-induced muscle growth in feedlot steers.J Anim Sci. 2014 Jan;92(1):30-8. doi: 10.2527/jas.2013-7077. Epub 2013 Oct 28. J Anim Sci. 2014. PMID: 24166993 Review.
-
The Crossroads between Zinc and Steroidal Implant-Induced Growth of Beef Cattle.Animals (Basel). 2021 Jun 27;11(7):1914. doi: 10.3390/ani11071914. Animals (Basel). 2021. PMID: 34199133 Free PMC article. Review.
Cited by
-
Effects of Corn Silage Inclusion Level and Type of Anabolic Implant on Animal Growth Performance, Apparent Total Tract Digestibility, Beef Production per Hectare, and Carcass Characteristics of Finishing Steers.Animals (Basel). 2021 Feb 23;11(2):579. doi: 10.3390/ani11020579. Animals (Basel). 2021. PMID: 33672233 Free PMC article.
-
Effects of increasing doses of trenbolone acetate and estradiol on finishing phase growth performance, carcass trait responses, and serum metabolites in beef steers following implantation.Transl Anim Sci. 2020 Aug 26;4(3):txaa158. doi: 10.1093/tas/txaa158. eCollection 2020 Jul. Transl Anim Sci. 2020. PMID: 33005878 Free PMC article.
-
Effects of implant status and breed type on feedlot performance, carcass characteristics, sera metabolites, and immunohistochemical responses in finishing steers.J Anim Sci. 2025 Jan 4;103:skaf003. doi: 10.1093/jas/skaf003. J Anim Sci. 2025. PMID: 39760134
-
Temperature Fluctuations Modulate Molecular Mechanisms in Skeletal Muscle and Influence Growth Potential in Beef Steers.J Anim Sci. 2023 Jan 3;101:skad343. doi: 10.1093/jas/skad343. J Anim Sci. 2023. PMID: 37791975 Free PMC article.
-
Chromium propionate supplementation alters animal growth performance, carcass characteristics, and skeletal muscle properties in feedlot steers.Transl Anim Sci. 2020 Jul 30;4(3):txaa146. doi: 10.1093/tas/txaa146. eCollection 2020 Jul. Transl Anim Sci. 2020. PMID: 32905313 Free PMC article.
References
-
- Blackwell B. R., Brown T. R., Broadway P. R., Buser M. D., Brooks J. C., Johnson B. J., Cobb G. P., and Smith P. N.. 2014. Characterization of trenbolone acetate and estradiol metabolite excretion profiles in implanted steers. Environ. Toxicol. Chem. 33:2850–2858. doi:10.1002/etc.2757. - DOI - PubMed
-
- Bryant T. C., Engle T. E., Galyean M. L., Wagner J. J., Tatum J. D., Anthony R. V., and Laudert S. B.. 2010. Effects of ractopamine and trenbolone acetate implants with or without estradiol on growth performance, carcass characteristics, adipogenic enzyme activity, and blood metabolites in feedlot steers and heifers. J. Anim. Sci. 88:4102–4119. doi:10.2527/jas.2010-2901. - DOI - PubMed
-
- Chung K. Y., Baxa T. J., Parr S. L., Luqué L. D., and Johnson B. J.. 2012. Administration of estradiol, trenbolone acetate, and trenbolone acetate/estradiol implants alters adipogenic and myogenic gene expression in bovine skeletal muscle. J. Anim. Sci. 90:1421–1427. doi:10.2527/jas.2011-3496. - DOI - PubMed
-
- Dayton W. R., and White M. E.. 2013. Mechanisms of anabolic steroid action in bovine skeletal muscle. In: Evaluating veterinary pharmaceutical behavior in the environment. Washington (DC): ACS Publications. p.1–12.
MeSH terms
Substances
LinkOut - more resources
Full Text Sources
Medical
