

The shortcomings of accurate rate estimations in cultivation processes and a solution for precise and robust process modeling
- PMID: 31541314
- PMCID: PMC6960212
- DOI: 10.1007/s00449-019-02214-6
The shortcomings of accurate rate estimations in cultivation processes and a solution for precise and robust process modeling
Abstract
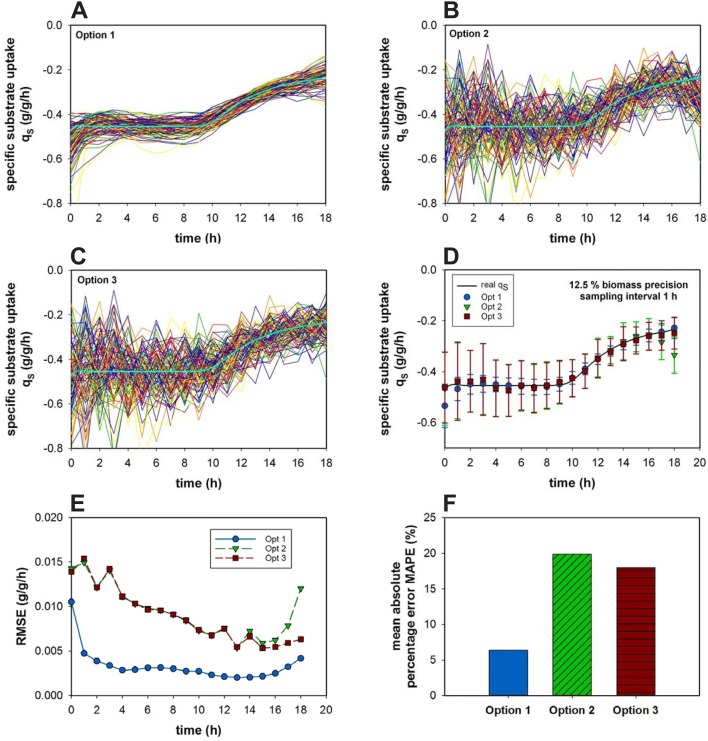
The accurate estimation of cell growth or the substrate consumption rate is crucial for the understanding of the current state of a bioprocess. Rates unveil the actual cell status, making them valuable for quality-by-design concepts. However, in bioprocesses, the real rates are commonly not accessible due to analytical errors. We simulated Escherichia coli fed-batch fermentations, sampled at four different intervals and added five levels of noise to mimic analytical inaccuracy. We computed stepwise integral estimations with and without using moving average estimations, and smoothing spline interpolations to compare the accuracy and precision of each method to calculate the rates. We demonstrate that stepwise integration results in low accuracy and precision, especially at higher sampling frequencies. Contrary, a simple smoothing spline function displayed both the highest accuracy and precision regardless of the chosen sampling interval. Based on this, we tested three different options for substrate uptake rate estimations.
Keywords: Bioprocess development; Cubic smoothing spline; Fed-batch fermentation; Growth rate; Substrate uptake rate.
Conflict of interest statement
The authors have declared no conflicts of interest.
Figures
Similar articles
-
Generic estimator of biomass concentration for Escherichia coli and Saccharomyces cerevisiae fed-batch cultures based on cumulative oxygen consumption rate.Microb Cell Fact. 2019 Nov 5;18(1):190. doi: 10.1186/s12934-019-1241-7. Microb Cell Fact. 2019. PMID: 31690339 Free PMC article.
-
The potential of random forest and neural networks for biomass and recombinant protein modeling in Escherichia coli fed-batch fermentations.Biotechnol J. 2015 Sep;10(11):1770-82. doi: 10.1002/biot.201400790. Epub 2015 Aug 11. Biotechnol J. 2015. PMID: 26121295
-
Scale-up bioprocess development for production of the antibiotic valinomycin in Escherichia coli based on consistent fed-batch cultivations.Microb Cell Fact. 2015 Jun 12;14:83. doi: 10.1186/s12934-015-0272-y. Microb Cell Fact. 2015. PMID: 26063334 Free PMC article.
-
Real-time monitoring and control of microbial bioprocesses with focus on the specific growth rate: current state and perspectives.Appl Microbiol Biotechnol. 2012 Jun;94(6):1469-82. doi: 10.1007/s00253-012-4095-z. Epub 2012 May 9. Appl Microbiol Biotechnol. 2012. PMID: 22569637 Review.
-
Bioreactor scale-up and oxygen transfer rate in microbial processes: an overview.Biotechnol Adv. 2009 Mar-Apr;27(2):153-76. doi: 10.1016/j.biotechadv.2008.10.006. Epub 2008 Nov 12. Biotechnol Adv. 2009. PMID: 19041387 Review.
Cited by
-
Monte Carlo-Based Error Propagation for a More Reliable Regression Analysis across Specific Rates in Bioprocesses.Bioengineering (Basel). 2021 Oct 26;8(11):160. doi: 10.3390/bioengineering8110160. Bioengineering (Basel). 2021. PMID: 34821726 Free PMC article.
-
Online 2D Fluorescence Monitoring in Microtiter Plates Allows Prediction of Cultivation Parameters and Considerable Reduction in Sampling Efforts for Parallel Cultivations of Hansenula polymorpha.Bioengineering (Basel). 2022 Sep 4;9(9):438. doi: 10.3390/bioengineering9090438. Bioengineering (Basel). 2022. PMID: 36134983 Free PMC article.
-
Time Integrated Flux Analysis: Exploiting the Concentration Measurements Directly for Cost-Effective Metabolic Network Flux Analysis.Microorganisms. 2019 Nov 27;7(12):620. doi: 10.3390/microorganisms7120620. Microorganisms. 2019. PMID: 31783658 Free PMC article.
-
Generic and specific recurrent neural network models: Applications for large and small scale biopharmaceutical upstream processes.Biotechnol Rep (Amst). 2021 May 28;31:e00640. doi: 10.1016/j.btre.2021.e00640. eCollection 2021 Sep. Biotechnol Rep (Amst). 2021. PMID: 34159058 Free PMC article.
-
Error propagation in constraint-based modeling of Chinese hamster ovary cells.Biotechnol J. 2021 Apr;16(4):e2000320. doi: 10.1002/biot.202000320. Epub 2021 Jan 6. Biotechnol J. 2021. PMID: 33340257 Free PMC article.
References
-
- Craven P, Wahba G. Smoothing noisy data with spline functions - Estimating the correct degree of smoothing by the method of generalized cross-validation. Numer Math. 1978;31(4):377–403. doi: 10.1007/BF01404567. - DOI
MeSH terms
Grants and funding
LinkOut - more resources
Full Text Sources
