. 2019 Oct;20(10):160-171.
doi: 10.1002/acm2.12733. Epub 2019 Sep 21.

Validation of the RayStation Monte Carlo dose calculation algorithm using realistic animal tissue phantoms

Affiliations

Validation of the RayStation Monte Carlo dose calculation algorithm using realistic animal tissue phantoms

Andries N Schreuder et al. J Appl Clin Med Phys. 2019 Oct.

Abstract

Purpose: The aim of this study is to validate the RayStation Monte Carlo (MC) dose algorithm using animal tissue neck phantoms and a water breast phantom.

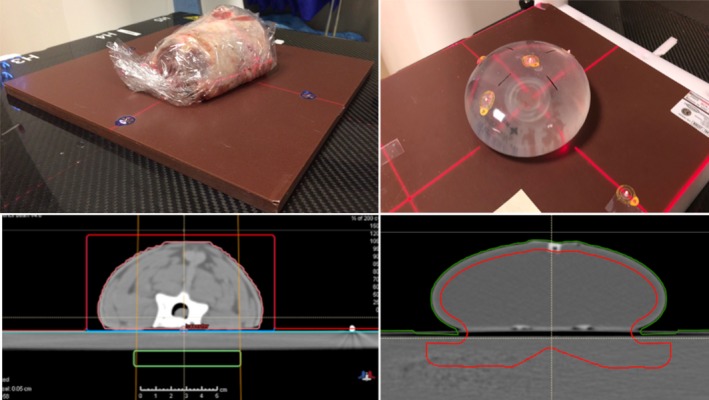
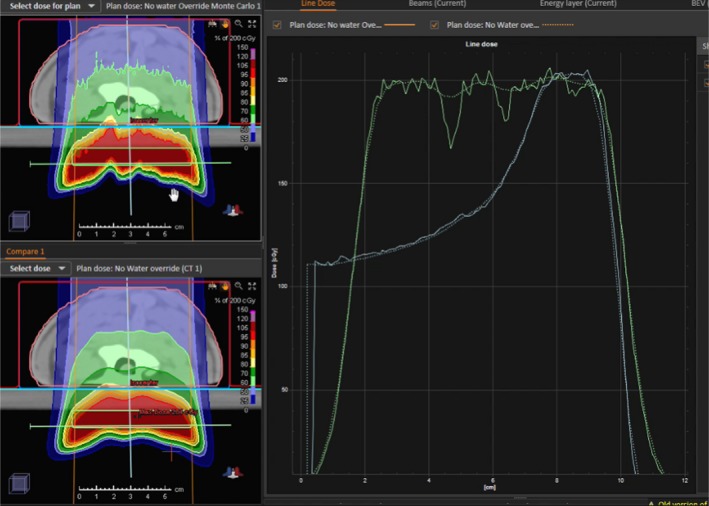
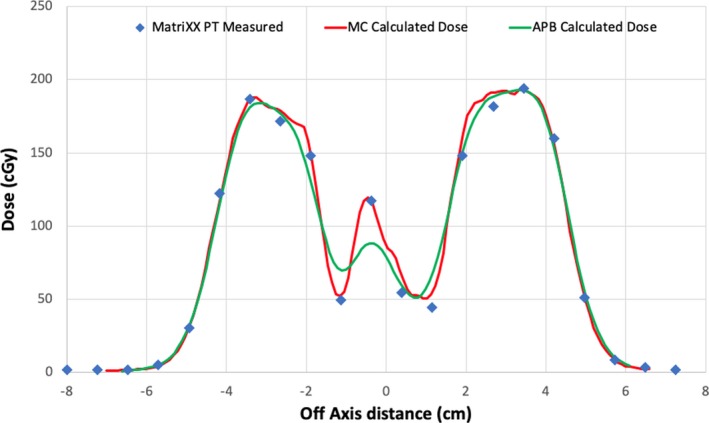
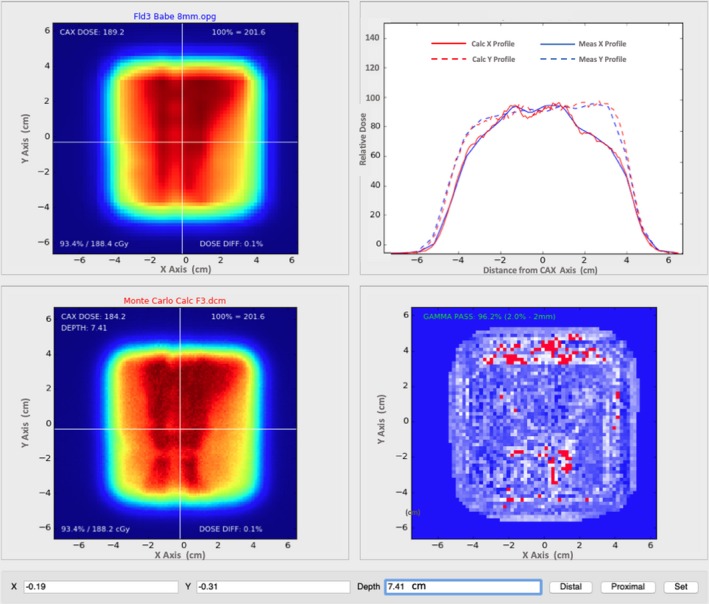
Methods: Three anthropomorphic phantoms were used in a clinical setting to test the RayStation MC dose algorithm. We used two real animal necks that were cut to a workable shape while frozen and then thawed before being CT scanned. Secondly, we made a patient breast phantom using a breast prosthesis filled with water and placed on a flat surface. Dose distributions in the animal and breast phantoms were measured using the MatriXX PT device.

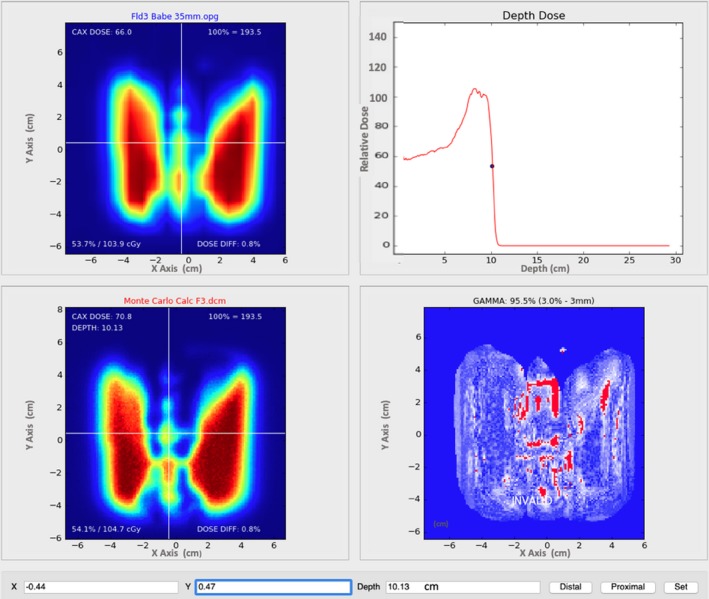
Results: The measured doses to the neck and breast phantoms compared exceptionally well with doses calculated by the analytical pencil beam (APB) and MC algorithms. The comparisons between APB and MC dose calculations and MatriXX PT measurements yielded an average depth difference for best gamma agreement of <1 mm for the neck phantoms. For the breast phantom better average gamma pass rates between measured and calculated dose distributions were observed for the MC than for the APB algorithms.

Conclusions: The MC dose calculations are more accurate than the APB calculations for the static phantoms conditions we evaluated, especially in areas where significant inhomogeneous interfaces are traversed by the beam.

Keywords: Monte Carlo; analytical dose algorithms; pencil beam scanning; proton therapy; spot scanning.


Conflict of interest statement

The authors have no relevant conflict of interest to disclose.

Figures

Figure 1
Figure 1
Representative phantoms used in this study: Lamb neck (left) and the water‐filled Mentor M + 350 cc sample prothesis (right) as seen by photography (upper) and computed tomography (lower). The green box in the left bottom pane and the red line in the lower‐right pane demarcates the dose optimization targets.
Figure 2
Figure 2
Dose distributions delivered to the realistic neck phantoms. Deer neck plans F1 and F2 are shown in panels A and B. The lamb neck plans, F3 and F4, are shown in panels C and D. The green boxes indicate the target regions used for the initial uniform dose plans that were modified as described in the text to obtain nonuniform dose distributions.
Figure 3
Figure 3
The breast phantom showing the beam orientations and measurement depths used. The red line demarcates the dose optimization target. The dose distributions shown were calculated with the APB algorithm. APB, analytical pencil beam.
Figure 4
Figure 4
A schematic showing the "expected DICOM depth" de, that is, the depth in the DICOM dose file at which we expect the best gamma index agreement given accurate dose calculation; the depth of measurement dm; and the depth of best gamma‐index agreement dγ. de is measured from the anterior surface of the dose cube (dotted line) to the placement of the measuring plane inside the MatriXX PT (blue dashed line). dm is measured from the solid water surface (blue line) to the same position. dγ is determined by varying the dose calculation plane until best agreement is obtained with our in‐house software given the reference position of solid water surface (blue line).
Figure 5
Figure 5
A comparison of dose distributions calculated by the Monte Carlo algorithm (upper left) and analytical pencil beam algorithm (lower left) for the lamb neck phantom in the region where the largest differences were observed. The depth dose and lateral dose profiles along the vertical pale blue and horizontal green lines in the left panels are shown in the right pane for the MC (solid) and APB (dotted) doses. APB, analytical pencil beam.
Figure 6
Figure 6
Lateral profiles comparing the MatriXX PT measured (blue triangles), MC calculated (red lines), and APB calculated (green lines) at a measurement depth of 35 mm in solid water (Dicom depth = 101.3 mm) for the lamb neck phantom plan F3. APB, analytical pencil beam.
Figure 7
Figure 7
Our in‐house gamma analysis software comparing MC dose (lower left) at a depth of 8 mm beyond the lamb phantom via the MatriXX PT (upper left) with 2‐mm grid interpolation. Agreement at 2%/2 mm is 96.2% at a DICOM depth of 74.1 mm from the anterior edge of the dose cube (lower right). Dose profiles in the lateral (solid lines) and longitudinal (dashed lines) central axes are also displayed for the MC dose (red) and measured dose (blue) in the remaining pane (upper right). This depth is anterior to the Bragg peak.
Figure 8
Figure 8
Our in‐house gamma analysis software comparing MC dose (lower left) at a depth of 35 mm beyond the lamb phantom via the MatriXX PT (upper left) with 2‐mm grid interpolation. Agreement at 3%/3 mm is 96.2% at a DICOM depth of 101.2 mm from the anterior edge of the dose cube (lower right). This depth is within the Bragg peak falloff (upper right).

References

    1. Durante MORLJ. Charged‐particle therapy in cancer: clinical uses and future perspectives. Nat Rev: Clin Oncol. 2017;14:483–495. - PubMed
    1. Particle Therapy Co‐Operative Group . Particle therapy facilities in operation. Particle Therapy Co‐Operative Group. 2018. Available at: https://ptcog.ch/index.php/facilities‐in‐operation. Accessed November 29, 2018.
    1. Schreuder AN, Hedrick SG, Renegar JR, et al. A review of proton radiation therapy and the path to widespread clinical adoption. Med Phys Int J. 2016;4:35–46.
    1. Bortfeld TR, Loeffler JS. Three ways to make proton therapy affordable. Nature. 2017;549:451–453. - PubMed
    1. Löf J. First PBS/IMPT Proton Treatments with RayStation. 2014. Available at: https://www.raysearchlabs.com/media/press‐old/?year=2014&cisionid =1629464. Accessed November 26, 2018.

Publication types

LinkOut - more resources