. 2019 Nov 6;104(3):458-470.e5.
doi: 10.1016/j.neuron.2019.08.008. Epub 2019 Sep 18.

Pathogenic Tau Impairs Axon Initial Segment Plasticity and Excitability Homeostasis

Affiliations

Pathogenic Tau Impairs Axon Initial Segment Plasticity and Excitability Homeostasis

Peter Dongmin Sohn et al. Neuron. .

Abstract

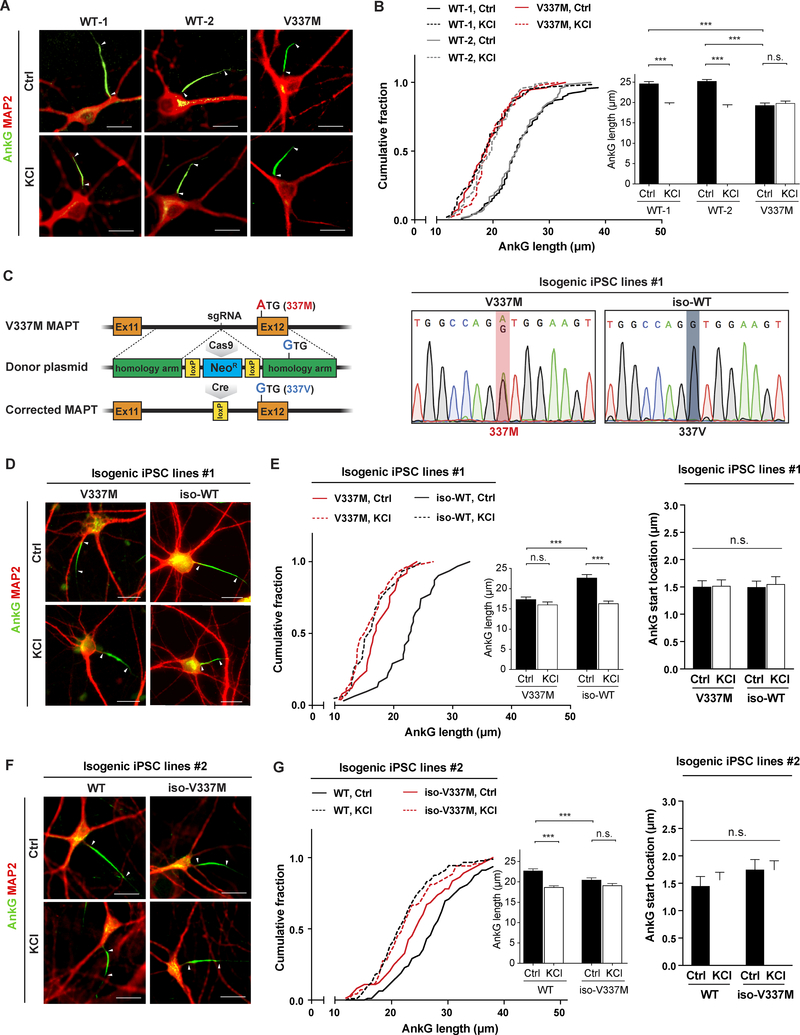
Dysregulation of neuronal excitability underlies the pathogenesis of tauopathies, including frontotemporal dementia (FTD) with tau inclusions. A majority of FTD-causing tau mutations are located in the microtubule-binding domain, but how these mutations alter neuronal excitability is largely unknown. Here, using CRISPR/Cas9-based gene editing in human pluripotent stem cell (iPSC)-derived neurons and isogenic controls, we show that the FTD-causing V337M tau mutation impairs activity-dependent plasticity of the cytoskeleton in the axon initial segment (AIS). Extracellular recordings by multi-electrode arrays (MEAs) revealed that the V337M tau mutation in human neurons leads to an abnormal increase in neuronal activity in response to chronic depolarization. Stochastic optical reconstruction microscopy of human neurons with this mutation showed that AIS plasticity is impaired by the abnormal accumulation of end-binding protein 3 (EB3) in the AIS submembrane region. These findings expand our understanding of how FTD-causing tau mutations dysregulate components of the neuronal cytoskeleton, leading to network dysfunction.

Keywords: EB3; FTD; axon initial segment; cytoskeleton; homeostasis; neuronal activity; tau.


Figures

Figure 1.
Figure 1.. TauV337M Shortens the AIS and Impairs AIS Plasticity in Human iPSC-Derived Neurons
(A) Representative images show immunostaining for AnkG in the AIS and MAP2 in the somatodendritic compartment in human iPSC-derived WT and tauV337M neurons treated with 10 mM NaCl (Ctrl) or KCl for 48 hr. Arrowheads indicate the start and end of the AIS. (B) Quantification of the length of AnkG shown by immunostaining in WT and tauV337M neurons treated with 10 mM NaCl (Ctrl) or KCl for 48 hr. n = 43–72 cells/group from three to five independent experiments. ***p < 0.001 by one-way ANOVA and Tukey’s post-hoc analysis. (C) Schematic diagram of CRISPR gene editing at V337M MAPT and the DNA sequences before and after targeted gene editing. (D) Representative images show immunostaining for AnkG in the AIS and MAP2 in the somatodendritic compartment in tauV337M and the corrected isogenic WT control (iso-WT) neurons treated with 10 mM NaCl (Ctrl) or KCl for 48 hr. Arrowheads indicate the start and end of the AIS. (E) Quantification of the length and start location of AnkG shown by immunostaining in tauV337M and iso-WT neurons treated with 10 mM NaCl (Ctrl) or KCl for 48 hr. n = 68–73 cells/group and n = 49–55 cells/group from three independent experiments for length and start location, respectively. ***p < 0.001 by one-way ANOVA and Tukey’s post-hoc analysis. (F) Representative images show immunostaining for AnkG in the AIS and MAP2 in the somatodendritic compartment in WT and isogenic tauV337M (iso-V337M) neurons treated with 10 mM NaCl (Ctrl) or KCl for 48 hr. Arrowheads indicate the start and end of the AIS. (G) Quantification of the length and start location of AnkG shown by immunostaining in WT and iso-V337M neurons treated with 10 mM NaCl (Ctrl) or KCl for 48 hr. n = 54–56 cells/group and n = 45–49 cells/group from three independent for length and start location, respectively. ***p < 0.001 by one-way ANOVA and Tukey’s post-hoc analysis. Values are mean ± SEM. Scale bars, 15 μm.
Figure 2.
Figure 2.. Homeostatic Control of Neuronal Excitability Is Impaired in TauV337M Neurons
(A) MEA system #1. These MEAs have 16 electrodes per well arranged in a 4×4 grid and spaced at 350 μm. (B) Representative raster plots of action potentials of tauV337M and iso-WT neurons detected from 16 electrodes in a single well of MEA system #1. Blue raster plots and boxes indicate action potentials involved in network bursts. (C) Representative recordings from tauV337M and iso-WT neurons on MEA system #1. (D-I) Spike, burst, and network burst parameters measured for tauV337M and iso-WT neurons on MEA system #1. n = 31–45 wells/group from three independent experiments. *p < 0.05, **p < 0.01, ***p < 0.001 by unpaired t-test. (J) MEA system #2. These MEAs have 120 recording electrodes arranged in a 12×12 grid and spaced at 100 μm. (K) Neuronal firing rate of tauV337M (n = 12) and iso-WT (n = 16) neurons on MEA system #2 from three independent recordings before and after chronic depolarization with KCl. **p < 0.01 by two-way ANOVA. Values are mean ± SEM.
Figure 3.
Figure 3.. EB3 Shows Increased Binding with Tau V337M and Is Accumulated in the AIS of Tau V337M Neurons
(A) Profile of tau binding to EB3 as probed by 15N-HSQC of K18 tau containing the four microtubule-binding repeats. The NMR intensity ratio I/I0 is shown for individual peaks derived from HSQC spectra (I, chaperone present, I0, tau alone) where EB3 was present at a 2:1 molar ratio to tau. Red lines indicate potential EB3 binding sites of tau indicated by decreases in the NMR intensity ratio. (B) Tau binding to EB3 measured by ELISA-based assay. Cumulative binding percentage of full-length WT tau and tauV337M to EB3 from three independent experiments. Dissociation constants (Kd) are indicated on top of the graph. (C) Representative images show immunostaining of AnkG and EB3 in the AIS in WT, tauV337M, and iso-WT neurons. Arrowheads indicate the start and end of the AIS. Dashed lines indicate the boundary of the cell body. Scale bars, 15 μm. (D, E) Quantification of the intensity of AnkG and EB3 immunostaining in WT, tauV337M, and iso-WT neurons. n = 55–59 cells/group from three independent experiments. ***p < 0.001 by one-way ANOVA and Tukey’s post-hoc analysis. (F) Intensity profile of EB3 immunostaining along the axon in WT, tauV337M, and iso-WT neurons. n = 45–47 cells/group from three independent experiments. **p < 0.01 by multilevel mixed model analysis. Values are mean ± SEM.
Figure 4.
Figure 4.. Increased EB3 Level Is Associated with AnkG and Tau in the AIS Submembrane Region of TauV337M Neurons
(A) Representative 3D-STORM images of EB3 immunostaining in the AIS of WT, tauV337M, and iso-WT neurons. Color is used to indicate depth in z according to the color scale. Scale bar, 1 μm. Right panel: cross-sections of boxed regions in the left panel. Dashed circles represent the membrane of the axon; white dots represent the center of the cytoplasm. Scale bar, 200 nm. (B) Radial distribution of EB3 in cross section of the AIS of WT (n = 8), tauV337M (n = 14), and iso-WT (n = 5) neurons. The distance from the center to the periphery of the cell was normalized to 1. ***p < 0.001 by multilevel mixed model analysis. (C) Representative dual-color 3D-STORM images of EB3 (magenta) and AnkG (green) in the AIS of WT, tauV337M, and iso-WT neurons. Dashed circles represent the membrane of the axon; white dots represent the center of the cytoplasm. Scale bars, 1 pm. Right panel: cross-sections of boxed regions in the left panel. Scale bars, 200 nm. (D) Radial distribution of AnkG in the AIS of WT (n = 7), tauV337M (n = 12), and iso-WT (n = 5) neurons. Values are mean ± SEM. (E) Representative dual-color 3D-STORM images of tau (magenta) and EB3 (green) in the ATS of WT, tauV337M, and iso-WT neurons. Scale bars, 1 μm. Right panel: cross-sections of boxed regions in the left panel. Dashed circles represent the membrane of the axon; white dots represent the center of the cytoplasm. Scale bars, 200 nm. (F) Radial distribution of tau in the AIS of WT (n = 8), tauV337M (n = 16), and iso-WT (n = 7) neurons. (G, H) Cross-correlation analysis of EB3-AnkG and EB3-tau from dual-color 3D-STORM images. The pair cross-correlation function between the two channels was calculated from the distribution of intermolecular distances (x-axis) and normalized to that of randomly distributed sets of molecules with similar apparent sizes. Each curve represents the average of three independent neurons within each group. Cross-correlation indices for the first three distances (<30 nm) are taken as quantitation of co-localization, which is subject to the two-sample t test. *p < 0.05, ***p < 0.001. Values are mean ± SEM.
Figure 5.
Figure 5.. Critical Role of EB3 in Regulating AIS Plasticity and Activity Homeostasis
(A) Representative images show immunostaining of EB3 in tauV337M neurons treated with control siRNA or EB3 siRNA. Arrowheads indicate the start and end of the AIS stained with EB3. (B) Quantification of EB3 intensity in tauV337M neurons treated with control siRNA or EB3 siRNA. n = 12 images/group from three independent experiments. ***p < 0.001 by unpaired t test. (C) Representative images show immunostaining for AnkG in the AIS and MAP2 in the somatodendritic compartment in tauV337M neurons treated with control siRNA or EB3 siRNA. The neurons were treated with 10 mM NaCl (Ctrl) or KCl for 48 hr. Arrowheads indicate the start and end of the AIS. (D) Quantification of the length of AnkG shown by immunostaining of tauV337M neurons treated with control siRNA or EB3 siRNA and then with 10 mM NaCl (Ctrl) or KCl for 48 hr. n = 43–52 cells/group from three independent experiments. (E) Neuronal firing rate of tauV337M and iso-WT neurons before and after chronic depolarization with 10mM KCl for 48 hr on MEA system #1 with 16 recording electrodes spaced at 350 μm. n = 11–18 wells/group from two to three independent experiments. *p < 0.05 by paired t-test. (F) Neuronal firing rate of tauV337M neurons treated with control siRNA or EB3 siRNA. Recordings were performed before and after chronic depolarization with 10mM KCl for 48 hr on MEA system #1. n = 9–13 wells/group from two independent experiments. *p < 0.05 by paired t-test. (G) Representative images show immunostaining for GFP and AnkG in iso-WT neurons transfected with GFP or EB3-GFP and treated with 10 mM NaCl (Ctrl) or KCl for 48 hr. Arrowheads indicate the start and end of the AIS. Dashed lines indicate the axon. (H) Quantification of the length of AnkG shown by immunostaining in iso-WT neurons transfected with GFP or EB3-GFP and treated with 10 mM NaCl (Ctrl) or KCl for 48 hr. n = 37–98 cells/group from four independent experiments. ***p < 0.001 by one-way ANOVA and Tukey’s post-hoc analysis. Values are mean ± SEM. Scale bars, 15 μm.
Figure 6.
Figure 6.. Tau Knockdown in TauV337M Neurons Elongates the AIS and Restores AIS Plasticity by an EB3-Dependent Mechanism
(A) Representative images of the immunostaining for tau with HT7 antibody in tauV337V neurons treated with control siRNA or tau siRNA (left). Quantification of tau intensity in tauV337V neurons treated with control siRNA or tau siRNA (right). n = 12 images/group from three independent experiments. *** p < 0.001 by unpaired t test. Scale bars, 40 μm. (B) Representative images show immunostaining for EB3 in tauV337V neurons treated with control siRNA or tau siRNA. Arrowheads indicate the start and end of the AIS stained for EB3. Dashed lines indicate the boundary of the cell bodies (left). Quantification of EB3 intensity and length in tauV337V neurons treated with control siRNA or tau siRNA (right). n = 43–48 cells/group from three independent experiments. *** p < 0.001 by unpaired t test. Scale bars, 15 μm. (C) Representative images of the immunostaining of AnkG in the AIS and MAP2 in the somatodendritic compartment in tauV337M neurons treated with control siRNA or tau siRNA and treated with 10 mM NaCl (Ctrl) or KCl for 48 hr. Arrowheads indicate the start and end of the AIS. (D) Quantification of the length of AnkG shown by immunostaining in tauV337M neurons treated first with control siRNA or tau siRNA and then with 10 mM NaCl (Ctrl) or KCl for 48 hr. n = 57–65 cells/group from three independent experiments. (E) Representative images show immunostaining for GFP and AnkG in tauV337M neurons treated with tau siRNA, transfected with GFP or EB3-GFP, and treated with 10 mM NaCl (Ctrl) or KCl for 48 hr. Arrowheads indicate the start and end of the AIS. Dashed lines indicate the axon. (F) Quantification of the length of AnkG shown by immunostaining in tauV337M neurons treated with tau siRNA, transfected with GFP or EB3-GFP, and treated with 10 mM NaCl (Ctrl) or KCl for 48 hr. n = 41–53 cells/group from three independent experiments. ***p < 0.001 by one-way ANOVA and Tukey’s post-hoc analysis. Values are mean ± SEM. Scale bars, 15 μm.
Figure 7.
Figure 7.. V337M Tau Reduces AIS Length and Impairs AIS Plasticity by an EB3-Dependent Mechanism
Model of the cytoskeletal composition of the AIS and activity-dependent plasticity in WT and tauV337M neurons. In WT neurons (top), EB3 is evenly distributed throughout the cytoplasm of the AIS. A portion of AnkG remains unbound to EB3 and is susceptible to reorganization, resulting in depolarization-induced AIS shortening. In tauV337M neurons (bottom), EB3 accumulates abnormally in the AIS submembrane and binds to more AnkG and tau, making the AIS cytoskeleton shorter and resistant to reorganization. Consequently, the AIS remains unchanged in response to depolarization.

Comment in

References

    1. Ban H, Nishishita N, Fusaki N, Tabata T, Saeki K, Shikamura M, Takada N, Inoue M, Hasegawa M, Kawamata S, et al. (2011). Efficient generation of transgene-free human induced pluripotent stem cells (iPSCs) by temperature-sensitive Sendai virus vectors. Proc Natl Acad Sci U S A 108, 14234–14239. - PMC - PubMed
    1. Barre P, and Eliezer D (2013). Structural transitions in tau k18 on micelle binding suggest a hierarchy in the efficacy of individual microtubule-binding repeats in filament nucleation. Protein Sci 22, 1037–1048. - PMC - PubMed
    1. Beagle AJ, Darwish SM, Ranasinghe KG, La AL, Karageorgiou E, and Vossel KA (2017). Relative Incidence of Seizures and Myoclonus in Alzheimer’s Disease, Dementia with Lewy Bodies, and Frontotemporal Dementia. J Alzheimers Dis 60, 211–223. - PMC - PubMed
    1. Bender KJ, and Trussell LO (2009). Axon initial segment Ca2+ channels influence action potential generation and timing. Neuron 61, 259–271. - PMC - PubMed
    1. Bridges DC, Tovar KR, Wu B, Hansma PK, and Kosik KS (2018). MEA Viewer: A high- performance interactive application for visualizing electrophysiological data. PLoS One 13, e0192477. - PMC - PubMed

Publication types

MeSH terms