. 2019 Nov;74(5):1200-1214.
doi: 10.1161/HYPERTENSIONAHA.119.13791. Epub 2019 Sep 23.

Increased Vascular Contractility in Hypertension Results From Impaired Endothelial Calcium Signaling

Affiliations

Increased Vascular Contractility in Hypertension Results From Impaired Endothelial Calcium Signaling

Calum Wilson et al. Hypertension. 2019 Nov.

Abstract

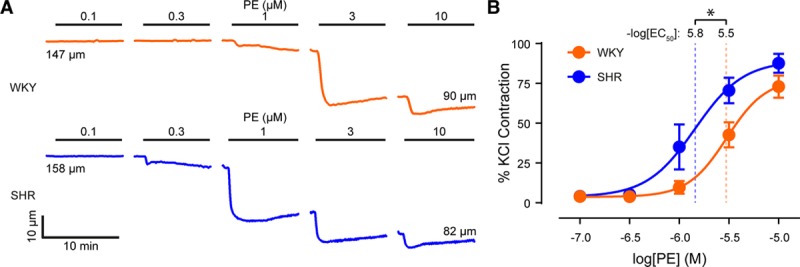
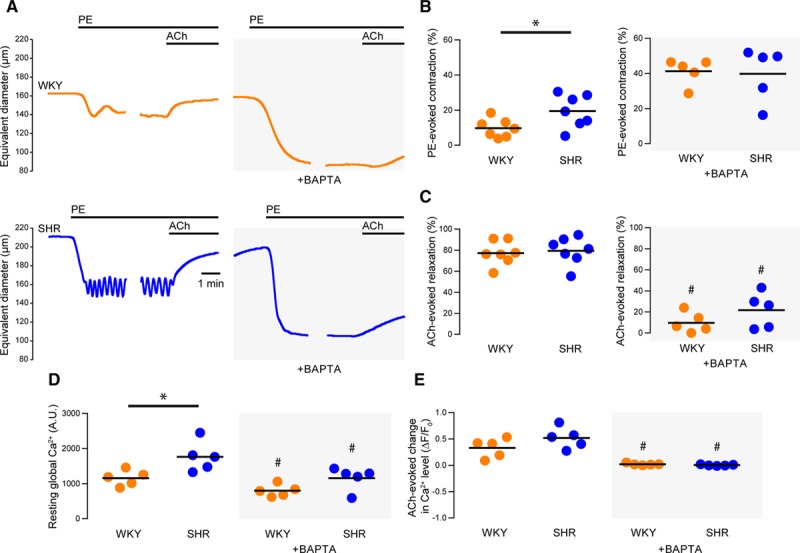
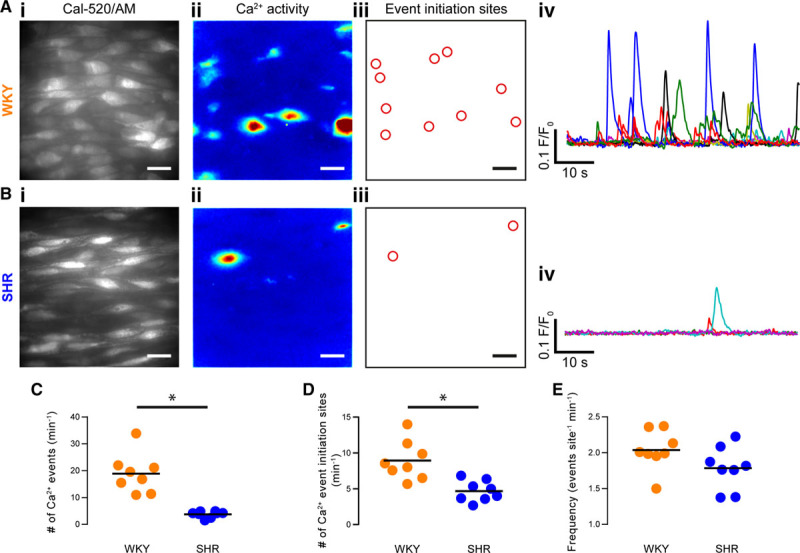
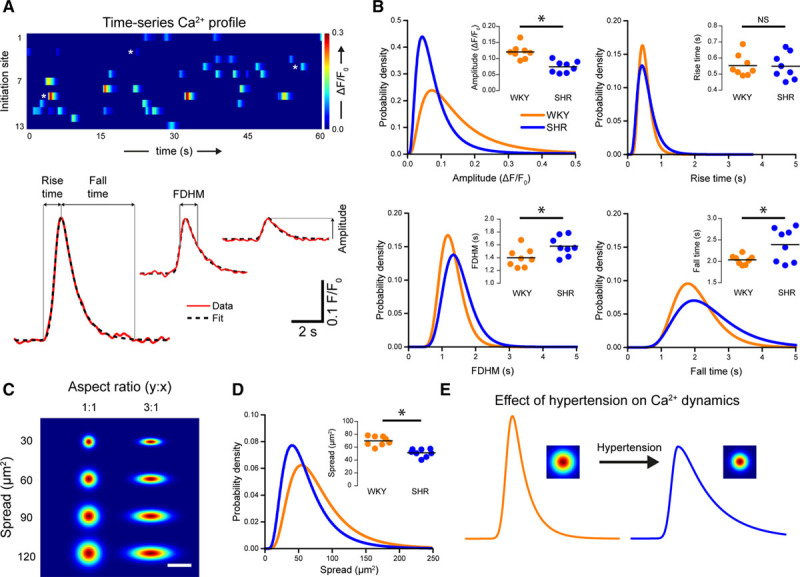
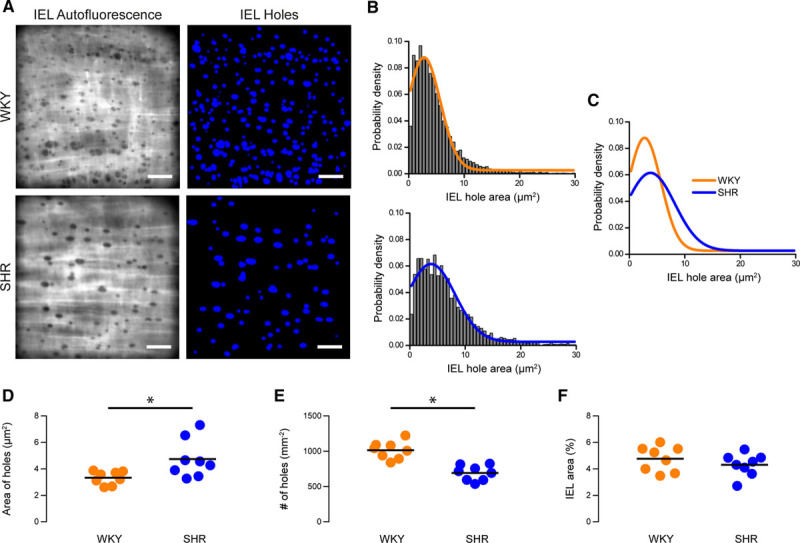
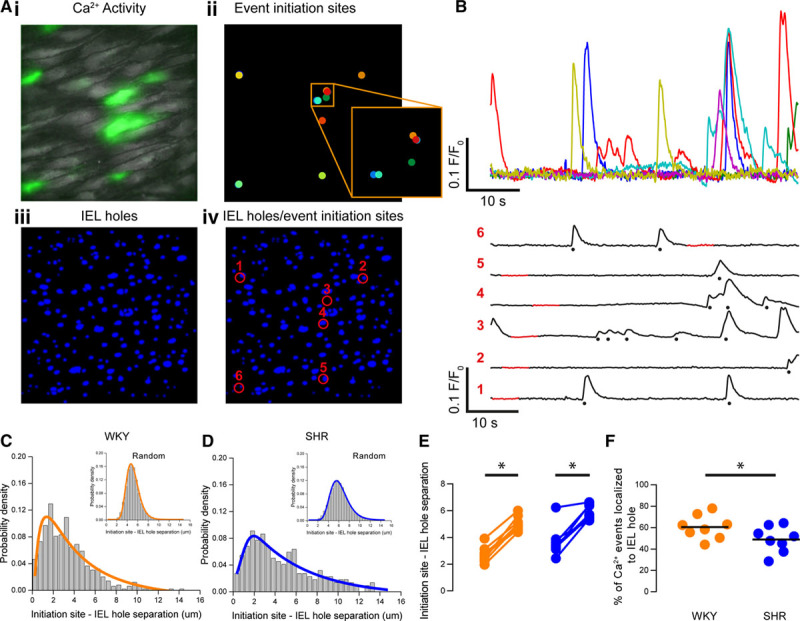
Endothelial cells line all blood vessels and are critical regulators of vascular tone. In hypertension, disruption of endothelial function alters the release of endothelial-derived vasoactive factors and results in increased vascular tone. Although the release of endothelial-derived vasodilators occurs in a Ca2+-dependent manner, little is known on how Ca2+ signaling is altered in hypertension. A key element to endothelial control of vascular tone is Ca2+ signals at specialized regions (myoendothelial projections) that connect endothelial cells and smooth muscle cells. This work describes disruption in the operation of this key Ca2+ signaling pathway in hypertension. We show that vascular reactivity to phenylephrine is increased in hypertensive (spontaneously hypertensive rat) when compared with normotensive (Wistar Kyoto) rats. Basal endothelial Ca2+ activity limits vascular contraction, but that Ca2+-dependent control is impaired in hypertension. When changes in endothelial Ca2+ levels are buffered, vascular contraction to phenylephrine increased, resulting in similar responses in normotension and hypertension. Local endothelial IP3(inositol trisphosphate)-mediated Ca2+ signals are smaller in amplitude, shorter in duration, occur less frequently, and arise from fewer sites in hypertension. Spatial control of endothelial Ca2+ signaling is also disrupted in hypertension: local Ca2+ signals occur further from myoendothelial projections in hypertension. The results demonstrate that the organization of local Ca2+ signaling circuits occurring at myoendothelial projections is disrupted in hypertension, giving rise to increased contractile responses.

Keywords: blood pressure; calcium; endothelial cells; hypertension; phenylephrine.


Figures

Figure 1.
Figure 1.
Contractions to phenylephrine (PE) are enhanced in hypertension. A, Representative diameter traces showing the effects of cumulatively applied phenylephrine (0.1 µmol/L–10 µmol/L) on small mesenteric arteries from normotensive (Wistar Kyoto [WKY], top) and hypertensive (spontaneously hypertensive rat [SHR], bottom) animals. B, Concentration-response curves for the contractile effect of phenylephrine on small mesenteric arteries. Contraction is expressed as a percentage of the maximum contraction induced by a depolarizing solution containing 70 mmol/L KCl, which did not differ between strains (Figure S3). Data are shown as mean values±SEM (n=5 for each). *Significance (P<0.05) using extra sum-of-squares F test. EC50 indicates half-maximal effective concentration
Figure 2.
Figure 2.
Endothelial Ca2+ activity is reduced by BAPTA-AM. A, Representative artery diameter traces from normotensive (Wistar Kyoto [WKY], top) and hypertensive (spontaneously hypertensive rat [SHR], bottom) animals before (left) and after (right) buffering of endothelial Ca2+ using 1,2-Bis(2-aminophenoxy)ethane-N,N,N′,N′-tetraacetic acid tetrakis acetoxymethyl ester. Phenylephrine (PE) and acetylcholine (ACh) were each used at a concentration of 1 µmol/L. B and C) Summary data showing PE-induced contraction (B) and ACh-induced dilation (C) before (left) and after (right) buffering of intracellular Ca2+ with BAPTA. D, Summary data illustrating the effects of BAPTA on resting endothelial Ca2+ levels in the absence and presence of BAPTA. E, Summary data illustrating the effects of BAPTA on ACh-evoked increases (ΔF/F0) in endothelial Ca2+ levels. ACh-evoked changes in Ca2+ levels were assessed before the onset of relaxation. WKY is denoted by orange data points and SHR by blue data points. *P<0.05 for WKY vs SHR, unpaired t test with Welch correction. #P<0.05 vs corresponding control, paired t test. A.U. indicates arbitrary units.
Figure 3.
Figure 3.
Spontaneous, local endothelial Ca2+ signaling is impaired in hypertension. A and B, Endothelial cells in intact arteries from normotensive rats (Wistar Kyoto [WKY], A) and spontaneously hypertensive rats (SHR; B) exhibit local subcellular Ca2+ signals under basal conditions (ie, in the absence of either mechanical or pharmacological stimulation). Scale bars=20 µm. i, High-resolution and wide field-of-view (×100 objective, NA=1.3, ≈13.3 × ≈13.3 µm field, ≈50 whole or partial cells) gray-scale images (left) of the endothelium of intact arteries (≈50 cells) loaded with the Ca2+ indicator, Cal-520-AM; (ii) composite images showing the SD of intensity from 1-min recordings of Ca2+ activity of the corresponding field of endothelium shown in i; (iii) automatically generated regions of interest placed at the center of Ca2+ event initiation sites, from the same data illustrated in i and ii; and (iv) baseline-corrected Ca2+ signals (F/F0) extracted from the ROIs shown in iii. C through E, Summary data showing: (C) the number of event initiation sites; (D) the total number of Ca2+ events; and (E) the average event frequency at each active event initiation site. WKY is denoted by orange data points and SHR by blue data points. Each data point illustrates the mean value obtained from at least 3 separate fields of endothelial cells from a single animal, the black line indicates the mean of means (n=8 animals for both WKY and SHR). *P<0.05, unpaired t test with Welch correction.
Figure 4.
Figure 4.
Ca2+ signaling dynamics are altered in hypertension. A, Basal Ca2+ signals from a Wistar Kyoto (WKY) control displayed as parallel heat maps (top) and Ca2+ transients (bottom; red line) shown with exponentially modified gaussian fits. The Ca2+ event traces are indicated by heat map by white stars. The model was used to extract the indicated temporal parameters. B, Probability distributions and summary data (insets) of amplitude, full duration at half maximum (FDHM), rise time, and fall time for WKY (orange) and spontaneously hypertensive rat (SHR; blue) animals. Distributions are log-normal curves fitted to pooled data (N=753 events from 8 animals for WKY; N=314 events from 8 animals for SHR). Because of the log-normal distribution, a logarithmic transform was applied to raw data. Summary data show geometric means (calculated by back transforming the mean of log-transformed data). *Significance (P<0.05) using unpaired t tests with Welch correction on the log-transformed data. C, Example plots of 2-dimensional gaussians demonstrating the function used to calculate spatial spread. Functions increase in area down the vertical, and the 2 columns illustrate the effect of alterations in aspect ratio. Spread was determined by calculating the elliptical area covered by the 2-dimensional function. Scale bar=20 µm. D, Probability distribution and summary data (inset) showing the effect of hypertension on the spread of Ca2+ events from their point of origin. Summary data show geometric means of data obtained from individual animals. *Significance (P<0.05) using unpaired t test with Welch correction on the log-transformed data (n=8). E, Illustration of the effect of hypertension on basal endothelial Ca2+ signals. In hypertension, Ca2+ signals are smaller in amplitude and spread but persist for longer due to an increase in the time taken for the Ca2+ level to return to baseline. NS indicates nonsignificant.
Figure 5.
Figure 5.
Structural internal elastic lamina (IEL) alterations in hypertension. A, Representative images of IEL holes in mesenteric arteries from Wistar Kyoto (WKY) control (top row) and hypertensive (bottom row) animals. Left, Raw elastin autofluorescence images. These images were processed and inverted to highlight IEL holes (right). Scale bars=20 µm. B and C, Probability density distributions of IEL hole size in mesenteric arteries from WKY (B, top; orange) and spontaneously hypertensive rat (SHR; C, top; blue) animals showing the effect of hypertension on the spread of Ca2+ events from their point of origin (C). Distributions are log-normal curves fitted to pooled data (N=8320 IEL holes from 8 animals for WKY; N=4368 holes from 8 animals for SHR). DF, Summary data showing the effect of hypertension on IEL hole area (D), IEL hole density (E), and the area of IEL occupied by holes (F). In D, geometric means (calculated by back transforming the mean of log-transformed data) of data from individual animals is shown. In G and H, means of untransformed data are shown. *Significance (P<0.05) using unpaired t tests with Welch correction on log-transformed (D) or untransformed (E and F) data.
Figure 6.
Figure 6.
Decoupling of Ca2+ events from myoendothelial junctions in hypertension. A, Composite image showing endothelial Ca2+ activity in green (i), Ca2+ event initiation sites (ii), internal elastic lamina (IEL) holes (iii), and an overlay of Ca2+ event initiation sites and IEL holes (iv). B and C, Ca2+ signals extracted from the sites shown in Aiv. In C, the Ca2+ signals have been spread out for clarity. The red portion of the signal demarcates the automatically determined baseline region, and detected events are indicated by stars. D and E, Probability density distributions illustrating the log-normal distribution of the measured separation between Ca2+ event initiation sites and IEL holes for Wistar Kyoto (WKY; D) and spontaneously hypertensive rat (SHR; E). Distributions arising from randomly permuted data are also shown (insets). F, Paired summary data showing that the mean centroid-centroid distance between Ca2+ event initiation sites and the nearest IEL observed was significantly lower than expected than a randomized distribution Ca2+ event initiation sites in both SHR and WKY endothelium (paired data points). G, Summary data showing a reduction in the percentage of Ca2+ events localized to IEL holes in hypertension. *Significance (P<0.05) using paired t tests on log-transformed data (F) or unpaired t test with Welch correction (G).

References

    1. Lawes CM, Vander Hoorn S, Rodgers A International Society of Hypertension. Global burden of blood-pressure-related disease, 2001. Lancet. 2008;371:1513–1518. doi: 10.1016/S0140-6736(08)60655-8. - PubMed
    1. Harris DM, Cohn HI, Pesant S, Eckhart AD. GPCR signalling in hypertension: role of GRKs. Clin Sci (Lond) 2008;115:79–89. doi: 10.1042/CS20070442. - PubMed
    1. Touyz RM. Molecular and cellular mechanisms in vascular injury in hypertension: role of angiotensin II. Curr Opin Nephrol Hypertens. 2005;14:125–131. - PubMed
    1. Coffman TM. Under pressure: the search for the essential mechanisms of hypertension. Nat Med. 2011;17:1402–1409. doi: 10.1038/nm.2541. - PubMed
    1. Touyz RM. New insights into mechanisms of hypertension. Curr Opin Nephrol Hypertens. 2012;21:119–121. doi: 10.1097/MNH.0b013e328350a50f. - PubMed

Publication types

MeSH terms