. 2020 Apr 1;87(7):619-631.
doi: 10.1016/j.biopsych.2019.07.024. Epub 2019 Aug 6.

Altered Corticolimbic Control of the Nucleus Accumbens by Long-term Δ9-Tetrahydrocannabinol Exposure

Affiliations

Altered Corticolimbic Control of the Nucleus Accumbens by Long-term Δ9-Tetrahydrocannabinol Exposure

Eun-Kyung Hwang et al. Biol Psychiatry. .

Abstract

Background: The decriminalization and legalization of cannabis and the expansion of availability of medical cannabis in North America have led to an increase in cannabis use and the availability of high-potency strains. Cannabis potency is determined by the concentration of Δ9-tetrahydrocannabinol (Δ9-THC), a psychoactive constituent that activates cannabinoid CB1 and CB2 receptors. The use of high-potency cannabis is associated with cannabis use disorder and increased susceptibility to psychiatric illness. The nucleus accumbens (NAc) is part of a brain reward circuit affected by Δ9-THC through modulation of glutamate afferents arising from corticolimbic brain areas implicated in drug addiction and psychiatric disorders. Moreover, brain imaging studies show alterations in corticolimbic and NAc properties in human cannabis users.

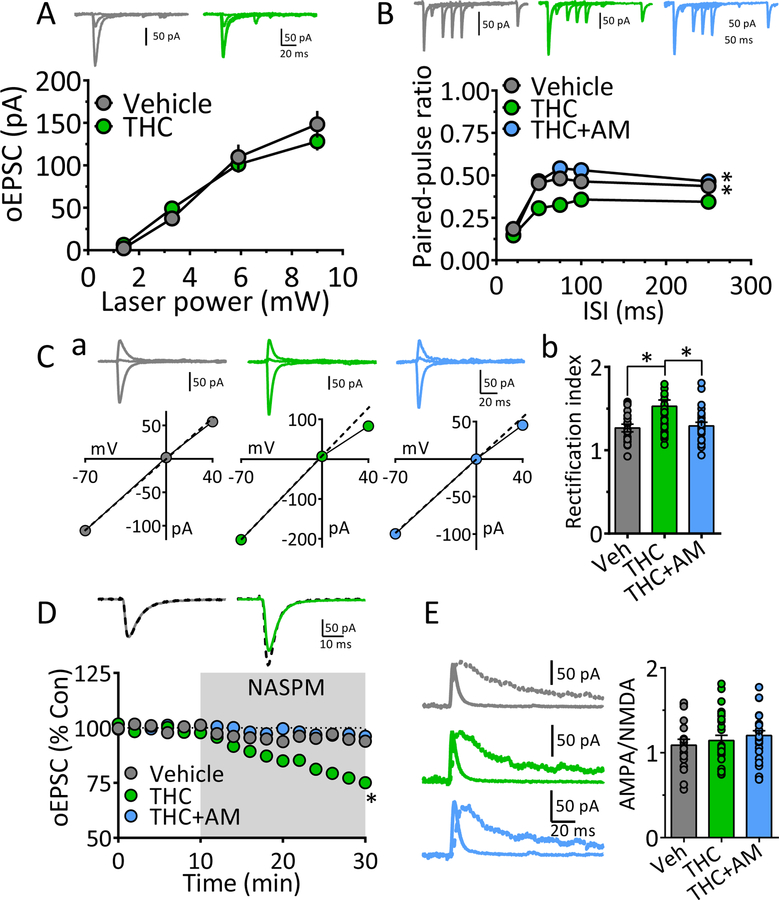
Methods: Using in vitro electrophysiology and optogenetics, we examined how Δ9-THC alters corticolimbic input to the NAc in rats.

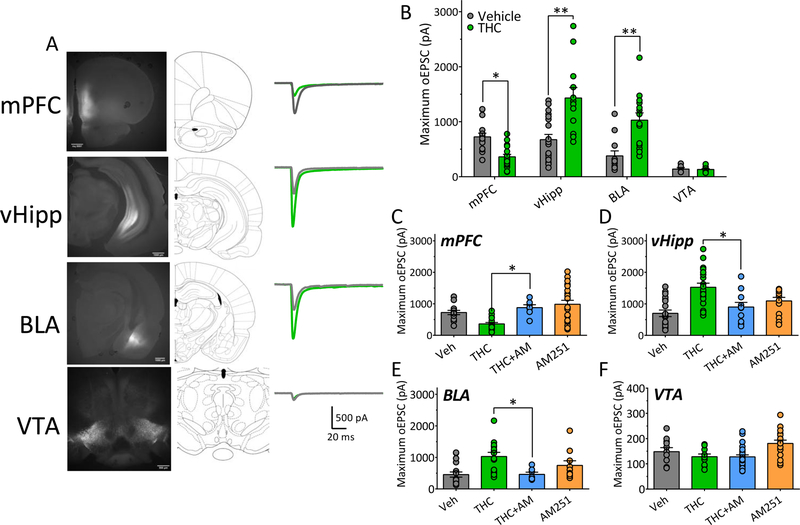
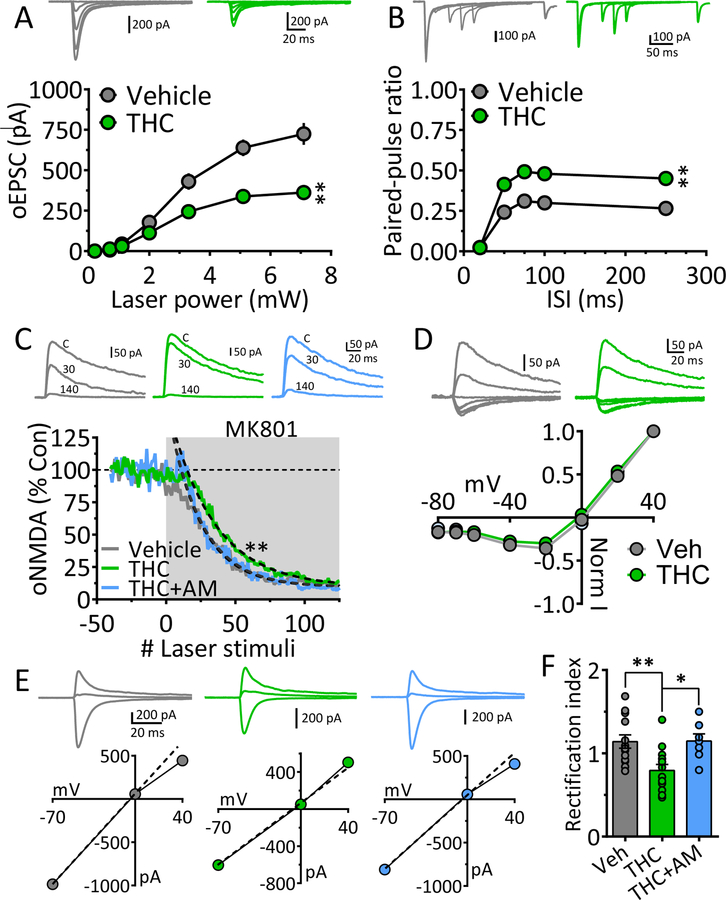
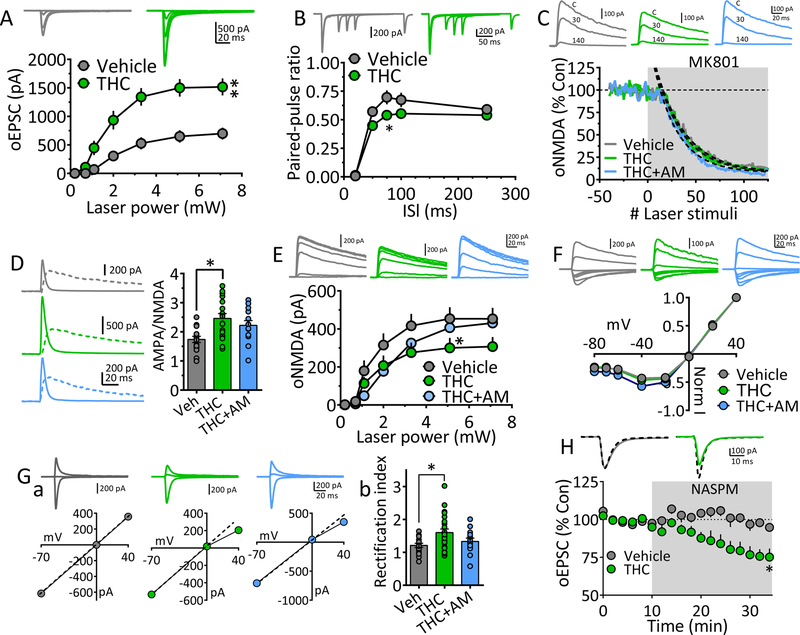
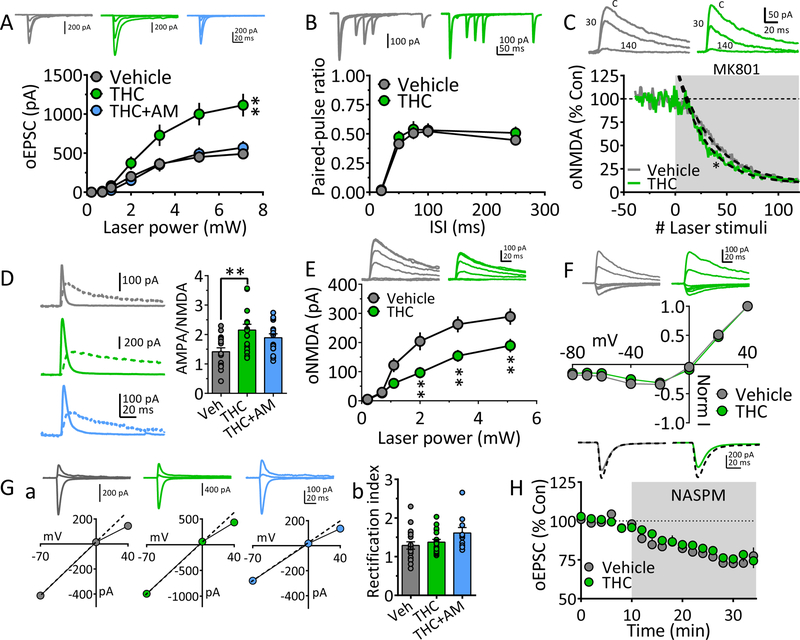
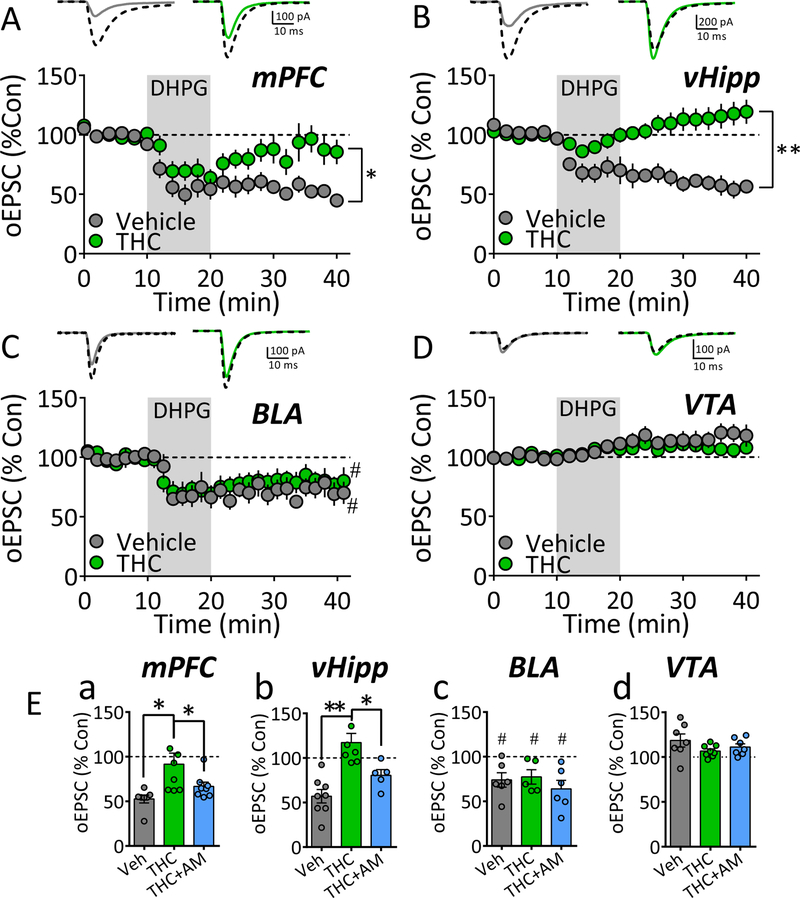
Results: We found that long-term exposure to Δ9-THC weakens prefrontal cortex glutamate input to the NAc shell and strengthens input from basolateral amygdala and ventral hippocampus. Further, whereas long-term exposure to Δ9-THC had no effect on net strength of glutamatergic input to NAc shell arising from midbrain dopamine neurons, it alters fundamental properties of these synapses.

Conclusions: Long-term exposure to Δ9-THC shifts control of the NAc shell from cortical to limbic input, likely contributing to cognitive and psychiatric dysfunction that is associated with cannabis use.

Keywords: Cannabinoid; Cannabis; Glutamate; Long-term depression; Marijuana; Medicinal marijuana; Synapse.


Conflict of interest statement

Disclosures

The authors report no biomedical financial interests or potential conflicts of interest.

Figures

Figure 1.
Figure 1.. Pathway-specific alteration of NAcs excitatory afferent pathways by chronic Δ9-THC
A. Representative fluorescence images and corresponding rat brain diagrams of coronal brain slices showing injection sites of ChR2 viruses in brain regions projecting to the NAcs (mPFC, medial prefrontal cortex; vHipp, ventral hippocampus; BLA, basolateral amygdala; VTA, ventral tegmental area). At right are representative averages of maximum excitatory postsynaptic current traces (oEPSCs) recorded in NAcs neurons and evoked by 473nm light-activation of ChR2, expressed by afferent axon terminals originating in the brain areas at left. Gray waveforms were obtained from rats treated with vehicle, whereas green traces are those obtained from animals chronically treated with Δ9-THC. B. Mean maximum oEPSCs in NAcs neurons that were evoked by light-stimulation of ChR2 expressed in axons originating in each of the brain regions injected with ChR2-AAV. oEPSCs recorded from both chronic vehicle- and Δ9-THC-injected rats are shown (Two-way ANOVA interaction, F3,100 = 16.2, p <0.0001; Bonferroni post-hoc comparisons, * = p < 0.01, ** = p < 0.0001). C. Maximal light-evoked oEPSCs recorded in the NAcs of rats injected with ChR2 virus in the mPFC after chronic vehicle, Δ9-THC, Δ9-THC preceded by injection of the CB1 antagonist AM251, or AM251 alone (One-way ANOVA, F3,59 = 8.4, p < 0.0001; Holm-Sidak post-hoc comparison of THC vs. THC+AM251, * = p = 0.026). D. Maximal vHipp-evoked oEPSCs recorded after chronic vehicle, Δ9-THC, Δ9-THC preceded by injection of the CB1 antagonist AM251, or AM251 alone (One-way ANOVA, F3,60 = 9.8, p < 0.0001; Holm-Sidak post-hoc comparisons of THC vs. THC+AM251, p = 0.006). E. Maximal BLA-evoked oEPSCs recorded after chronic vehicle, Δ9-THC, Δ9-THC preceded by injection of the CB1 antagonist AM251, or AM251 alone (One-way ANOVA, F3,45 = 6.1, p < 0.01; Holm-Sidak post-hoc comparison of THC vs. THC+AM251, * = p = 0.021). F. Maximal VTA-evoked oEPSCs recorded after chronic vehicle, Δ9-THC, Δ9-THC preceded by injection of the CB1 antagonist AM251, or AM251 alone (One-way ANOVA, F3,62 = 1.02, p = 0.37). Data in C-F illustrate that the effect of chronic Δ9-THC was significantly prevented in mPFC, vHipp, and BLA projections to the NAcs when each injection was preceded by an injection of AM251. Numbers of neurons recorded from number of rats (n/R) in each experiment = A. mPFC, Veh: 16/11, THC: 18/7; vHipp, Veh: 19/8, THC: 12/7; BLA, Veh: 12, THC: 14; VTA, Veh: 6, THC: 11. B. mPFC, Veh: 16/11, THC: 18/7; vHipp, Veh: 19/8, THC: 12/7; BLA, Veh: 12, THC: 14; VTA, Veh: 6, THC: 11. C. mPFC, Veh: 16/11, THC: 18/7, THC+AM: 7/5, AM251: 21/6. D. vHipp, Veh: 19/8, THC: 20/7, THC+AM: 11/4, AM251: 14/5. E. BLA, Veh: 18/7, THC: 14/6, THC+AM: 7/4, AM251: 10/5. F. VTA: Veh: 11/6, THC: 10/6, THC+AM: 32/8, AM251: 17/7.
Figure 2.
Figure 2.. Mechanisms underlying weakened mPFC glutamatergic input to NAcs following chronic Δ9-THC.
A. Input-output (I-O) curves showing relationship between laser power, activating ChR2 in mPFC axons projecting to NAcs, and oEPSC amplitudes after chronic vehicle or Δ9-THC injections. Representative mean oEPSCs are shown at 5 laser intensities in neurons from vehicle (gray traces) and Δ9-THC-injected (green traces) rats. The strength of mPFC glutamate input to NAcs neurons was significantly smaller following chronic Δ9-THC (** = F18,342 = 9.2, p < 0.0001, intensity x treatment interaction, two-way repeated measures ANOVA).B. Mean paired-pulse ratios (PPR) of mPFC-evoked oEPSCs at different inter-stimulus (laser pulse) intervals (ISI) in NAc neurons from chronic Δ9-THC- and vehicle injected rats. Mean representative traces from individual cells in both groups are shown above. The PPR was significantly increased by chronic Δ9-THC treatment (** = F12,208 = 3.9, p < 0.0001, ISI x treatment interaction, two-way repeated measures ANOVA). Note that paired oEPSCs overlapped at the 20 ms ISI, thereby yielding a ratio = 0. C. The rate of the progressive, activity-dependent, block of ChR2-evoked NMDA receptor oEPSCs by MK801, is significantly slower following chronic Δ9-THC in the mPFC → NAcs pathway (time-constant of oNMDA current reduction in MK801: chronic vehicle = 23.4 stimuli, 95% confidence interval = 22.2 – 24.5 stimuli, n = 8, gray; chronic Δ9-THC = 32.5 stimuli, 95% confidence interval = 30.9 – 34.2 stimuli, n = 8, green), and this was prevented by co-injection with the cannabinoid antagonist AM251 (chronic Δ9-THC + AM251 = 24.0 stimuli, 95% confidence interval = 22.8 – 25.4 stimuli, n = 4, blue). Exponential decay time constants (τ) were obtained by curve fitting (dashed lines). Representative oNMDA waveforms from each group obtained before MK801 application (control, C), and at 30 and 140 stimuli are shown above. Note the smaller reduction of the oNMDA current at 30 stimuli in the cell from the chronic Δ9-THC treated animal compared to the other groups. Recordings were performed in the presence of DNQX, a kainate/AMPA receptor antagonist, and picrotoxin, a GABAA Cl channel blocker. D. Lack of chronic Δ9-THC effect on the voltage-dependence of oNMDA currents. Representative mean traces obtained from chronic vehicle (gray) and Δ9-THC-treated (green) cells are shown above. E. Chronic Δ9-THC causes a reduction in inward rectification of ChR2-evoked AMPA receptor-mediated synaptic currents at mPFC → NAcs synapses. Shown are representative current-voltage (I-V) relationships and mean waveforms of AMPA oEPSCs evoked by activation of ChR2 in the mPFC → NAcs pathway at 3 different membrane voltages (Vm = −70, 0, and +40) from each group (chronic vehicle, gray, chronic Δ9-THC, green, and chronic Δ9-THC + AM251, blue). A hypothetical slope = 1.0 is indicated by a dashed line. F. Mean rectification index (RI = absolute AMPA current measured at −70 mV divided by that measured at +40 mV) for all cells in each group. The cells from chronic Δ9-THC-treated animals showed a significant reduction in rectification index compared to chronic vehicle-, or chronic Δ9-THC + AM251-treated rats (F3,44 = 5.6, p < 0.001, one-way ANOVA, ** = p < 0.001, * = p < 0.05, Holm-Sidak post-hoc comparison, respectively). Number of neurons/number of rats: A. Veh: 16/11, THC: 18/ 6 B. Veh: 12/11, THC: 15/6. C. Veh: 8/6, THC: 8/5, THC+AM: 4/4. D. Veh: 9/6, THC: 7/5. F. Veh: 13/6, THC: 13/5, THC+AM: 7/4.
Figure 3.
Figure 3.. Mechanisms underlying strengthened vHipp glutamatergic input to NAcs following chronic Δ9-THC.
A. oEPSC I-O curves evoked by ChR2 activation of vHipp axons projecting to NAcs, after chronic vehicle or Δ9-THC injections. Representative mean oEPSCs are shown at 5 laser intensities in neurons from vehicle (gray traces) and Δ9-THC-injected (green traces) rats. The strength of vHipp glutamate input to NAcs neurons was significantly increased following chronic Δ9-THC (** = F18,336 = 5.6, p < 0.0001, intensity x treatment interaction, two-way repeated measures ANOVA). B. Mean PPR of vHipp-evoked oEPSCs at different inter-laser pulse intervals (ISI) in NAc neurons from chronic Δ9-THC- and vehicle injected rats. Mean representative traces from individual cells in both groups are shown above. The PPR was significantly decreased by chronic Δ9-THC treatment only at the 75ms ISI (* = F4,100 = 4.5, p = 0.002, ISI x treatment interaction, two-way repeated measures ANOVA, p = 0.016, Holm-Sidak post-hoc comparison). Note that paired oEPSCs overlapped at the 20 ms ISI, thereby yielding a ratio = 0. C. The rate of block of ChR2-evoked NMDA receptor oEPSCs by MK801, was not significantly altered by chronic Δ9-THC in the vHipp → NAcs pathway (time-constant of oNMDA current block by MK801: chronic vehicle = 30.7 stimuli, 95% confidence interval = 29.4 – 32.2.5 stimuli, n = 8, gray; chronic Δ9-THC = 28.8 stimuli, 95% confidence interval = 27.5 – 30.2 stimuli, n = 8, green; chronic Δ9-THC + AM251 = 25.1 stimuli, 95% confidence interval = 23.9 – 26.3 stimuli, n = 4, blue). Exponential decay time constants (τ) were obtained by best fit (dashed lines). Representative oNMDA waveforms from each group obtained before MK801 application (control, C), and at 30 and 140 stimuli are shown above. D. AMPA/NMDA ratios show potentiated transmission at vHipp → NAcs synapses. Left, representative mean waveforms of laser-evoked oEPSCs collected at −70 mV (solid line) and +40 mV (dashed line) holding potentials from chronic vehicle (gray), chronic Δ9-THC (green), or chronic Δ9-THC + AM251 (blue) groups. AMPA/NMDA = peak AMPA response at −70 mV divided by the peak NMDA response at +40 mV. Right, AMPA/NMDA ratio group means (± s.e.m.). * = p < 0.01, F3,62 = 5.28, 1-way ANOVA and Holm-Sidak post-hoc comparison). E. I-O curves of vHipp ChR2-evoked oNMDA currents in neurons from chronic vehicle, chronic Δ9-THC, and chronic Δ9-THC + AM251 treated rats. Representative mean oNMDA wave forms are shown above for each condition. oNMDA currents were significantly smaller following chronic Δ9-THC at only one laser intensity (F12,204 = 2.062, drug x power interaction, p < 0.05, 2-way repeated measures ANOVA; * = p < 0.05, Holm-Sidak’s post-hoc test). F. Lack of chronic Δ9-THC effect on the voltage-dependence of oNMDA currents. Representative mean traces from cells in chronic vehicle (gray), Δ9-THC-treated (green), and Δ9-THC + AM251 groups are shown above. G. Chronic Δ9-THC increased inward rectification of ChR2-evoked AMPA receptor oEPSCs at vHipp →NAcs synapses. Ga. Representative I-V relationships and mean AMPA oEPSCs evoked by ChR2 in the vHipp → NAcs pathway at holding potentials of −70, 0, and +40 from each of the 3 groups (chronic vehicle, gray, chronic Δ9-THC, green, and chronic Δ9-THC + AM251, blue). A hypothetical slope = 1.0 is indicated by a dashed line. Gb. Mean oEPSC RI in each group. The cells from chronic Δ9-THC-treated animals showed a significantly increased RI compared to chronic vehicle-, or chronic Δ9-THC + AM251-treated rats (F3,66 = 4.54, p < 0.01, 1-way ANOVA, * = p < 0.05, Holm-Sidak post-hoc comparison). H. Mean time course of the polyamine, GluR2-lacking AMPA receptor blocker NASPM on oEPSCs evoked by ChR2-activation of vHipp inputs to NAcs neurons. Mean wave forms shown above indicate peak effect of NASPM (solid line), compared to baseline (dashed line) in representative cells from chronic vehicle (gray) or chronic Δ9-THC-treated (green) animals. NASPM caused a significant inhibition of oEPSCs only from neurons obtained from chronic Δ9-THC-treated rats (F2,20 = 4.8, * = p < 0.05, 1-way ANOVA and Holm-Sidak’s post-hoc test). Number of neurons/Rats: A. Veh: 19/8, THC: 17/7 B. Veh: 10/8, THC: 17/7 C. Veh:7/5, THC: 4/4 D. Veh: 15/7, THC: 22/7, THC+AM: 13/4 E. Veh: 17/5, THC: 11/4, THC+AM: 10/4 Gb. Veh: 17/8, THC: 24/6, THC+AM: 13/4 H. Veh: 6/5, THC: 10/6.
Figure 4.
Figure 4.. Mechanisms underlying strengthened BLA glutamatergic input to NAcs following chronic Δ9-THC.
A. oEPSC I-O curves evoked by ChR2 activation of BLA axons projecting to NAcs, after chronic vehicle, Δ9-THC, or Δ9-THC + AM251 injections. Representative mean oEPSCs are shown at 5 laser intensities in neurons from vehicle (gray traces), Δ9-THC (green traces), or Δ9-THC + AM-251-injected (blue traces) rats. The strength of BLA glutamate input to NAcs neurons was significantly increased following chronic Δ9-THC and this was prevented by AM251 (** = F18,392 = 2.6, p < 0.001, intensity x treatment interaction, 2-way repeated measures ANOVA). B. Mean PPR of BLA-evoked oEPSCs at different inter-laser pulse intervals (ISI) in NAc neurons from chronic Δ9-THC- and vehicle injected rats. Mean representative traces from individual cells in both groups are shown above. The PPR was not significantly altered by chronic Δ9-THC (* = F12,255 = 0.3, p = 0.98, ISI x treatment interaction, 2-way repeated measures ANOVA). Note that paired oEPSCs overlapped at the 20 ms ISI, thereby yielding a ratio = 0. C. The rate of block of ChR2-evoked oNMDA receptor oEPSCs by MK801, was significantly faster following chronic Δ9-THC in the BLA → NAcs pathway (time-constant of oNMDA block by MK801: chronic vehicle = 34.3 stimuli, 95% confidence interval = 32.2–36.8 stimuli, n = 8 neurons, gray line; chronic Δ9-THC = 27.9 stimuli, 95% confidence interval = 26.1–29.9 stimuli, n = 8, green line). Exponential decay time constants (τ) were obtained by best fit (dashed lines). Representative oNMDA waveforms from each group obtained before MK801 application (control, C), and at 30 and 140 stimuli are shown above. D. AMPA/NMDA ratios show potentiated transmission at BLA → NAcs synapses. Left, representative mean waveforms of laser-evoked oEPSCs collected at −70 mV (solid line) and +40 mV (dashed line) holding potentials from chronic vehicle (gray), chronic Δ9-THC (green), or chronic Δ9-THC + AM251 (blue) groups. AMPA/NMDA = peak AMPA response at −70 mV divided by the peak NMDA response at +40 mV. Right, AMPA/NMDA ration group means (± s.e.m.). ** = p < 0.01, F2,47 = 5.8, one-way ANOVA and Holm-Sidak post-hoc comparison). E. I-O curves of ChR2-evoked oNMDA currents at BLA → NAcs synapses in neurons from chronic vehicle, and chronic Δ9-THC treated rats. Representative mean oNMDA wave forms are shown above for each condition. The treatment x laser power interaction was significant (F5,70 = 6.66, p <0.0001, 2-way repeated measures ANOVA; ** = p < 0.01, Holm-Sidak comparison), indicating a decrease in oNMDA current amplitude after chronic Δ9-THC. F. Lack of chronic Δ9-THC effect on the voltage-dependence of oNMDA currents. Representative mean traces from cells in chronic vehicle (gray), and Δ9-THC-treated (green) groups are shown above. G. Δ9-THC does not change inward rectification of ChR2-evoked AMPA receptor oEPSCs at BLA → NAcs synapses. Ga. Representative I-V relationships and mean AMPA oEPSCs evoked by ChR2 in the BLA → NAcs pathway at holding potentials of −70, 0, and +40 from each of the 3 groups (chronic vehicle, gray, chronic Δ9-THC, green, and chronic Δ9-THC + AM251, blue). A hypothetical slope = 1.0 is indicated by a dashed line. Gb. Mean oEPSC RI in each group. The cells from chronic Δ9-THC-treated animals showed no significant change in RI compared to chronic vehicle-treated rats (F2,44 = 2.4, p = 0.10, 1-way ANOVA). H. Mean time course of NASPM, on oEPSCs evoked by ChR2-activation of BLA inputs to NAcs neurons. Mean wave forms shown above indicate peak effect of NASPM (solid line), compared to baseline (dashed line) in representative cells from chronic vehicle (gray) or chronic Δ9-THC-treated (green) animals. The effect of NASPM on BLA → NAcs oEPSCs was not different between chronic vehicle and chronic Δ9-THC groups (F2,20 = 1.6, p = 0.23, 1-way ANOVA and Holm-Sidak’s post-hoc test). Number of cells/Rats: A. Veh: 23/9, THC: 16/8, THC+AM: 11/6. B. Veh: 20/9, THC: 16/8. C. Veh: 8/7, THC: 8/5. D. Veh: 17/8, THC: 17/7, THC+AM: 16/6. E. Veh: 9/7, THC: 7/5 F. Veh: 5/5, THC: 7/5 Gb. Veh: 19/8, THC: 18/7, THC+AM: 10/6 H. Veh: 9/6, THC: 10/7.
Figure 5.
Figure 5.. Homeostatic changes in VTA dopaminergic neuron glutamate input to NAcs following chronic Δ9-THC.
A. Glutamate oEPSC I-O curves evoked by ChR2 activation of axons from THCre-positive VTA neurons projecting to NAcs, after chronic vehicle, or Δ9-THC injections. Representative mean oEPSCs are shown at 5 laser intensities in neurons from vehicle (gray traces), or Δ9-THC (green traces) injected THCre rats. The strength of glutamate input to NAcs neurons from the VTA was not significantly altered by chronic Δ9-THC (F3,57 = .9, p = 0.11, intensity x treatment interaction, 2-way repeated measures ANOVA). B. Mean PPR of VTA THCre neuron-evoked oEPSCs at different ISIs in NAc neurons from chronic vehicle, Δ9-THC, and Δ9-THC+AM251-injected rats. Mean representative traces from individual cells in both groups are shown above. The PPR was significantly reduced by chronic Δ9-THC (** = F12,328 = 5.3, p < 0.001, ISI x treatment interaction, 2-way repeated measures ANOVA with Holm-Sidak post-hoc test), and this was prevented by concomitant treatment with AM251 (p = 0.45, compared to vehicle). C. Δ9-THC increases inward rectification of ChR2-evoked AMPA receptor oEPSCs at VTA → NAcs synapses. Ca. Representative I-V relationships and mean AMPA oEPSCs evoked by ChR2 in the VTA → NAcs pathway at holding potentials of −70, 0, and +40 from each of the 3 groups (chronic vehicle, gray, Δ9-THC, green, and Δ9-THC + AM251, blue). A hypothetical slope = 1.0 is indicated by a dashed line. Cb. Mean oEPSC RI in each group. The cells from chronic Δ9-THC-treated animals showed a significant increase in RI compared to chronic vehicle-treated rats (F3,83 = 3.9, p < 0.01, 1-way ANOVA; * = p < 0.05, Holm-Sidak post-hoc test), and this was prevented by AM251 pre-treatment (p = 0.78, compared to vehicle). D. Mean time course of the polyamine, GluR2-lacking AMPA receptor blocker, NASPM, on oEPSCs evoked by ChR2-activation of VTA glutamate inputs to NAcs neurons. Mean wave forms shown above indicate peak effect of NASPM (solid line), compared to baseline (dashed line) in representative cells from chronic vehicle (gray) or chronic Δ9-THC-treated (green) animals. NASPM significantly reduced VTA→NAcs oEPSCs, compared to chronic vehicle, and this was prevented by AM251 (F2,57 = 1.4, p < 0.0001, 1-way ANOVA; * = p < 0.001, Holm-Sidak post-hoc test). E. AMPA/NMDA ratios at VTA→NAcs synapses were unaltered by Δ9-THC (F2,66 = 0.74, p = 0.49; 1-way ANOVA). Left, representative mean waveforms of laser-evoked oEPSCs collected at −70 mV (solid line) and +40 mV (dashed line) holding potentials from chronic vehicle (gray), chronic Δ9-THC (green), or chronic Δ9-THC + AM251 (blue) groups. AMPA/NMDA = peak AMPA response at −70 mV divided by the peak NMDA response at +40 mV. Right, AMPA/NMDA ratio group means (± s.e.m.). Number of cells/Rats: A. Veh: 11/6, THC: 10/6. B. Veh: 25/10, THC: 15/12, THC+AM: 30/8. Cb. Veh: 18/10, THC: 31/12, THC+AM: 24/8. D. Veh: 13/10, THC: 30/12, THC+AM: 8/7. E. Veh: 18/10, THC: 27/12, THC+AM: 24/8.
Figure 6.
Figure 6.. Chronic Δ9-THC differentially alters mGluRI-induced synaptic plasticity distinct NAcs glutamate afferents.
A-D. Effects of a 10 min application of the mGluRI agonist, DHPG, on oEPSCs evoked via ChR2-activation of glutamate afferents to the NAcs. Shown for each brain region is a mean time-course of the oEPSCs, normalized to 100 % of control, for the chronic Δ9-THC and vehicle groups (below) and representative averaged waveforms from individual cells from each group (above). In each instance, control mean oEPSCs collected before DHPG application are indicated by black dashed lines, whereas oEPSCs averaged from individual sweeps, collected from minute 35 to minute 42, are indicated by solid lines in neurons from vehicle- (gray) or Δ9-THC-treated (green) animals. A. Effects of DHPG on mPFC afferents to NAcs (* = p < 0.001, repeated measures ANOVA, F20,260 = 2.7, time vs. treatment interaction). B. Effects of DHPG on oEPSCs evoked by ChR2-activation of vHipp glutamate afferents to the NAcs (** = p < 0.0001, repeated measures ANOVA, F20,260 = 13.2, time vs. treatment interaction). C. Effects of DHPG on oEPSCs evoked by ChR2-activation of BLA glutamate afferents to the NAcs shows that DHPG-LTD was significant compared to baseline in all groups (one-way ANOVA, F3,20 = 5.1, p = 0.009; # = p < 0.05, Newman-Keuls post-hoc test), but there was no difference in LTD among groups. D. Effects of DHPG on oEPSCs evoked by ChR2-activation of VTA THCre neuron glutamate afferents to the NAcs (time vs. treatment interaction not significant, repeated measures ANOVA, F20,260 = 1.4,). E. Summary of DHPG effect on normalized oEPSCs, evoked by ChR2-activation of afferents arising from mPFC (a), vHipp (b), BLA (c), and the VTA (d) for the chronic vehicle (Veh), chronic Δ9-THC, and chronic Δ9-THC + AM251 (THC+AM) groups. * = p < 0.05, ** = p < 0.0001, 1-way ANOVA with Holm-Sidak post-hoc comparison. # = p < 0.05, 1-way ANOVA with Newman-Keuls post-hoc. Number of neurons/Rat per group: A. Veh: 7/6, THC: 8/5. B. Veh: 8/5, THC: 7/5. C. Veh: 5/5, THC: 6/5. D. Veh: 7/6, THC: 9/6. Ea. Veh: 7/6, THC: 8/5, THC+AM: 8/5. Eb. Veh: 8/5, THC: 7/5, THC+AM: 5/4. Ec. Veh: 6/5, THC: 5/5, THC+AM: 6/5. Ed. Veh: 7/6, THC: 8/6, THC+AM: 7/5.

Comment in

References

    1. Thomas MJ, Kalivas PW, Shaham Y (2008): Neuroplasticity in the mesolimbic dopamine system and cocaine addiction. British Journal of Pharmacology. 154:327–342. - PMC - PubMed
    1. Volkow Nora D, Morales M (2015): The Brain on Drugs: From Reward to Addiction. Cell. 162:712–725. - PubMed
    1. Mogenson GJ, Jones DL, Yim CY (1980): From motivation to action: functional interface between the limbic system and the motor system. Prog Neurobiol. 14:69–97. - PubMed
    1. Pierce RC, Wolf ME (2013): Psychostimulant-Induced Neuroadaptations in Nucleus Accumbens AMPA Receptor Transmission. Cold Spring Harbor Perspectives in Medicine. 3. - PMC - PubMed
    1. Floresco SB (2015): The nucleus accumbens: an interface between cognition, emotion, and action. Annu Rev Psychol. 66:25–52. - PubMed

Publication types