. 2019 Oct 14;36(4):431-443.e5.
doi: 10.1016/j.ccell.2019.08.004. Epub 2019 Sep 19.

Combining the Allosteric Inhibitor Asciminib with Ponatinib Suppresses Emergence of and Restores Efficacy against Highly Resistant BCR-ABL1 Mutants

Affiliations

Combining the Allosteric Inhibitor Asciminib with Ponatinib Suppresses Emergence of and Restores Efficacy against Highly Resistant BCR-ABL1 Mutants

Christopher A Eide et al. Cancer Cell. .

Abstract

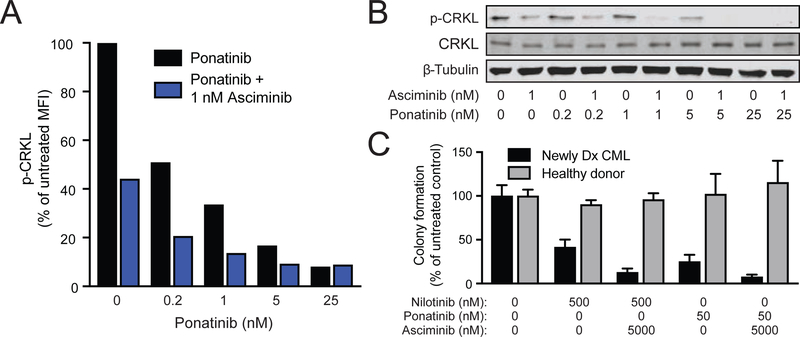
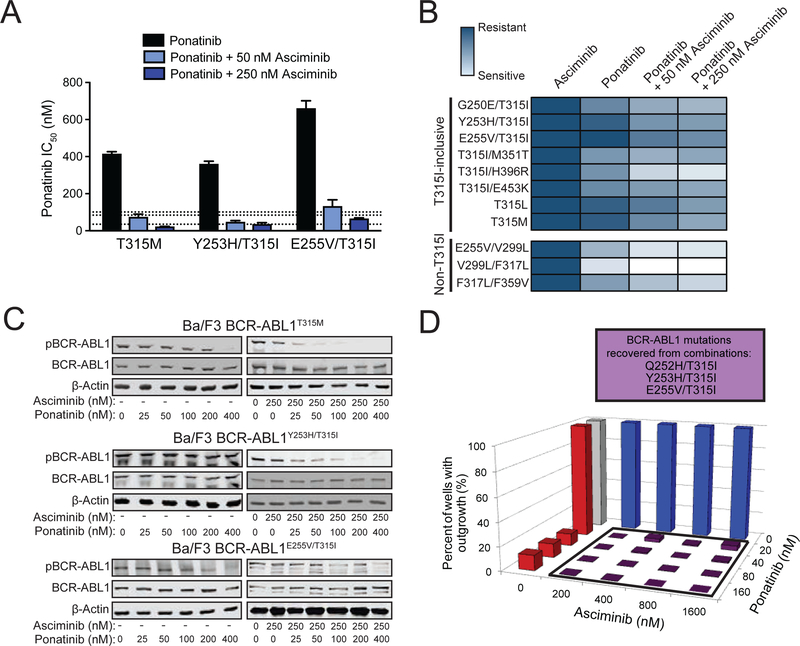
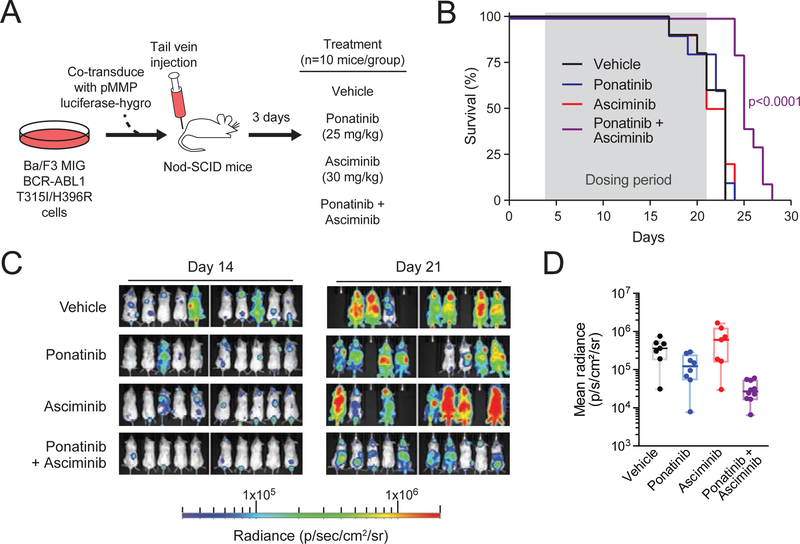
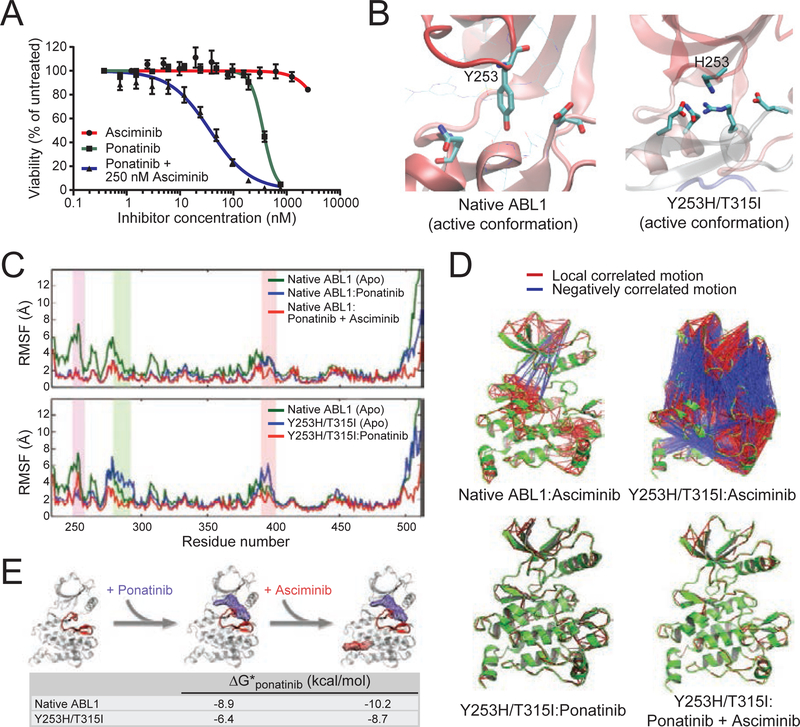
BCR-ABL1 point mutation-mediated resistance to tyrosine kinase inhibitor (TKI) therapy in Philadelphia chromosome-positive (Ph+) leukemia is effectively managed with several approved drugs, including ponatinib for BCR-ABL1T315I-mutant disease. However, therapy options are limited for patients with leukemic clones bearing multiple BCR-ABL1 mutations. Asciminib, an allosteric inhibitor targeting the myristoyl-binding pocket of BCR-ABL1, is active against most single mutants but ineffective against all tested compound mutants. We demonstrate that combining asciminib with ATP site TKIs enhances target inhibition and suppression of resistant outgrowth in Ph+ clinical isolates and cell lines. Inclusion of asciminib restores ponatinib's effectiveness against currently untreatable compound mutants at clinically achievable concentrations. Our findings support combining asciminib with ponatinib as a treatment strategy for this molecularly defined group of patients.

Keywords: ABL001; allosteric inhibitors; asciminib; chronic myeloid leukemia; compound mutation; ponatinib; targeted therapy.


Conflict of interest statement

Disclosure of Potential Conflicts of Interest

M.W.D. served on advisory boards and as a consultant for Bristol-Myers Squibb, ARIAD, and Novartis and receives research funding from Bristol-Myers Squibb, Celgene, Novartis and Gilead. B.J.D. potential competing interests -- SAB: Aileron Therapeutics, ALLCRON, Cepheid, Gilead Sciences, Vivid Biosciences, Celgene & Baxalta (inactive); SAB & Stock: Aptose Biosciences, Blueprint Medicines, Beta Cat, GRAIL, Third Coast Therapeutics, CTI BioPharma (inactive); Scientific Founder & Stock: MolecularMD; Board of Directors & Stock: Amgen; Board of Directors: Burroughs Wellcome Fund, CureOne; Joint Steering Committee: Beat AML LLS; Clinical Trial Funding: Novartis, Bristol-Myers Squibb, Pfizer; Royalties from Patent 6958335 (Novartis exclusive license) and OHSU and Dana-Farber Cancer Institute (one Merck exclusive license).

Figures

Figure 1.
Figure 1.. The allosteric BCR-ABL1 inhibitor asciminib demonstrates selective activity against CML cell signaling, growth, and proliferation.
(A) Structural diagram of the ABL1 kinase domain highlighting the ATP-binding site (green) and myristoyl-binding pocket (blue). Nilotinib (purple) and asciminib (yellow) are shown bound to each site, respectively (PDB ID: 5MO4). (B and C) FACS (B) and immunoblot (C) analyses of CRKL phosphorylation in primary CML cells from a newly diagnosed patient treated with asciminib. (D) Myeloid colony formation assays using primary CML and healthy donor cells treated with asciminib. Colony numbers were normalized to untreated controls and are reported as the mean percent of untreated colonies ± SEM. (E) Dose-response curves for asciminib in human CML cell lines (K562 and LAMA84) and non-CML human leukemia cell lines (HL-60 and U937). Data points represent the mean percent of untreated ± SEM. See also Figure S1.
Figure 2.
Figure 2.. Asciminib demonstrates differential sensitivity among clinically-relevant BCR-ABL1 single mutants associated with resistance to approved ATP-site TKIs.
(A) Cell proliferation curves for Ba/F3 MIG BCR-ABL1 cells and Ba/F3 parental cells treated with asciminib. Data points represent the mean percent of untreated ± SEM. (B) Immunoblot analysis of phosphorylation of BCR-ABL1 (Y393) and STAT5 (Y694) following treatment of Ba/F3 BCR-ABL1 cells with asciminib or imatinib. (C) Heat map summary of IC50 values for BCR-ABL1 TKIs against a panel of Ba/F3 cell lines expressing MIG BCR-ABL1 single mutants. Data for imatinib, nilotinib, dasatinib, and ponatinib are from (Zabriskie et al., 2014) and are included for comparison purposes. (D) Immunoblot analysis of BCR-ABL1 tyrosine autophosphorylation (Y393) for select Ba/F3 pSRα BCR-ABL1 single mutants following treatment with asciminib or imatinib. See also Figure S2 and Table S1.
Figure 3.
Figure 3.. Combining asciminib with ATP-site TKIs suppresses emergence of BCR-ABL1 single mutant-based resistance, including asciminib-resistant myristoyl-binding site mutants.
(A) Ba/F3 pSRα BCR-ABL1 cells were treated with N-ethyl-N-nitrosourea (ENU) overnight, plated in fresh complete medium in the presence of graded concentrations of asciminib, and monitored for outgrowth for 28 days. BCR-ABL1 mutations identified from resistant clones are summarized in the box above the graph. (B and C) Results for assays similar to (A) carried out using the combination of asciminib with nilotinib (B) or ponatinib (C). BCR-ABL1 mutations identified from recovered combination treatment-resistant clones are shown above each graph. (D) Structural illustration of the myristoyl-binding pocket, highlighting the residues of asciminib-resistant mutations (orange spheres) relative to bound asciminib (blue). (E) Cell proliferation assays using TKIs against Ba/F3 cells expressing asciminib-resistant BCR-ABL1 myristoyl-binding site mutants. Bars represent mean fold-change in IC50 ± SEM. (F) Immunoblot analysis of BCR-ABL1 autophosphorylation in Ba/F3 cells expressing BCR-ABL1 myristoyl-binding site mutants treated as indicated. See also Figure S3 and Tables S1–S4.
Figure 4.
Figure 4.. Mutations of position 359 of the BCR-ABL1 kinase domain confer resistance to asciminib and are expanded in asciminib-treated CML patients
(A-C) Graphical summaries of the BCR-ABL1 transcript level (on the International Scale) and variant allele frequency (VAF) of detected BCR-ABL1 variants of chronic phase CML patients 1 (A), 2 (B), and 3 (C) are displayed aligned to their clinical timeline and treatment dosing on asciminib. (D) Immunoblot analysis of BCR-ABL1 autophosphorylation in Ba/F3 cells expressing MIG BCR-ABL1F3591 or BCR-ABL1F359V treated with asciminib or imatinib. (E) Illustration of spatial position of residue F359 (orange sphere) relative to the binding of asciminib (blue) within the myristoyl pocket. See also Table S5 and Figures S4 and S5.
Figure 5.
Figure 5.. Asciminib potentiates the efficacy of ATP-site TKIs to inhibit BCR-ABL1 signaling and clonogenicity in primary CML cells.
(A and B) FACS (A) and immunoblot (B) analyses of CRKL phosphorylation in primary newly diagnosed CML cells treated with ponatinib alone or in combination with asciminib. (C) Myeloid colony formation assay of primary CML and healthy donor cells treated with either nilotinib or ponatinib alone or in combination with asciminib. Colony numbers were normalized to those of untreated controls, and bars represent the mean ± SEM.
Figure 6.
Figure 6.. Combining asciminib with ponatinib at clinically relevant concentrations restores efficacy against highly-resistant BCR-ABL1 compound mutations.
(A) Cellular proliferation IC50 values (mean ± SEM) of Ba/F3 cells expressing MIG BCR-ABL1 compound mutants treated with ponatinib alone or in combination with 50 nM or 250 nM asciminib. Dashed lines represent the clinically achievable steady-state plasma concentration for ponatinib (35, 84, and 101 nM for 15, 30, and 45 mg/day, respectively) (Cortes et al., 2012; Gozgit et al., 2013). (B) Heat map summary of TKI sensitivities in cellular proliferation assays for Ba/F3 cells expressing MIG BCR-ABL1 compound mutants. A color gradient from white (sensitive) to dark blue (insensitive) denotes the sensitivity to asciminib alone, ponatinib alone, or ponatinib in combination with either 50 or 250 nM asciminib. (C) Immunoblot analysis of BCR-ABL1 autophosphorylation in Ba/F3 cells expressing MIG BCR-ABL1T315M, BCR-ABL1Y253H/T315I, or BCR-ABL1E255V/T315I following treatment with ponatinib alone or in combination with 250 nM asciminib. (D) Ba/F3 pSRα BCR-ABL1T315I cells were treated with ENU overnight, plated in fresh complete medium in the presence of graded concentrations of asciminib alone, ponatinib alone, or the indicated matrix of combinations and monitored for outgrowth for 28 days. BCR-ABL1 compound mutations identified from resistant clones are summarized in the box above the graph. See also Tables S6–S8 and Figure S6.
Figure 7.
Figure 7.. Combined treatment with asciminib and ponatinib in vivo prolongs survival and inhibits T315I-inclusive compound mutant tumor growth in a xenograft mouse model.
(A) Design for in vivo mouse model to evaluate the combination of asciminib and ponatinib against the BCR-ABL1T315I/H396R mutant. (B) Survival curves for single-agent and combination treatments. Dosing period (from day 4 through 21) is highlighted in gray. Curves were compared by log-rank Mantel-Cox test. (C) IVIS imaging of luminescence signal in mice on treatment. Luminescence imaging was performed at days 14 and 21 for all mice in each treatment arm (n=10 per group at baseline). (D) Quantification of luminescence signal as a measure of tumor burden in (C) at end of treatment (day 21). Individual dots represent each animal, with the middle horizontal lines indicating the median of each group. Box-and-whiskers representation of the interquartile range and maximum/minimum of each group is included for reference. See also Figure S7.
Figure 8.
Figure 8.. Ponatinib-induced shift of BCR-ABL1Y253H/T315I to inactive conformation is required to enable asciminib binding
(A) Cell proliferation curves for Ba/F3 MIG BCR-ABL1Y253H/T315I cells treated with asciminib, ponatinib, or the combination of both TKIs. Data points represent the mean ± SEM. (B) Molecular dynamics-based modeling of the kinase domain of native ABL1 and the ABL1Y253H/T315I: mutant in the DFG-in, catalytically active conformation. The relevant sidechains at position 253 are highlighted, as H253 in the context of the mutant engages a stabilizing network of interactions including formation of a salt-bridge/hydrogen-bond. (C) Root mean square fluctuation (RMSF) profiles for the native and Y253H/T315I-mutant ABL1 kinase domains alone (apo) and in complex with ponatinib or with ponatinib and asciminib. Increased RMSF values for a given residue-numbered region indicate higher levels of flexibility during simulation. The P-loop, C-helix, and A-loop are highlighted in purple, green, and pink, respectively. (D) Cross-correlation analysis of forces within ABL1 kinase domain residues before and after TKI binding. Ribbon diagrams for each of the indicated kinase:TKI complexes (all featuring the inactive conformation) are shown in green, with local, positively correlated motion and negatively correlated motion denoted by red and blue lines, respectively, between residues. (E) Proposed model of cooperative binding of ponatinib and asciminib against the ABL1Y253H/T315I mutant. Gibbs free energy (ΔG) values for modeled ponatinib binding before and after asciminib co-binding are provided for the inactive conformation of both native ABL1 and the ABL1Y253H/T315I mutant. Increasingly negative values reflect more favorable and stable ponatinib binding; the A-loop of the ribbon structure is highlighted in red.

References

    1. Bradeen HA, Eide CA, O’Hare T, Johnson KJ, Willis SG, Lee FY, Druker BJ, and Deininger MW (2006). Comparison of imatinib, dasatinib (BMS-354825), and nilotinib (AMN107) in an n-ethyl-n-nitrosourea (ENU)-based mutagenesis screen: high efficacy of drug combinations. Blood 108, 2332–2338. - PMC - PubMed
    1. Breccia M, Pregno P, Spallarossa P, Arboscello E, Ciceri F, Giorgi M, Grossi A, Mallardo M, Nodari S, Ottolini S, et al. (2017). Identification, prevention and management of cardiovascular risk in chronic myeloid leukaemia patients candidate to ponatinib: an expert opinion. Annals of hematology 96, 549–558. - PubMed
    1. Corbin AS, Agarwal A, Loriaux M, Cortes J, Deininger MW, and Druker BJ (2011). Human chronic myeloid leukemia stem cells are insensitive to imatinib despite inhibition of BCR-ABL activity. The Journal of clinical investigation 121, 396–409. - PMC - PubMed
    1. Corbin AS, O’Hare T, Gu Z, Kraft IL, Eiring AM, Khorashad JS, Pomicter AD, Zhang TY, Eide CA, Manley PW, et al. (2013). KIT signaling governs differential sensitivity of mature and primitive CML progenitors to tyrosine kinase inhibitors. Cancer research 73, 5775–5786. - PMC - PubMed
    1. Cortes JE, Kantarjian H, Shah NP, Bixby D, Mauro MJ, Flinn I, O’Hare T, Hu S, Narasimhan NI, Rivera VM, et al. (2012). Ponatinib in refractory Philadelphia chromosome-positive leukemias. The New England journal of medicine 367, 2075–2088. - PMC - PubMed

Publication types

MeSH terms