. 2019 Sep 23;10(10):703.
doi: 10.1038/s41419-019-1885-6.

Protein kinase C inhibitors override ZEB1-induced chemoresistance in HCC

Affiliations

Protein kinase C inhibitors override ZEB1-induced chemoresistance in HCC

Rahul Sreekumar et al. Cell Death Dis. .

Abstract

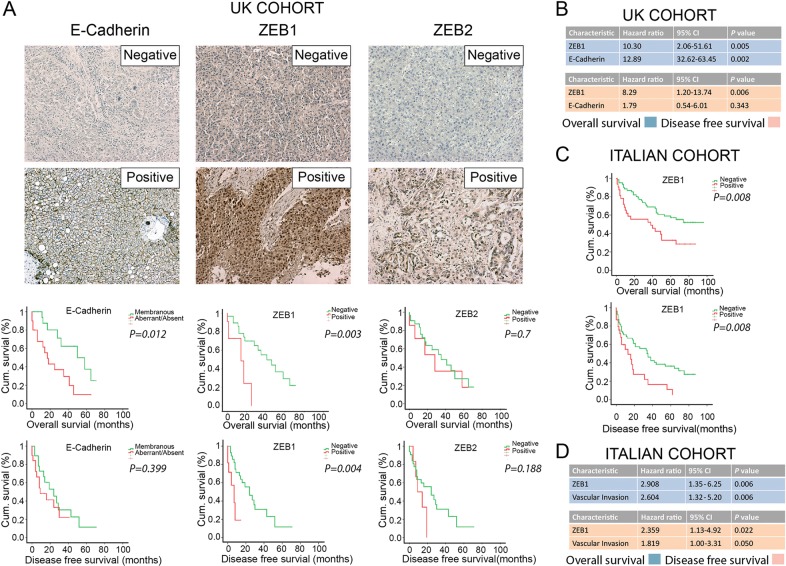
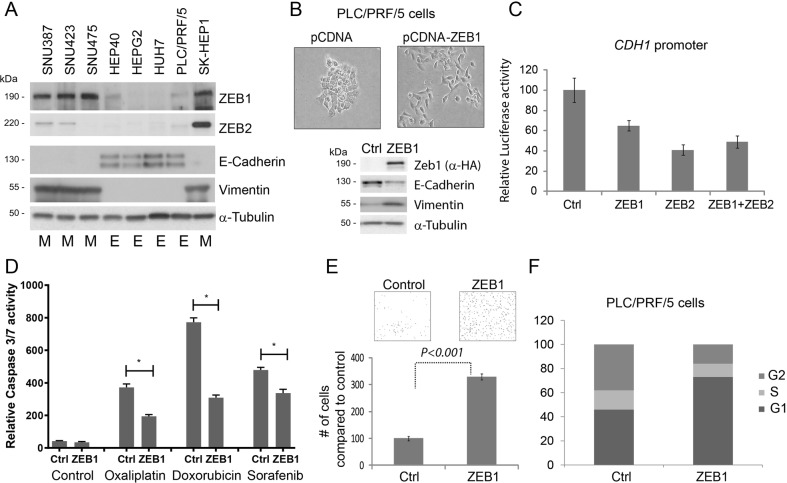
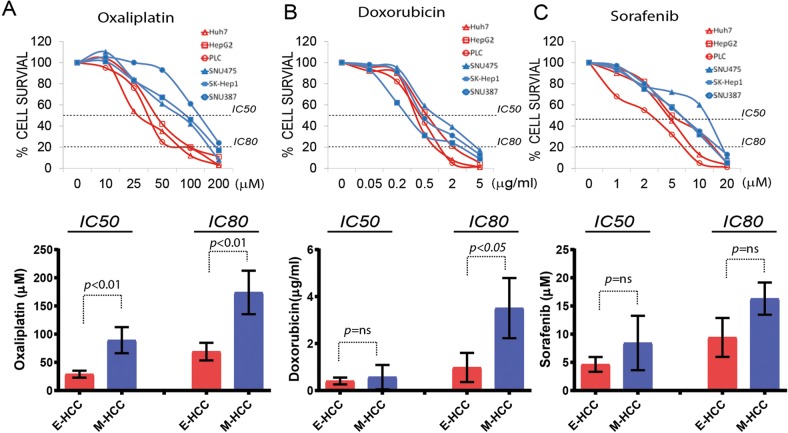
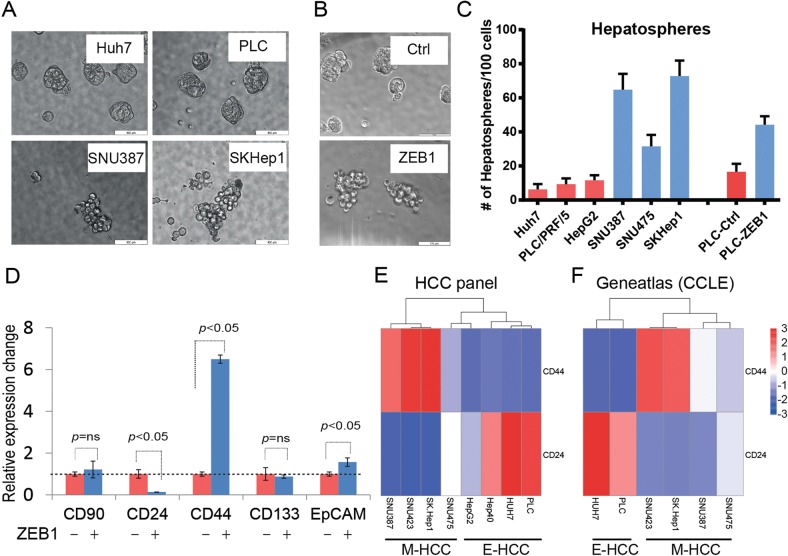
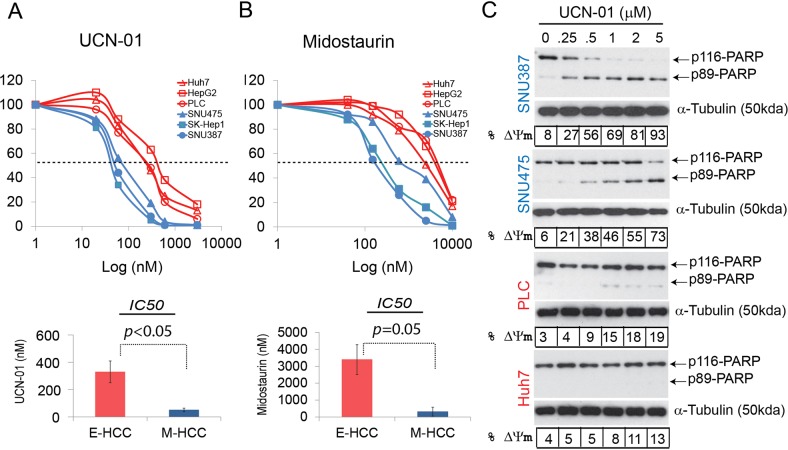
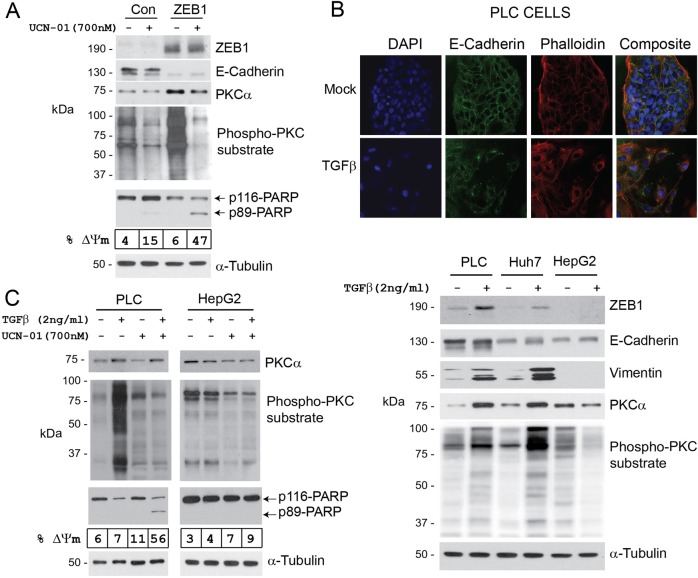
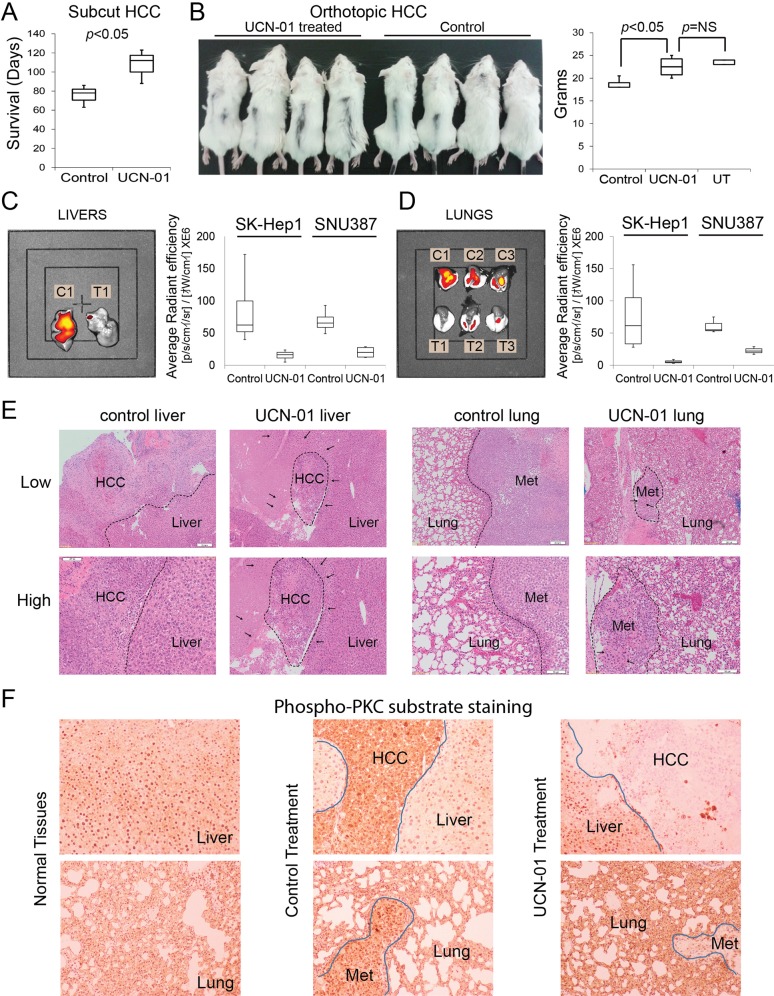
Epithelial-mesenchymal transition (EMT) is a process by which tumour cells lose epithelial characteristics, become mesenchymal and highly motile. EMT pathways also induce stem cell features and resistance to apoptosis. Identifying and targeting this pool of tumour cells is a major challenge. Protein kinase C (PKC) inhibition has been shown to eliminate breast cancer stem cells but has never been assessed in hepatocellular cancer (HCC). We investigated ZEB family of EMT inducer expression as a biomarker for metastatic HCC and evaluated the efficacy of PKC inhibitors for HCC treatment. We showed that ZEB1 positivity predicted patient survival in multiple cohorts and also validated as an independent biomarker of HCC metastasis. ZEB1-expressing HCC cell lines became resistant to conventional chemotherapeutic agents and were enriched in CD44high/CD24low cell population. ZEB1- or TGFβ-induced EMT increased PKCα abundance. Probing public databases ascertained a positive association of ZEB1 and PKCα expression in human HCC tumours. Inhibition of PKCα activity by small molecule inhibitors or by PKCA knockdown reduced viability of mesenchymal HCC cells in vitro and in vivo. Our results suggest that ZEB1 expression predicts survival and metastatic potential of HCC. Chemoresistant/mesenchymal HCC cells become addicted to PKC pathway and display sensitivity to PKC inhibitors such as UCN-01. Stratifying patients according to ZEB1 and combining UCN-01 with conventional chemotherapy may be an advantageous chemotherapeutic strategy.


Conflict of interest statement

The authors declare that they have no conflict of interest.

Figures

Fig. 1
Fig. 1. Immunoexpression of ZEB family proteins in primary HCC is associated with outcome in independent patient cohorts from the UK and Italy.
a E-Cadherin (left panels), ZEB1 (middle panels) and ZEB2 (right panels) expression in UK-HCC cohort (n = 40) as detected by IHC. Considering the functions of the proteins, membranous E-Cadherin expression is marked as positive whereas cytoplasmic (aberrant) and no-expression of E-Cadherin is marked as negative. More than 10% nuclear ZEB1 or ZEB2 expression is marked as positive, <10% or predominant cytoplasmic expression is marked as negative. Absence of E-Cadherin or presence of ZEB1 is associated with overall survival whereas ZEB1 positivity is associated with disease-free survival (time to metastasis/recurrence). b, d Independent prognostic markers, as assessed by Cox regression analysis, showing statistical significance in the UK (b) and Italian (d) cohorts. Blue charts indicate overall survival; pink charts indicate disease-free survival. CI: confidence interval. c ZEB1 expression is significantly associated with both overall and disease-free survival in Italian-HCC cohort (n = 96)
Fig. 2
Fig. 2. Transcription factors of ZEB family are expressed in HCC-derived cell lines and contribute to epithelial plasticity.
a Expression of ZEB1, ZEB2, E-Cadherin and vimentin proteins was assessed by western blotting in eight Hepatoma-derived cell lines. Cell lines identified as epithelial are marked with “E”, mesenchymal with “M”. b Transient expression of ZEB1 induced cell scattering and affected canonical markers of EMT in PLC/PRF/5 cells such as increased vimentin and decreased E-Cadherin protein expression. c Both ZEB1 and ZEB2 suppressed CDH1 promoter in transient reporter assay. d ZEB1-induced EMT facilitates resistance to apoptosis to commonly used chemotherapeutic agents used in HCC treatment. Cells were treated with 100 μM Oxaliplatin (Ox), 2 μg/ml Doxorubicin (Dox) and 10 μM Sorafenib (Sor) for 24 h. Arbitrary units of luciferase activity defining apoptosis (caspase 3/7 activity) has been presented. In all cases, ZEB1-expressing cells became resistant to cell death. (*) is p < 0.05 as assessed by Student’s t-test. e ZEB1-induced EMT facilitates cell motility as assessed by transwell-migration assay. PLC/PRF/5 cells expressing ZEB1 are significantly (approximately three times) more motile compared with control. f Assessment of cell cycle profile 3 days after ZEB1 overexpression revealed an enrichment of G1 cells indicating cell cycle arrest
Fig. 3
Fig. 3. Chemoresistance profiles of Hepatoma cells associate with mesenchymal properties.
The set of three epithelial (Huh7, PLC/PRF/5, HepG2) and three mesenchymal (SKHep1, SNU387, SNU475) Hepatoma-derived cell lines were treated with Oxaliplatin, Doxorubicin or Sorafenib for 8 h, and viability was assessed by 96 h after recovery. Mean IC value for each set was presented in the graph below. P values more than 0.05 are considered not significant using IC50 and IC80 values presented in Supplementary Fig. 1A and calculated by unpaired Student t-test. a E- and M-HCC cells showed stratification upon Oxaliplatin treatment at the IC50 and IC80 values. b Doxorubicin IC80, but not IC50, value marks significance difference between two groups. c EMT status did not correlate with Sorafenib toxicity at IC50 or IC80
Fig. 4
Fig. 4. M-HCC phenotype is associated with enhanced hepatosphere formation and CD44high/CD24low profile.
a In conditions of non-adherent growth, E-HCC cells produced spherical and smooth hepatospheres (top panels). M-HCC cells (bottom panels) produced loosely attached cell clusters in the shape of a grape bunch. b ZEB1-induced EMT mimics the phenotype observed in M-HCC cells. c E-HCC and M-HCC cells show stark differences in terms of number of hepatospheres formed. M-HCC cells or EMT phenotype induced by ZEB1 increases the number of hepatospheres formed indicating they contain more stem cell-like cells. d A panel of currently used stem cell markers were assessed by qPCR in HCC upon ZEB1 overexpression. The changes in CD44, EpCAM and CD24 were significant. Among the changing ones CD44 (increase) CD24 (decrease) were most prominent. The analysis of CD44 and CD24 in E- and M-HCC cells by qPCR (e) or RNA-seq by probing geneatlas database (f). The expression data in the form of ΔΔcT (e) or “reads” (f) were presented after non-hierarchical cluster analysis. E- and M-HCC cells clustered as a result of CD24 and CD44 expression
Fig. 5
Fig. 5. Hepatoma cells respond to PKC inhibitors according to their EMT status.
Viability assays defining IC50 concentrations of UCN-01 (a) and Midostaurin (b) show that E- and M-HCC cells are stratified in their responses. The mean IC50 of E-and M-HCC cells were significantly different for all PKC inhibitors. Student’s t-test was used to identify the significance of tested groups. c The activity of UCN-01 was assessed in mesenchymal (SNU387 and SNU475) and epithelial (PLC/PRF/5 and Huh7) cells. All cell lines were treated with increasing concentrations of UCN-01 (0.25–5μM) for 8 h. The cells were collected and sample divided into 2 for western blotting (PARP cleavage) and mitochondria depolarization (% ΔΨm) to confirm hallmarks of apoptosis. UCN-01 induced substantial apoptosis only in mesenchymal HCC cells
Fig. 6
Fig. 6. PKC pathway is activated in M-HCC cells and necessary for M-HCC survival.
a The expression of different PKC family proteins and PKC activity was investigated in a panel of HCC cell lines. PKC pathway activation in M-HCC cell lines was evident as pan phospho-PKC-substrate antibody gave strong reactivity along with a specific PKCα substrate such as PEA-15. Among different PKCs, only the expression of PKCα correlated with mesenchymal status (M-HCC cells). Other PKC family proteins were either uniformly expressed or not correlated with EMT status of HCC cell lines. b A dose-escalation study using two M-HCC cell lines revealed UCN-01 as more effective in inhibiting PKC activity as compared with Midostaurin. In both cell lines 20 nM UCN-01 inhibited PKC phosphorylation better than 2 μM of Midostaurin. c Transient knockdown of PKCα effectively inhibited the PKC activity in three M-HCC cells confirming that PKCα is responsible for the observed PKC activity in M-HCC cells. d Stable knockdown of PKCα with two different shRNAs inhibit viability of M-HCC cells as assessed by a colony formation assay. The decrease in colony number is significant (p < 0.01) in all cases. e PKC inhibition by 100 nM UCN-01 significantly reduced (SNU475) or completely inhibited (SNU387, SKHep1) the hepatosphere forming ability of M-HCC cell lines. PLC cells overexpressing ZEB1 (ZEB1-induced EMT) also showed a strong inhibition of hepatosphere formation ability upon UCN-01 treatment (bars on the right). The decrease in hepatosphere number was significant (p < 0.05) in all cases
Fig. 7
Fig. 7. ZEB1- or TGFβ-induced EMT renders E-HCC cells sensitive to UCN-01.
a PLC/PRF/5 cells were transfected with pCDNA4 (Con) or pCDNA4-ZEB1 (ZEB1) plasmids. Seventy two hours later and after hallmarks of EMT were observed, cells were treated with 700 nM UCN-01 for 8 h. UCN-01 treatment resulted in significant (47%) apoptosis in ZEB1-expressing cells compared with the control (15%) as assessed by PARP cleavage and mitochondria depolarization. PKCα protein abundance and PKC activity were increased as a result of ZEB1-induced EMT. b Three E-HCC cell lines were treated with TGFβ (2 ng/ml) for 72 h. EMT was confirmed by the analysis of cell morphology, E-Cadherin and vimentin protein expression and localization. All E-HCC cells, with the exception of HepG2, responded to TGFβ showing increased ZEB1 and vimentin expression, cytoplasmic re-distribution of E-Cadherin, disappearance of cortical actin (phalloidin staining) and cell scattering. PKCα abundance and activity were also increased as a result of TGFβ-induced EMT. c TGFβ-responsive (PLC/PRF/5) and non-responsive (HepG2) cells were incubated with TGFβ for 72 h and treated with 700 nM UCN-01 for an additional 8 h. PKC abundance and activity were assessed by western blotting along with the pro-apoptotic activity of UCN-01 as detected using flow cytometry (mitochondria depolarization, % ΔΨm) and PARP cleavage. TGFβ treatment rendered PLC/PRF/5, but not HepG2, cells sensitive to UCN-01-induced cell death
Fig. 8
Fig. 8. UCN-01 has in vivo efficacy for metastatic HCC.
a To test the toxicity and tolerability of UCN-01, SKHep1 cells were subcutaneous injected to SCID BALB/C mice (105 cells). UCN-01 was administered at a weekly dose of 2 mg/kg for 14 weeks after tumours became palpable. UCN-01 reduced tumour growth and therefore animals survived longer meeting welfare criteria. b SNU387 or SKHep1 cells were injected orthotopically (2.5 × 105 cells, mixed 50/50 with Matrigel, as 60 μl) to the liver parenchyma of SCID BALB/C mice. UCN-01 was administered at weekly intervals after a 10-day healing time. Three weeks after injection, cachexia secondary to weight loss became evident in the control group. The experiment was terminated when weight loss exceeded 20% compared with untreated group. Livers (c) and lungs (d) were analysed for the presence of cancer cells using 800CW-2DG probe. UCN-01 treated animals (T1–T3) showed reduced fluorescence compared with control group (C1–C3). e Histopathological analysis revealed poorly differentiated HCC in livers and lungs as presented in ×40 (low) and ×100 (high) magnifications. The tumour boundaries were marked with dashed lines. In all cases UCN-01 treatment reduced tumour burden significantly (p < 0.05). The arrows are marking the areas of condensed nucleus (Pyknosis) in UCN-01 treated samples marking dead cancer cells. f IHC using phospho-PKC-substrate antibody revealed that normal livers and lungs have marginally low PKC activity (left panels). Primary and secondary HCC cells have significantly higher PKC-substrate phosphorylation (middle panels) and UCN-01 treatment eliminated PKC activity (right panels)

References

    1. El-Serag HB. Hepatocellular carcinoma. New Engl. J. Med. 2011;365:1118–1127. doi: 10.1056/NEJMra1001683. - DOI - PubMed
    1. Asghar U, Meyer T. Are there opportunities for chemotherapy in the treatment of hepatocellular cancer? J. Hepatol. 2012;56:686–695. doi: 10.1016/j.jhep.2011.07.031. - DOI - PubMed
    1. Forner A, Llovet JM, Bruix J. Hepatocellular carcinoma. Lancet. 2012;379:1245–1255. doi: 10.1016/S0140-6736(11)61347-0. - DOI - PubMed
    1. Valastyan S, Weinberg RA. Tumor metastasis: molecular insights and evolving paradigms. Cell. 2011;147:275–292. doi: 10.1016/j.cell.2011.09.024. - DOI - PMC - PubMed
    1. Singh A, Settleman J. EMT, cancer stem cells and drug resistance: an emerging axis of evil in the war on cancer. Oncogene. 2010;29:4741–4751. doi: 10.1038/onc.2010.215. - DOI - PMC - PubMed

Publication types

Substances