. 2019 Aug 29:10:2084.
doi: 10.3389/fimmu.2019.02084. eCollection 2019.

Quantification of T-Cell and B-Cell Replication History in Aging, Immunodeficiency, and Newborn Screening

Affiliations

Quantification of T-Cell and B-Cell Replication History in Aging, Immunodeficiency, and Newborn Screening

Ruud H J Verstegen et al. Front Immunol. .

Abstract

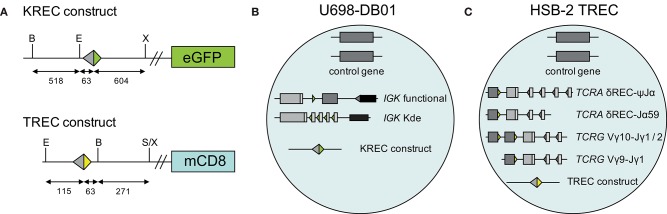
Quantification of T-cell receptor excision circles (TRECs) has impacted on human T-cell research, but interpretations on T-cell replication have been limited due to the lack of a genomic coding joint. We here overcome this limitation with multiplex TRG rearrangement quantification (detecting ~0.98 alleles per TCRαβ+ T cell) and the HSB-2 cell line with a retrovirally introduced TREC construct. We uncovered <5 cell divisions in naive and >10 cell divisions in effector memory T-cell subsets. Furthermore, we show that TREC dilution with age in healthy adults results mainly from increased T cell replication history. This proliferation was significantly increased in patients with predominantly antibody deficiency. Finally, Guthrie cards of neonates with Down syndrome have fewer T and B cells than controls, with similar T-cell and slightly higher B-cell replication. Thus, combined analysis of TRG coding joints and TREC signal joints can be utilized to quantify in vivo T-cell replication, and has direct applications for research into aging, immunodeficiency, and newborn screening.

Keywords: T-cell replication; TREC; TRG; aging; newborn screening; primary immunodeficiency.


Figures

Figure 1
Figure 1
Generation of TREC signal joint containing cell lines. (A) Schematic overview of KREC and TREC constructs. Colored triangles depict RSS, fragment sizes (in bp) are depicted below the constructs, restriction sites: B, BamHI; E, EcoRI; S, SalI; X, XhoI. (B) Genetic composition of U698-DB01 and (C) HSB-2 TREC cell lines.
Figure 2
Figure 2
Development of a multiplex TRG PCR to quantify Vγ-Jγ coding joints as a marker for T cells. (A) Sequential rearrangements in the TCRAD locus. Following V(D)J recombination of TCRD, the whole locus is then deleted in the αβ+ T-cell lineage, predominantly by δREC–ψJα rearrangements. The rearrangements give rise to a δREC–ψJα signal joint on an excision circle (TREC) and a δREC–ψJα coding joint in the genome. The coding joint is deleted from the genome by TCRA (Vα-Jα) rearrangements and is then located on an excision circle as well (22, 23). (B) Rearrangements of TRG locus resulting in formation of Vγ-Jγ coding joint. (C) Schematic overview of the multiplex TGR PCR assay, which contains 4 Vγ forward primers, 2 Jγ reverse primers and 2 Jγ probes (See Table S2). (D) Mean number of rearranged TRG alleles per cell detected by multiplex TRG RQ-PCR assay in purified TCRαβ+ and TCRγδ+ T cells. The reduced detection in TCRγδ+ T cells is the result of our deliberate decision to omit detection of the frequently utilized Jγ1.2 gene in TCRγδ+ T cells.
Figure 3
Figure 3
Replication histories of T-cell subsets in healthy controls. (A) Flow cytometric representation of T-cell differentiation stages. T-cell subsets were sort-purified based on the indicated gating strategy. (B,C) Schematic representation of CD4+ and CD8+ T-cell maturation and replication histories of the purified subsets. RTE, recent thymic emigrants; Tcm, central memory T cell; Tnaive, naive T cell; TemRO and TemRA, terminally differentiated effector memory T cell. The Mann-Whitney U test was used for statistical analysis: *p < 0.05; **p < 0.01; ***p < 0.001.
Figure 4
Figure 4
T-cell replication history increases with age. (A) Correlation plots of TRG, TRECs and T-cell replication histories as determined from whole blood vs. age of the donor. (B) Correlation plots of intronRSS-Kde, KREC and B-cell replication history. Data were obtained from 59 healthy controls. Spearman r was used for statistical analysis.
Figure 5
Figure 5
B-cell and T-cell replication histories in PAD patients. (A) intronRSS-Kde, KRECs and B-cell replication histories, and (B) TRG, TRECs and T-cell replication history for healthy controls and patients with XLA (n = 9) and PAD (CVID and hypogammaglobinemia) with infections only (n = 14) and non-infectious complications (n = 28) as determined from whole blood. Obtained values are shown in gray and undetectable values are shown in black; numbers indicated represent detectable values, and only they were included for statistical analysis with the Mann-Whitney U-test: *p < 0.05; **p < 0.01; ***p < 0.001; ****p < 0.0001.
Figure 6
Figure 6
B-cell and T-cell replication histories in neonates with Down syndrome. IntronRSS-Kde and KREC (A), and TRG and TREC (B) in healthy neonates and children with Down syndrome, corrected for DNA input as determined from Guthrie cards. (C) B- and T-cell replication histories for healthy neonates and children with Down syndrome. The Mann-Whitney U-test was used for statistical analysis.

Similar articles

Cited by

References

    1. Picard C, Bobby Gaspar H, Al-Herz W, Bousfiha A, Casanova JL, Chatila T, et al. . International Union of Immunological Societies: 2017 primary immunodeficiency diseases committee report on inborn errors of immunity. J Clin Immunol. (2018) 38:96–128. 10.1007/s10875-017-0464-9 - DOI - PMC - PubMed
    1. Cirillo E, Giardino G, Gallo V, D'Assante R, Grasso F, Romano R, et al. . Severe combined immunodeficiency–an update. Ann N Y Acad Sci. (2015) 1356:90–106. 10.1111/nyas.12849 - DOI - PubMed
    1. Modell V, Orange JS, Quinn J, Modell F. Global report on primary immunodeficiencies: 2018 update from the Jeffrey Modell Centers Network on disease classification, regional trends, treatment modalities, and physician reported outcomes. Immunol Res. (2018) 66:367–80. 10.1007/s12026-018-8996-5 - DOI - PubMed
    1. Chapel H, Lucas M, Lee M, Bjorkander J, Webster D, Grimbacher B, et al. . Common variable immunodeficiency disorders: division into distinct clinical phenotypes. Blood. (2008) 112:277–86. 10.1182/blood-2007-11-124545 - DOI - PubMed
    1. Slade CA, Bosco JJ, Binh Giang T, Kruse E, Stirling RG, Cameron PU, et al. . Delayed diagnosis and complications of predominantly antibody deficiencies in a cohort of Australian adults. Front Immunol. (2018) 9:694. 10.3389/fimmu.2018.00694 - DOI - PMC - PubMed

Publication types