

Down-Regulation of CYP79A1 Gene Through Antisense Approach Reduced the Cyanogenic Glycoside Dhurrin in [ Sorghum bicolor (L.) Moench] to Improve Fodder Quality
- PMID: 31544105
- PMCID: PMC6729101
- DOI: 10.3389/fnut.2019.00122
Down-Regulation of CYP79A1 Gene Through Antisense Approach Reduced the Cyanogenic Glycoside Dhurrin in [ Sorghum bicolor (L.) Moench] to Improve Fodder Quality
Abstract
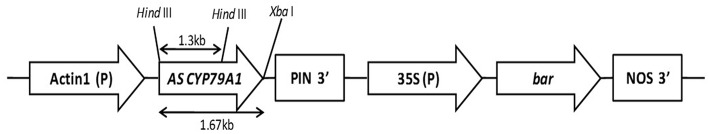
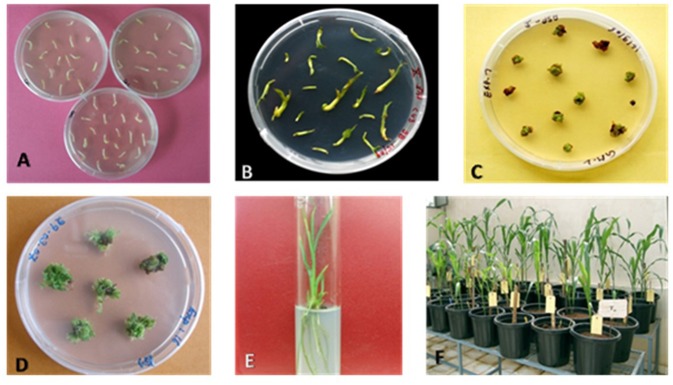
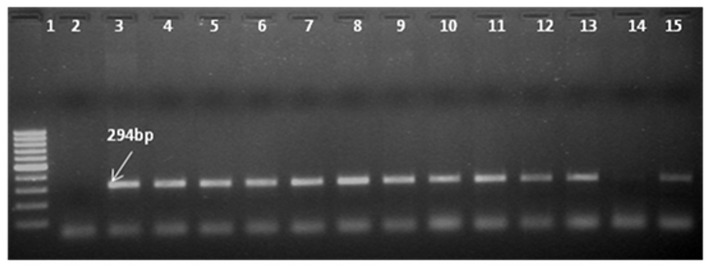
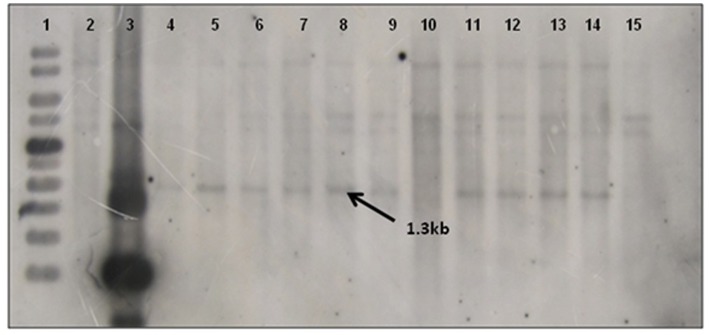
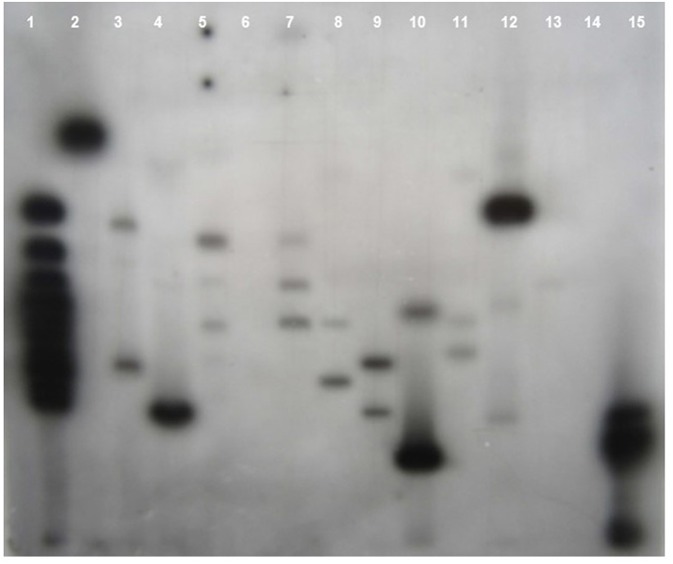
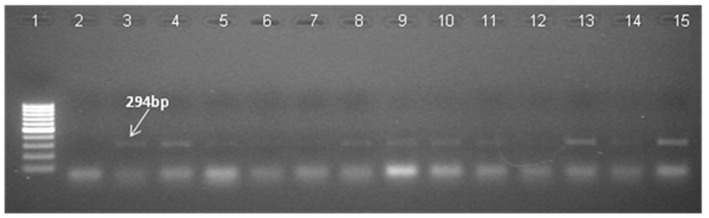
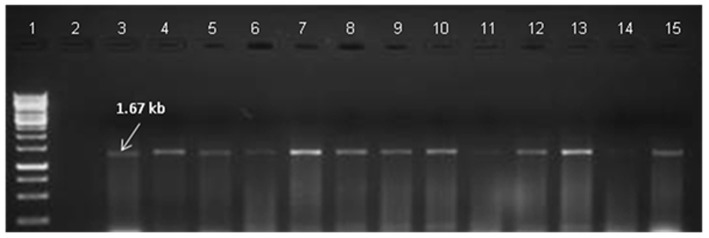
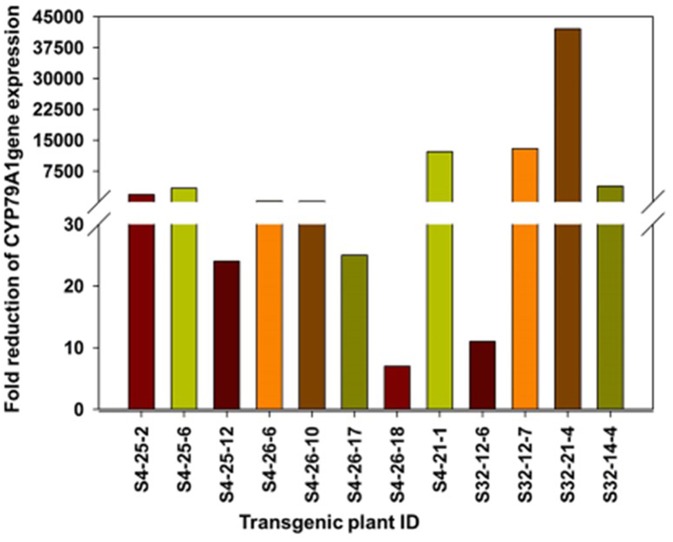
A major limitation for the utilization of sorghum forage is the production of the cyanogenic glycoside dhurrin in its leaves and stem that may cause the death of cattle feeding on it at the pre-flowering stage. Therefore, we attempted to develop transgenic sorghum plants with reduced levels of hydrogen cyanide (HCN) by antisense mediated down-regulation of the expression of cytochrome P450 CYP79A1, the key enzyme of the dhurrin biosynthesis pathway. CYP79A1 cDNA was isolated and cloned in antisense orientation, driven by rice Act1 promoter. Shoot meristem explants of sorghum cultivar CSV 15 were transformed by the particle bombardment method and 27 transgenics showing the integration of transgene were developed. The biochemical assay for HCN in the transgenic sorghum plants confirmed significantly reduced HCN levels in transgenic plants and their progenies. The HCN content in the transgenics varied from 5.1 to 149.8 μg/g compared to 192.08 μg/g in the non-transformed control on dry weight basis. Progenies with reduced HCN content were advanced after each generation till T3. In T3 generation, progenies of two promising events were tested which produced highly reduced levels of HCN (mean of 62.9 and 76.2 μg/g, against the control mean of 221.4 μg/g). The reduction in the HCN levels of transgenics confirmed the usefulness of this approach for reducing HCN levels in forage sorghum plants. The study effectively demonstrated that the antisense CYP79A1 gene deployment was effective in producing sorghum plants with lower HCN content which are safer for cattle to feed on.
Keywords: CYP79A1; HCN; Sorghum bicolor; antisense; dhurrin; forage quality; transgenics.
Figures
Similar articles
-
Transgenic tobacco and Arabidopsis plants expressing the two multifunctional sorghum cytochrome P450 enzymes, CYP79A1 and CYP71E1, are cyanogenic and accumulate metabolites derived from intermediates in Dhurrin biosynthesis.Plant Physiol. 2000 Aug;123(4):1437-48. doi: 10.1104/pp.123.4.1437. Plant Physiol. 2000. PMID: 10938360 Free PMC article.
-
A combined biochemical screen and TILLING approach identifies mutations in Sorghum bicolor L. Moench resulting in acyanogenic forage production.Plant Biotechnol J. 2012 Jan;10(1):54-66. doi: 10.1111/j.1467-7652.2011.00646.x. Epub 2011 Aug 31. Plant Biotechnol J. 2012. PMID: 21880107
-
Consequences of transferring three sorghum genes for secondary metabolite (cyanogenic glucoside) biosynthesis to grapevine hairy roots.Transgenic Res. 2006 Apr;15(2):181-95. doi: 10.1007/s11248-005-3737-7. Transgenic Res. 2006. PMID: 16604459
-
Dhurrin in Sorghum: Biosynthesis, Regulation, Biological Function and Challenges for Animal Production.Plants (Basel). 2024 Aug 17;13(16):2291. doi: 10.3390/plants13162291. Plants (Basel). 2024. PMID: 39204727 Free PMC article. Review.
-
Biosynthesis and regulation of cyanogenic glycoside production in forage plants.Appl Microbiol Biotechnol. 2018 Jan;102(1):9-16. doi: 10.1007/s00253-017-8559-z. Epub 2017 Oct 12. Appl Microbiol Biotechnol. 2018. PMID: 29022076 Review.
Cited by
-
Developing benzylisoquinoline alkaloid-enriched opium poppy via CRISPR-directed genome editing: A review.BMC Plant Biol. 2024 Jul 24;24(1):700. doi: 10.1186/s12870-024-05412-x. BMC Plant Biol. 2024. PMID: 39048937 Free PMC article. Review.
-
Metabolomic and transcriptomic analyses of drought resistance mechanisms in sorghum varieties.PeerJ. 2025 Jul 4;13:e19596. doi: 10.7717/peerj.19596. eCollection 2025. PeerJ. 2025. PMID: 40625922 Free PMC article.
-
Antisense RNA (asRNA) technology: the concept and applications in crop improvement and sustainable agriculture.Mol Biol Rep. 2023 Nov;50(11):9545-9557. doi: 10.1007/s11033-023-08814-6. Epub 2023 Sep 27. Mol Biol Rep. 2023. PMID: 37755651 Review.
-
A chromosome-scale genome sequence of sudangrass (Sorghum sudanense) highlights the genome evolution and regulation of dhurrin biosynthesis.Theor Appl Genet. 2023 Mar 13;136(3):60. doi: 10.1007/s00122-023-04262-9. Theor Appl Genet. 2023. PMID: 36912984
-
Genetic manipulation of anti-nutritional factors in major crops for a sustainable diet in future.Front Plant Sci. 2023 Feb 15;13:1070398. doi: 10.3389/fpls.2022.1070398. eCollection 2022. Front Plant Sci. 2023. PMID: 36874916 Free PMC article. Review.
References
-
- F.A.O. FAOSTAT. Food and Agricultural Organization (2018). Available online at: http://fao.org/faostat/en/#home (accessed August 10, 2018).
-
- Haskins FA, Gorz HJ, Johnson BE. Seasonal variation in leaf hydrocyanic acid potential of low and high Dhurrin sorghum. Crop Sci. (1987) 27:903–6. 10.2135/cropsci1987.0011183X002700050014x - DOI
-
- Koch BM, Sibbesen O, Halkier BA, Svendsen I, Moller BL. The primary sequence of cytochrome P450tyr, the multifunctional N-Hydroxylase catalyzing the conversion of L-Tyrosine to p-Hydroxyphenyl acetaldehyde oxime in the biosynthesis of the cyanogenic glucoside dhurrin in Sorghum bicolor (L) Moench. Arch. Biochem. Biophys. (1995) 323:177–86. 10.1006/abbi.1995.0024 - DOI - PubMed
LinkOut - more resources
Full Text Sources