. 2019 Dec 2;47(21):11225-11237.
doi: 10.1093/nar/gkz810.

Single-molecule visualization of human BLM helicase as it acts upon double- and single-stranded DNA substrates

Affiliations

Single-molecule visualization of human BLM helicase as it acts upon double- and single-stranded DNA substrates

Chaoyou Xue et al. Nucleic Acids Res. .

Erratum in

  • Correction.
    [No authors listed] [No authors listed] Nucleic Acids Res. 2024 Jun 10;52(10):6093. doi: 10.1093/nar/gkae352. Nucleic Acids Res. 2024. PMID: 38686812 Free PMC article. No abstract available.

Abstract

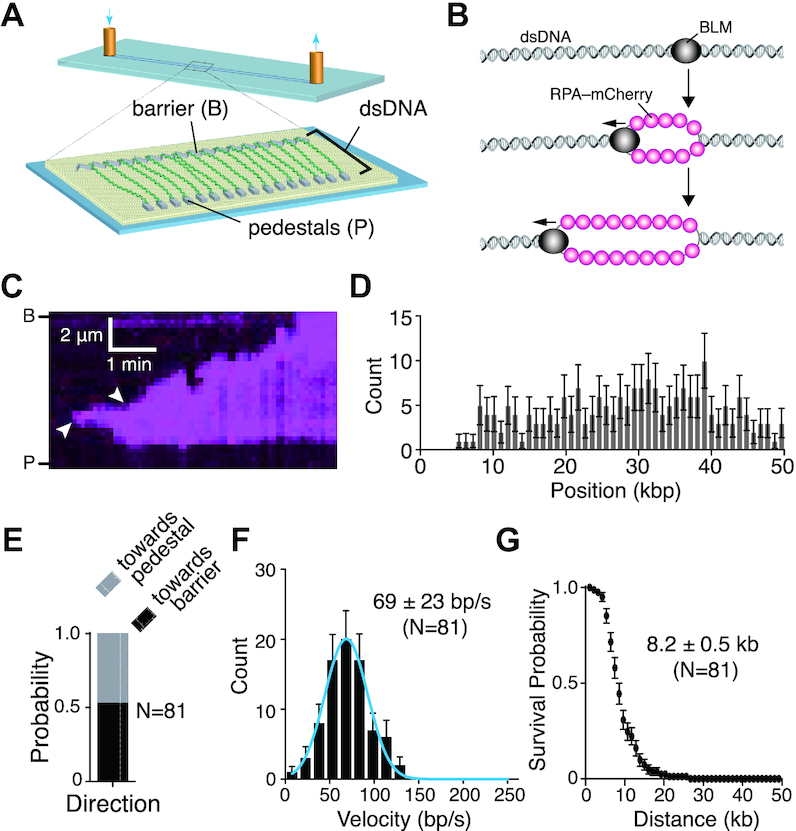
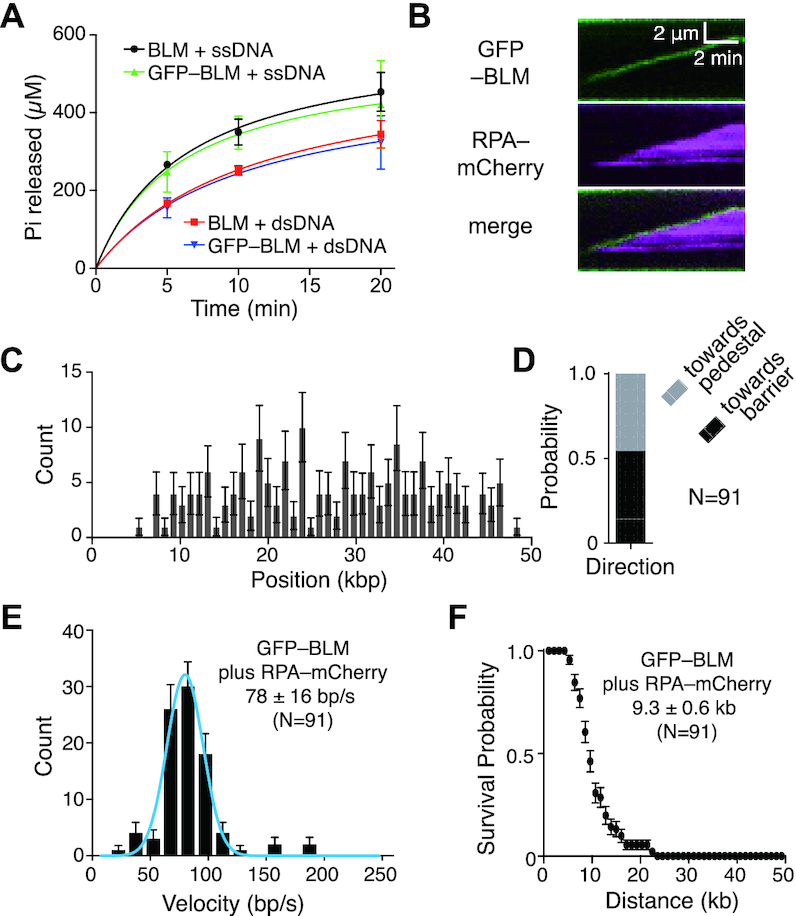
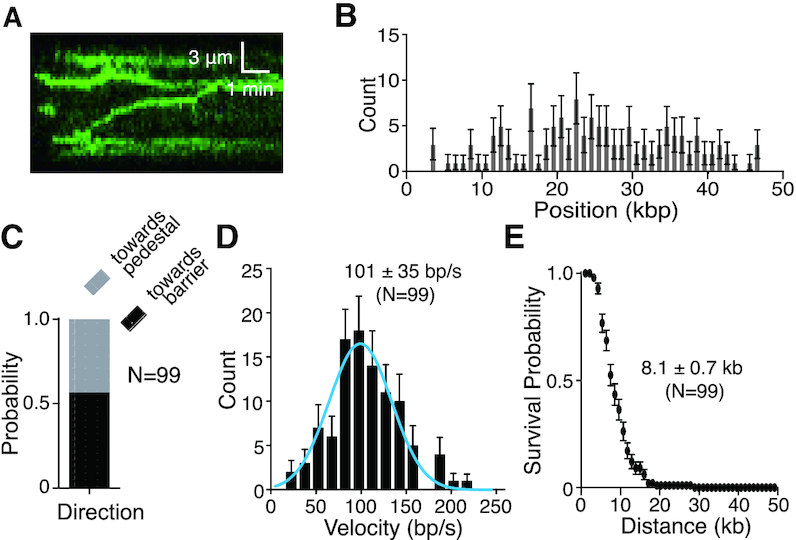
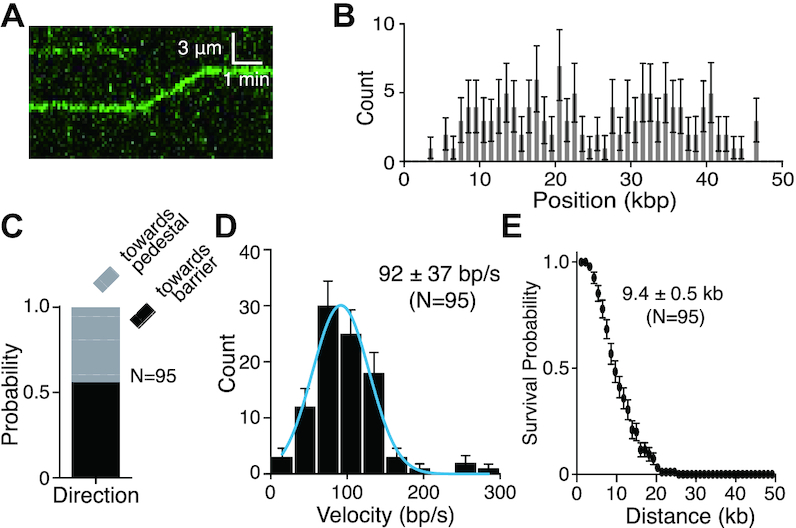
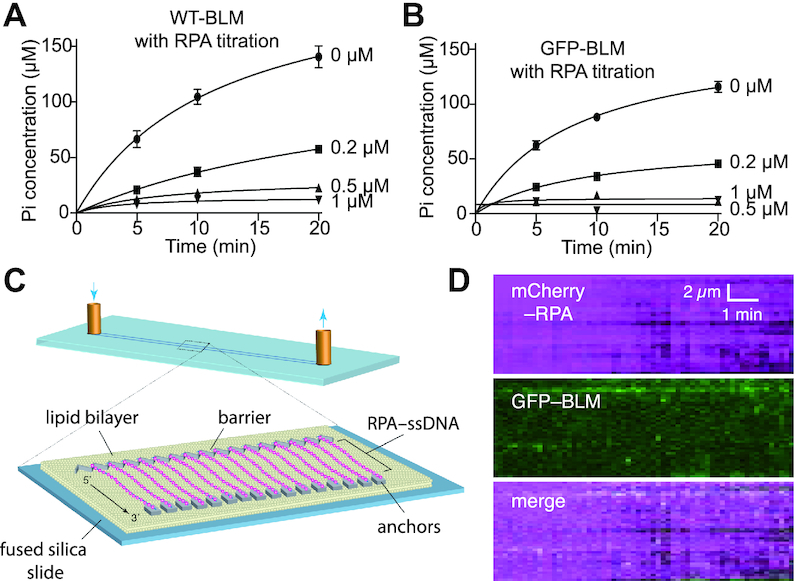
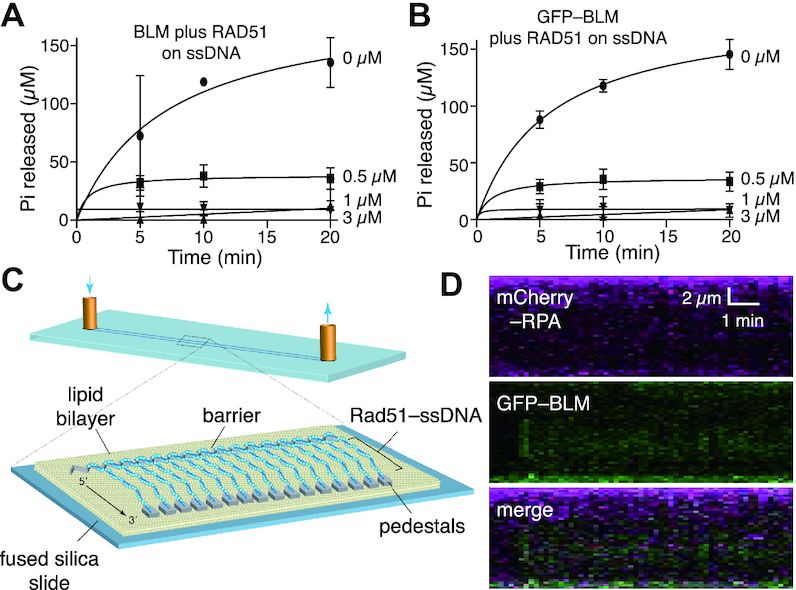
Bloom helicase (BLM) and its orthologs are essential for the maintenance of genome integrity. BLM defects represent the underlying cause of Bloom Syndrome, a rare genetic disorder that is marked by strong cancer predisposition. BLM deficient cells accumulate extensive chromosomal aberrations stemming from dysfunctions in homologous recombination (HR). BLM participates in several HR stages and helps dismantle potentially harmful HR intermediates. However, much remains to be learned about the molecular mechanisms of these BLM-mediated regulatory effects. Here, we use DNA curtains to directly visualize the activity of BLM helicase on single molecules of DNA. Our data show that BLM is a robust helicase capable of rapidly (∼70-80 base pairs per second) unwinding extensive tracts (∼8-10 kilobases) of double-stranded DNA (dsDNA). Importantly, we find no evidence for BLM activity on single-stranded DNA (ssDNA) that is bound by replication protein A (RPA). Likewise, our results show that BLM can neither associate with nor translocate on ssDNA that is bound by the recombinase protein RAD51. Moreover, our data reveal that the presence of RAD51 also blocks BLM translocation on dsDNA substrates. We discuss our findings within the context of potential regulator roles for BLM helicase during DNA replication and repair.


Figures

Figure 1.
Figure 1.
BLM is a fast and highly processive dsDNA helicase. (A) Schematic illustration of the double-tethered DNA curtains assay. (B) Schematic showing experimental rational for the detection of dsDNA unwinding activity for unlabeled BLM as revealed by the binding of RPA-mCherry to the resulting ssDNA products. (C) Kymograph showing BLM (unlabeled) unwinding dsDNA (unlabeled) as revealed by the binding of RPA-mCherry (magenta); note that buffer flow was OFF during data collection. Arrowheads indicate the sites where BLM initiated dsDNA unwinding based upon the appearance of RPA-mCherry. Reactions contained 0.2 nM unlabeled BLM and 1 nM RPA-mCherry. (D) Distribution of sites where BLM initiated dsDNA unwinding; error bars represent 95% confidence intervals calculated from bootstrap analysis. (E) Quantification of BLM translocation direction in reactions with 1 nM RPA-mCherry. ‘Towards pedestal’ indicates BLM movement in the direction from the barrier to the pedestal, and ‘towards barrier’ indicates movement in the opposite direction. (F) Velocity distribution of BLM unwinding rates in reactions with 1 nM RPA-mCherry on double-tethered dsDNA. The solid blue line represents a Gaussian fit to the data. Error bars represent 95% confidence intervals calculated from bootstrap analysis. (G) Survival probability plot of BLM translocation with 1 nM RPA-mCherry on double-tethered dsDNA. Error bars represent 95% confidence intervals calculated from bootstrap analysis.
Figure 2.
Figure 2.
GFP-tagged BLM is active for dsDNA translocation and unwinding. (A) ATP hydrolysis assays comparing unlabeled BLM (10 nM) to GFP-tagged BLM (10 nM) in the presence of either ssDNA (M13) or dsDNA (pUC19). Data points represent the mean and standard deviation of three independent experiments. (B) Kymograph showing GFP–BLM (green) unwinding dsDNA in the presence of 1 nM RPA-mCherry (magenta); note that buffer flow was OFF during data collection. Reactions contained 0.2 nM GFP–BLM and 1 nM RPA-mCherry. (C) Distribution of initiation sites for GFP–BLM unwinding in the presence of RPA-mCherry (N = 175). Error bars represent 95% confidence intervals calculated from bootstrap analysis. (D) Quantification of GFP–BLM translocation direction in the presence of 1 nM RPA-mCherry. (E) Velocity distribution of GFP–BLM unwinding rates with 1 nM RPA-mCherry on double-tethered dsDNA. The solid blue line represents a Gaussian fit to the data. Error bars represent 95% confidence intervals calculated from bootstrap analysis. (F) Survival probability plot of GFP–BLM translocation with 1 nM RPA-mCherry on double-tethered dsDNA. Error bars represent 95% confidence intervals calculated from bootstrap analysis.
Figure 3.
Figure 3.
GFP–BLM translocation on dsDNA with unlabeled RPA. (A) Kymograph showing GFP–BLM (0.2 nM; green) translocation on dsDNA (unlabeled) in the presence of 1 nM unlabeled RPA; note that buffer flow was OFF during data collection. (B) Distribution of initiation sites for GFP–BLM in the presence of 1 nM unlabeled RPA (N = 132). Error bars represent 95% confidence intervals calculated from bootstrap analysis. (C) Quantification of GFP–BLM translocation direction in the presence of 1 nM unlabeled RPA. (D) Velocity distribution of GFP–BLM translocation in reactions with 1 nM unlabeled RPA on double-tethered dsDNA. The solid blue line represents a Gaussian fit to the data. Error bars represent 95% confidence intervals calculated from bootstrap analysis. (E) Survival probability plot of GFP–BLM translocation with 1 nM unlabeled RPA on double-tethered dsDNA. Error bars represent 95% confidence intervals calculated from bootstrap analysis.
Figure 4.
Figure 4.
RPA is not necessary for GFP–BLM translocation on dsDNA. (A) Kymograph showing GFP–BLM (0.2 nM; green) translocation on dsDNA (unlabeled) without RPA; buffer flow was OFF during data collection. (B) Distribution of initiation sites for GFP–BLM in the absence of RPA (N = 134). Error bars represent 95% confidence intervals calculated from bootstrap analysis. (C) Quantification of GFP–BLM translocation direction in the absence of RPA. (D) Velocity distribution of GFP–BLM translocation rates without RPA on double-tethered dsDNA. The solid blue line represents a Gaussian fit to the data. Error bars represent 95% confidence intervals calculated from bootstrap analysis. (E) Survival probability plot of GFP–BLM translocation without RPA on double-tethered dsDNA. Error bars represent 95% confidence intervals calculated from bootstrap analysis.
Figure 5.
Figure 5.
RPA blocks BLM interactions with ssDNA. (A) ATPase assays containing 5 nM unlabeled BLM with either 0, 0.2, 0.5 or 1 μM RPA in the presence of ssDNA (M13). Data points represent the mean and standard deviation of three independent experiments; note that the lower total Pi concentration levels in the minus RPA control assays in comparison to Figure 2A is due the difference in BLM concentration (5 nM versus 10 nM). (B) ATPase assays containing 5 nM GFP–BLM with 0, 0.2, 0.5, or 1 μM RPA in the presence of ssDNA. Data points represent the mean and standard deviation of three independent experiments; note that the lower total Pi concentration levels in the minus RPA control assays in comparison to Figure 2A is due the difference in GFP–BLM concentration (5 nM versus 10 nM). (C) Schematic illustration of a ssDNA curtain bound by RPA-mCherry. (D) Kymograph showing that ssDNA-bound RPA-mCherry blocks GFP–BLM (5 nM) interactions with ssDNA; note that buffer flow was OFF during data collection and unbound RPA-mCherry was flushed out of the sample chamber prior to the injection of GFP–BLM.
Figure 6.
Figure 6.
RAD51 blocks BLM activity on ssDNA. (A) ATPase assays containing 5 nM unlabeled BLM in the presence of 0, 0.5, 1 or 3 μM RAD51 and ssDNA (M13). Data points represent the mean and standard deviation of three independent experiments; note that the lower total Pi concentration levels in the minus RPA control assays in comparison to Figure 2A is due the difference in BLM concentration (5 nM versus 10 nM). (B) ATPase assays containing 5 nM GFP–BLM in the presence of 0, 0.5, 1 or 3 μM RAD51 and ssDNA (M13). Data points represent the mean and standard deviation of three independent experiments; note that the lower total Pi concentration levels in the minus RPA control assays in comparison to Figure 2A is due the difference in GFP–BLM concentration (5 nM versus 10 nM). (C) Schematic illustration of a ssDNA curtain bound by unlabeled RAD51-mCherry. (D) Kymograph showing that unlabeled RAD51 prevents GFP–BLM (5 nM) from interacting with ssDNA; note that buffer flow was OFF during data collection, unbound RAD51 was flushed from the sample chamber prior to the injection of GFP–BLM and the reactions contained 1 nM RPA-Cherry.
Figure 7.
Figure 7.
BLM cannot unwind dsDNA bound by RAD51. (A) ATPase assays containing 5 nM unlabeled BLM in the presence of 0, 0.5, 1 or 3 μM RAD51 and dsDNA (pUC19). Data points represent the mean and standard deviation of three independent experiments. (B) ATPase assays containing 5 nM GFP–BLM in the presence of 0, 0.5, 1 or 3 μM RAD51 and dsDNA (pUC19). Data points represent the mean and standard deviation of three independent experiments. (C) Schematic illustration of a double-tethered dsDNA curtain coated with RAD51. (D) Kymograph showing that GFP–BLM (0.4 nM) can bind to RAD51-bound dsDNA, but is unable to unwind the dsDNA; note that buffer flow was OFF during data collection, unbound RAD51 was flushed from the sample chamber prior to the injection of GFP–BLM and the reactions contained 1 nM RPA-Cherry.
Figure 8.
Figure 8.
BLM cannot dismantle RAD51-bound heteroduplex DNA joints. (A) Schematic illustration of heteroduplex joints prepared with RAD51–ssDNA curtains and an Atto565-labeled dsDNA oligonucleotide (70-bp) bearing 15-nts of sequence homologous to the M13-derived ssDNA substrate. (B) Percent of GFP–BLM (15 nM) molecules bound the Atto565-labeled heteroduplex DNA joints or bound elsewhere on the RAD51–ssDNA (N = 116). (C) Kymograph showing outcomes of reactions containing GFP–BLM (15 nM) with RAD51–ssDNA curtains preassembled with the Atto565-labeled heteroduplex DNA joints; note that buffer flow was OFF during data collection. The Asterix highlights an example of bound GFP–BLM that did not co-localize with the heteroduplex DNA joint.

Similar articles

Cited by

References

    1. Bernstein K., Gangloff S., Rothstein R.. The RecQ DNA helicases in DNA repair. Annu. Rev. Genet. 2010; 44:393–417. - PMC - PubMed
    1. Branzei D., Foiani M.. RecQ helicases queuing with Srs2 to disrupt Rad51 filaments and suppress recombination. Genes Dev. 2007; 21:3019–3026. - PubMed
    1. Chu W., Hickson I.. RecQ helicases: multifunctional genome caretakers. Nat. Rev. Cancer. 2009; 9:644–654. - PubMed
    1. Croteau D., Popuri V., Opresko P., Bohr V.. Human RecQ helicases in DNA repair, recombination, and replication. Annu. Rev. Biochem. 2014; 83:519–552. - PMC - PubMed
    1. Brosh R., Jr. DNA helicases involved in DNA repair and their roles in cancer. Nat. Rev. Cancer. 2013; 13:542–558. - PMC - PubMed

Publication types