. 2019 Sep 23:8:e48686.
doi: 10.7554/eLife.48686.

TRAIP drives replisome disassembly and mitotic DNA repair synthesis at sites of incomplete DNA replication

Affiliations

TRAIP drives replisome disassembly and mitotic DNA repair synthesis at sites of incomplete DNA replication

Remi Sonneville et al. Elife. .

Abstract

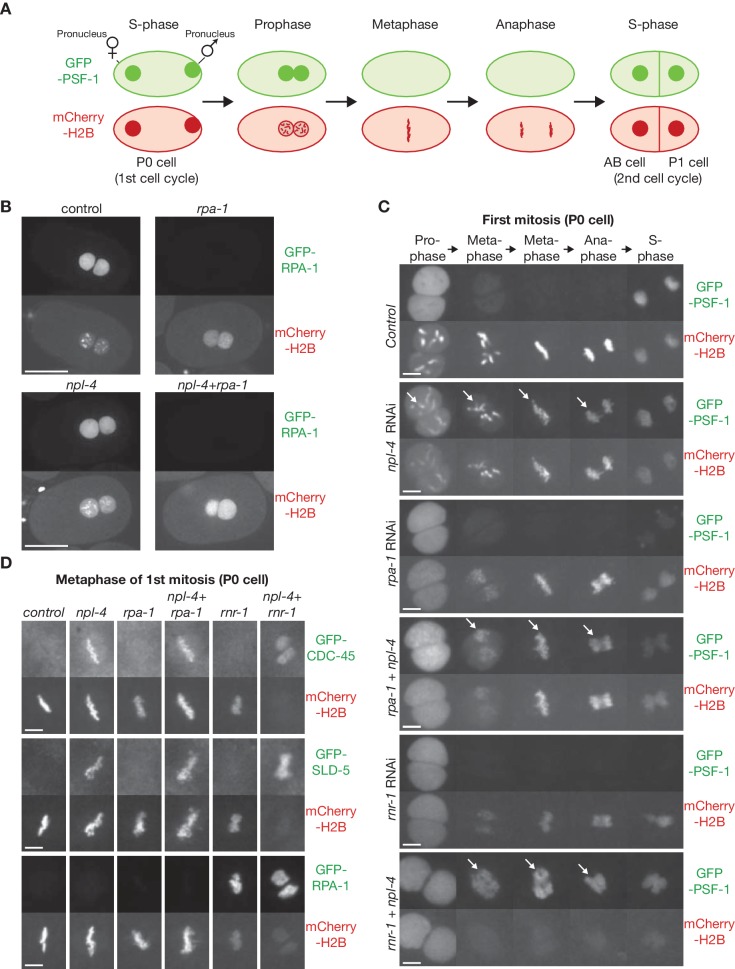
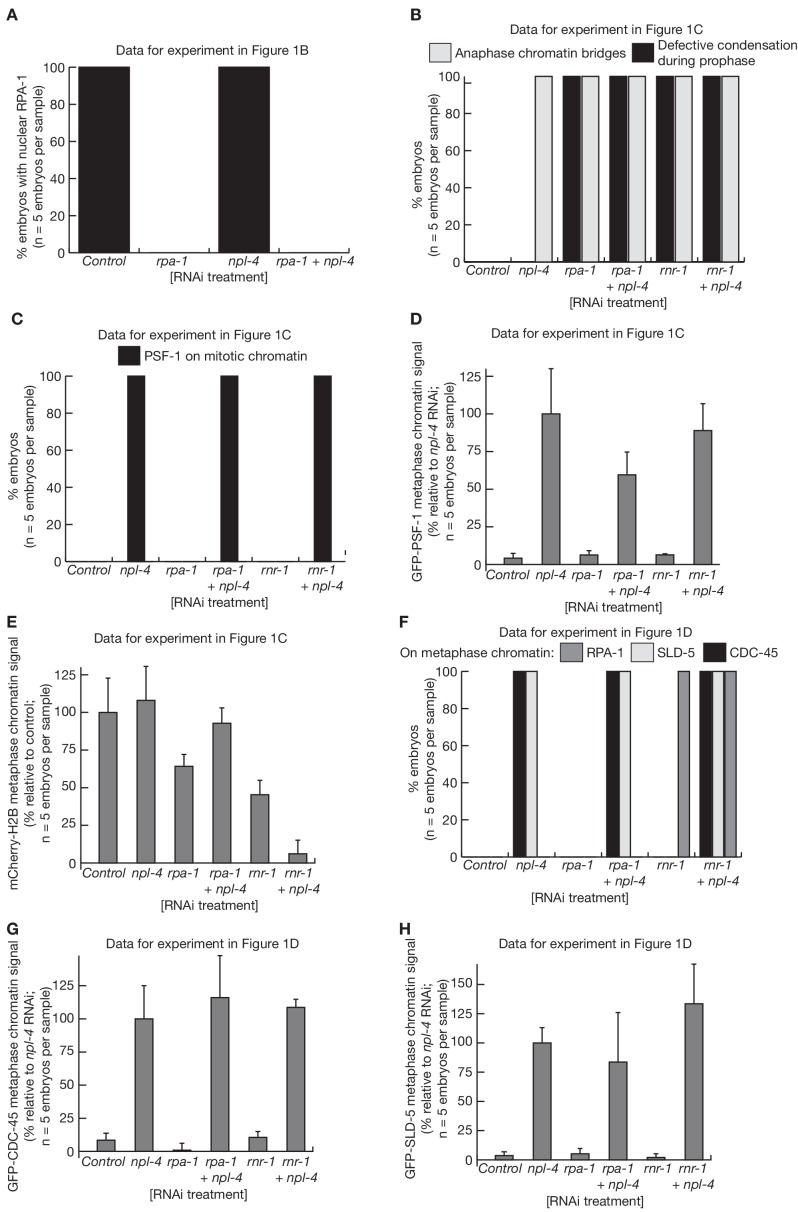
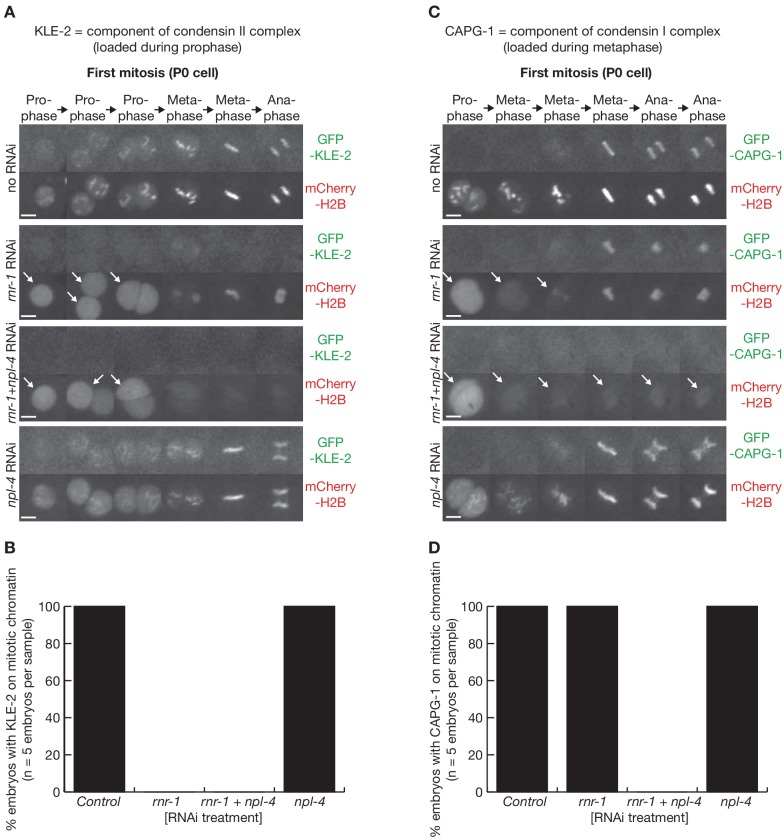
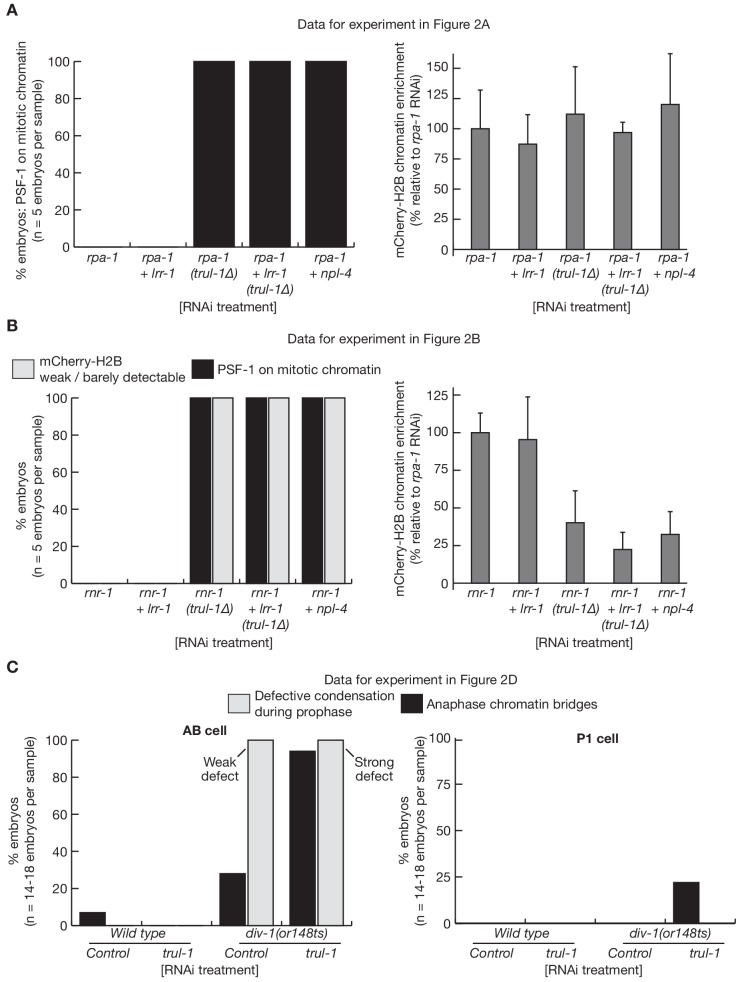
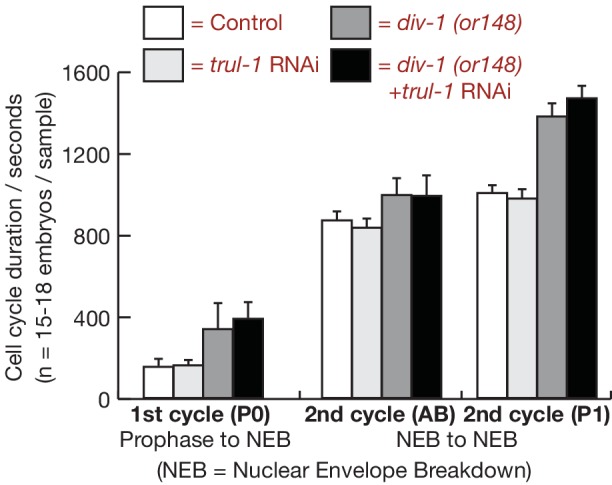
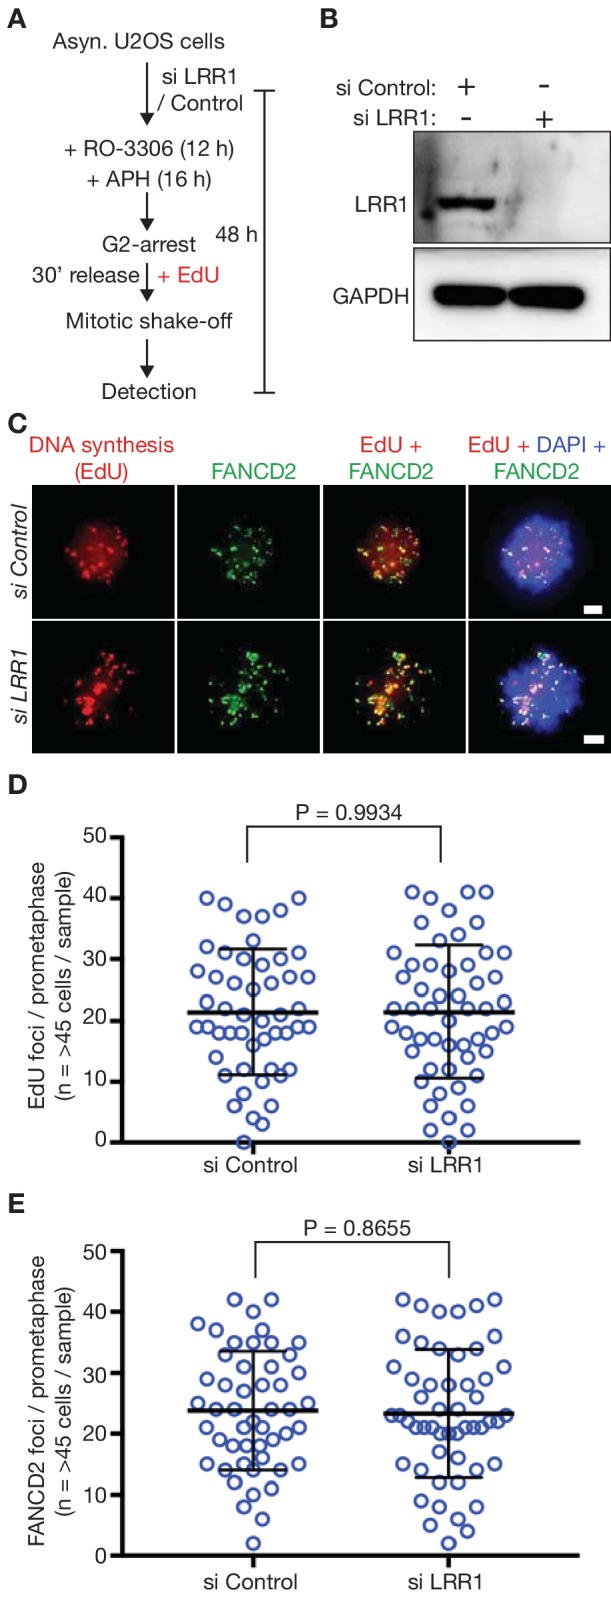
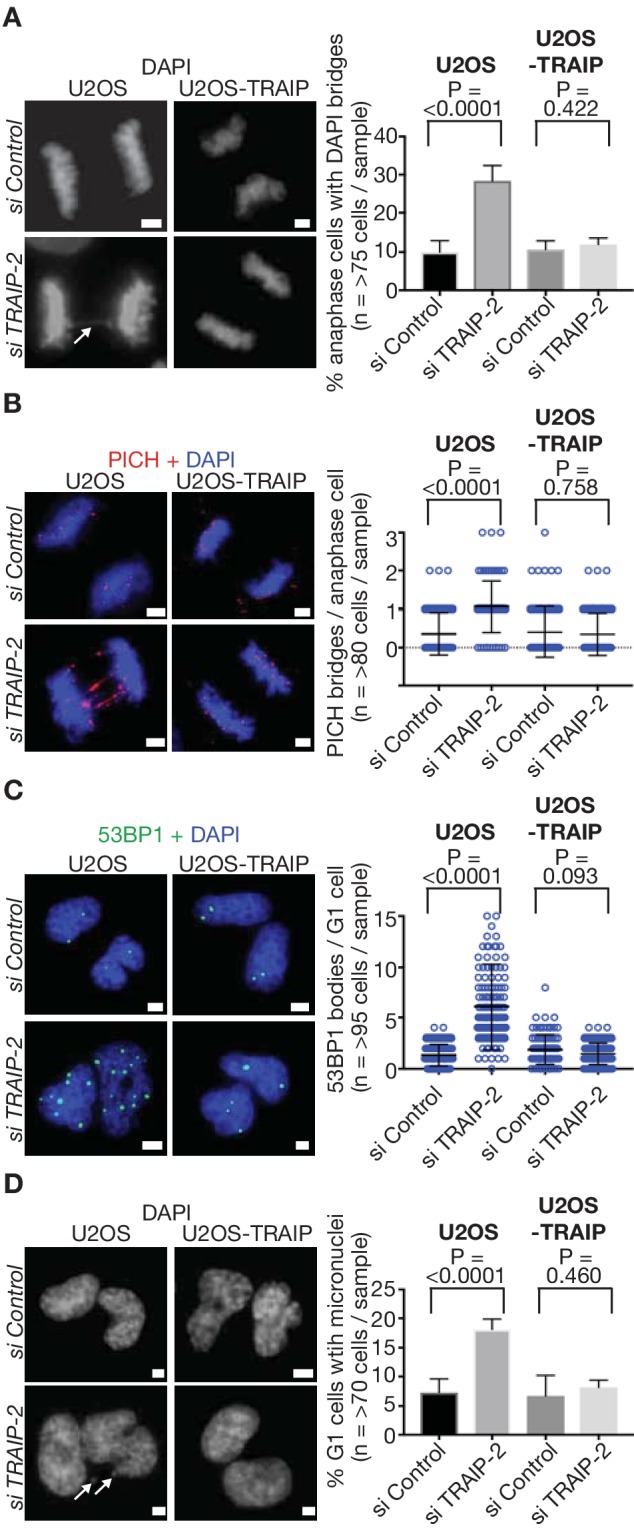
The faithful segregation of eukaryotic chromosomes in mitosis requires that the genome be duplicated completely prior to anaphase. However, cells with large genomes sometimes fail to complete replication during interphase and instead enter mitosis with regions of incompletely replicated DNA. These regions are processed in early mitosis via a process known as mitotic DNA repair synthesis (MiDAS), but little is known about how cells switch from conventional DNA replication to MiDAS. Using the early embryo of the nematode Caenorhabditis elegans as a model system, we show that the TRAIP ubiquitin ligase drives replisome disassembly in response to incomplete DNA replication, thereby providing access to replication forks for other factors. Moreover, TRAIP is essential for MiDAS in human cells, and is important in both systems to prevent mitotic segregation errors. Our data indicate that TRAIP is a master regulator of the processing of incomplete DNA replication during mitosis in metazoa.

Keywords: C. elegans; DNA replication; TRAIP; chromosomes; fragile site; gene expression; genome stability; human; mitosis; ubiquitin ligase.


Conflict of interest statement

RS, RB, SH, NM, IH, KL No competing interests declared

Figures

Figure 1.
Figure 1.. Incomplete DNA replication in C. elegans early embryos leads to unloading of the CMG helicase from chromatin by the CDC-48_UFD-1_NPL-4 segregase.
(A) Illustration of the first cell cycle in the C. elegans early embryo. (B) Worms expressing GFP-RPA-1 and mCherry-Histone H2B were exposed to the indicated RNAi treatments (control = no RNAi). Images of whole embryos are shown, during prophase of the first embryonic cell cycle (two minutes before nuclear envelope breakdown), in order to illustrate the efficiency of RPA-1 depletion. (C) Worms expressing GFP-PSF-1 and mCherry-Histone H2B were exposed to the indicated RNAi treatments, before time-lapse imaging of the first mitosis in isolated embryos. The arrows indicate persistence of CMG on mitotic chromatin. (D) Worms expressing the indicated GFP-tagged replication proteins, together with mCherry-Histone H2B, were exposed to the same range of RNAi treatments as in (C). Examples are shown of the metaphase stage of the first embryonic mitosis. Scale bars = 20 µm in (B) and 5 µm in (C and D). Quantification of microscopy data is provided in Figure 1—figure supplement 1.
Figure 1—figure supplement 1.
Figure 1—figure supplement 1.. Quantification of C. elegans microscopy data in Figure 1.
The figure presents quantification of the microscopy data for the experiments in Figure 1B (A), Figure 1C (B–E) and Figure 1D (F–H). The signals for GFP-PSF-1 (D), mCherry-Histone-H2B (E), GFP-CDC-45 (G) and GFP-SLD-5 (H) were quantified as described in Materials and methods.
Figure 1—figure supplement 2.
Figure 1—figure supplement 2.. Condensation is profoundly defective following depletion of RNR-1 and NPL-4 in C. elegans early embryos.
(A) Videos of embryos expressing GFP-KLE-2 and mCherry-Histone, treated with the indicated RNAi. (B) Quantification of the microscopy data in (A). (C) Videos of embryos expressing GFP-CAPG-1 and mCherry-Histone, treated with the indicated RNAi. Arrows denote defective chromatin condensation. (D) Quantification of the microscopy data in (C).
Figure 2.
Figure 2.. The TRUL-1 orthologue of human TRAIP is required for CMG unloading and genome integrity in response to incomplete DNA replication in C. elegans early embryos.
(A) Videos of control and trul-1∆ embryos expressing GFP-PSF-1 and mCherry-Histone H2B, treated with RNAi to rpa-1, lrr-1 and npl-4 as indicated. Arrows indicate persistence of CMG on mitotic chromatin. (B) Videos of control and trul-1∆ embryos expressing GFP-PSF-1 and mCherry-Histone H2B, treated with the indicated RNAi treatments. Arrows indicate persistence of CMG on mitotic chromatin. (C) Embryonic viability was measured for the indicated strains, using worms grown at the temperatures shown. The data correspond to the mean and standard deviation from three independent experiments. (D) Videos of control and div-1(or148) temperature sensitive embryos expressing GFP-PSF-1 and mCherry-Histone H2B, treated with empty RNAi vector or RNAi to trul-1 as indicated. In order to inactivate DIV-1, the worms were grown at the restrictive temperature of 25°C for 24 hr before imaging. The images correspond to division of the AB cell during the second embryonic cell cycle. White arrows indicate defective chromosome condensation during prophase, whereas red arrows denote chromatin bridges during anaphase. (E) Quantification of the percentage of cells with anaphase bridges in the first two embryonic cell cycles, for the experiment shown in (D). Scale bars in all microscopy images = 5 µm. Further quantification of microscopy data is provided in Figure 2—figure supplement 3.
Figure 2—figure supplement 1.
Figure 2—figure supplement 1.. Deletion of the C. elegans trul-1 gene by CRISPR-Cas9.
(A) Illustration of the trul-1 locus in the C. elegans genome, and the region deleted in the trul-1∆ strains (dotted line – the deletion removes all but the last 249 bp of the trul-1 coding sequence). The red arrows denote PCR primers that were used to confirm the deletion. Red lines indicate the predicted size of the corresponding PCR products. (B) Confirmation of trul-1∆ via PCR. (C) Extracts of embryos from the indicated strains were used to monitor the indicated proteins by immunoblotting.
Figure 2—figure supplement 2.
Figure 2—figure supplement 2.. TRUL-1 is required for disassembly of the CMG helicase during mitosis, and preserves genome integrity together with LRR-1.
(A) Videos of control and trul-1∆ embryos expressing GFP-PSF-1 and mCherry-Histone H2B, after treatment with the indicated RNAi (scalebars = 5 µm). The arrows indicate the persistence of CMG on mitotic chromatin. (B) Quantification of the percentage of cells with PSF-1 on mitotic chromatin during the first embryonic cell cycle, for the experiment in (A). (C) Quantification of the percentage of cells with anaphase bridges in the first two embryonic cell cycles, for the experiment in (A).
Figure 2—figure supplement 3.
Figure 2—figure supplement 3.. Quantification of C. elegans microscopy data in Figure 2.
The figure presents quantification of the microscopy data for the experiments in Figure 2A (A), Figure 2B (B) and Figure 2D (C). The mCherry-Histone-H2B signal (A–B) was quantified as described in Materials and methods.
Figure 2—figure supplement 4.
Figure 2—figure supplement 4.. Timing of cell division for the first two embryonic cell cycles after inactivation of DIV-1 and TRUL-1.
For the experiment in Figure 2D–E, the indicated cell cycle parameters were measured by time-lapse video microscopy, for control and div-1 worms expressing GFP-PSF-1 and mCherry-Histone. The figure indicates the mean and standard deviation of the data.
Figure 2—figure supplement 5.
Figure 2—figure supplement 5.. TRUL-1 is important for genome integrity and the successful completion of chromosome replication, when cells are exposed mild DNA replication stress, resulting from a diluted rnr-1 RNAi.
(A) Control and trul-1∆ worms were exposed to the indicated dilutions of rnr-1 RNAi, as described in Materials and methods, and embryos were then analysed by video microscopy and scored for chromatin bridges during mitosis of the P0 cell (first cell cycle). (B) Exposure to 100% rnr-1 RNAi leads to impaired chromosome condensation during prophase (red arrows) and increased chromatin bridges during anaphase (white arrows), in both control and trul-1∆ worms. (C) 10% rnr-1 RNAi specifically induces defective condensation during prophase (red arrows) and increased chromatin bridges during anaphase (white arrows), in the AB cell of trul-1∆ worms. (D) Quantification of the percentage of embryos with anaphase bridges in the AB cell of the second cell cycle, for the experiment in (C). (E) Quantification of the percentage of embryos with defective chromosome condensation during prophase in the AB cell, for the experiment in (C).
Figure 3.
Figure 3.. The TRAIP E3 ligase is required for mitotic DNA repair synthesis in response to DNA replication stress in human cells.
(A) Immunoblots illustrating depletion of TRAIP by two specific siRNAs in human U2OS cells. (B) Experimental protocol: human U2OS cells were exposed to control siRNA or TRAIP-specific siRNA for 48 hr. During the last 16 hr of siRNA treatment, the cells were treated with the DNA polymerase inhibitor aphidicolin (APH), and the CDK1 inhibitor RO-3306 was then added for the final 12 hr of siRNA treatment to arrest the cells in G2-phase. Subsequently, the cells were released from G2-arrest in the absence of RO-3306 for 30 min in the presence of the nucleoside analogue EdU. Mitotic cells were harvested by mitotic shake-off and processed for markers of the mitotic pathway for DNA repair synthesis (foci of EdU incorporation that largely co-localise with foci of the FANCD2 protein). (C) Representative micrographs of ‘prometaphase’ mitotic cells treated as in (B). The scale bars correspond to 2 µm. (D) Quantification of the number of EdU foci per prometaphase cell. (E) Quantification of the number of FANCD2 foci per prometaphase cell. (F) U2OS control cells, U2OS cells expressing wild type TRAIP, and U2OS cells expressing a RING-mutant of TRAIP were treated as described above. Representative micrographs show EdU foci and FANCD2 foci in prometaphase cells. The scale bars correspond to 2 µm. (G) Quantification of the number of EdU foci per prometaphase cell. (H) Quantification of the number of FANCD2 foci per prometaphase cell. Note that ectopic expression of the TRAIPRING mutant causes a partial dominant negative phenotype (reduced frequency of EdU and FANCD2 foci, even with si Control), as seen previously (Hoffmann et al., 2016). For panels D-E and G-H, the broad horizontal lines represent the mean for the entire data set, and the shorter lines above and below denote the standard deviations. P-values were generated via a Mann-Whitney test.
Figure 3—figure supplement 1.
Figure 3—figure supplement 1.. Depletion of LRR1 does not block MiDAS in human U2-OS cells.
(A) Cells were processed as indicated. (B) Immunoblots illustrating depletion of LRR1 in human U2OS cells by a pool of specific siRNAs (see Materials and methods, and Key Resource Table). (C) Prometaphase mitotic cells treated as in (B). The scale bars correspond to 2 µm. (D) Quantification of the number of EdU foci per prometaphase cell. (E) Quantification of the number of FANCD2 foci per prometaphase cell. Statistics for (D–E) were calculated as described above for Figure 3.
Figure 4.
Figure 4.. TRAIP is required to process sites of incomplete DNA replication and preserve genome integrity in response to DNA replication stress in human cells.
(A) U2OS control cells and those expressing wild type TRAIP were treated as described in Figure 3B, except that cells were re-seeded onto plates for 15 min after mitotic shake-off, before detection of DAPI-positive DNA bridges in anaphase cells (white arrow denotes bridge - the data are quantified in the right-hand panel). (B) As per (A), except that ultra-fine DNA bridges were monitored by immunofluorescence detection of the PICH ATPase. Chromosomal DNA was detected by DAPI-staining. Note that the ultra-fine bridges are DAPI-negative. A quantification of the data is presented in the right-hand panel. (C) An analogous experiment to those above was performed, except that cells were re-seeded for 2.5 hr before detection of the 53BP1 protein by immunofluorescence in newly-born G1 cells. The number of 53BP1 bodies per G1-phase cell is quantified in the right-hand panel. (D) As per (C), except the number of micronuclei per G1-phase cell (indicated by white arrows) was determined by DAPI-staining. Statistics presented in this figure were calculated as described above for Figure 3. The scale bars correspond to 2 µm.

Similar articles

Cited by

References

    1. Al Mamun M, Albergante L, Moreno A, Carrington JT, Blow JJ, Newman TJ. Inevitability and containment of replication errors for eukaryotic genome lengths spanning megabase to gigabase. PNAS. 2016;113:E5765–E5774. doi: 10.1073/pnas.1603241113. - DOI - PMC - PubMed
    1. Bhowmick R, Minocherhomji S, Hickson ID. RAD52 facilitates mitotic DNA synthesis following replication stress. Molecular Cell. 2016;64:1117–1126. doi: 10.1016/j.molcel.2016.10.037. - DOI - PubMed
    1. Bhowmick R, Hickson ID. The "enemies within": regions of the genome that are inherently difficult to replicate. F1000Research. 2017;6:666. doi: 10.12688/f1000research.11024.1. - DOI - PMC - PubMed
    1. Brauchle M, Baumer K, Gönczy P. Differential activation of the DNA replication checkpoint contributes to asynchrony of cell division in C. elegans embryos. Current Biology. 2003;13:819–827. doi: 10.1016/S0960-9822(03)00295-1. - DOI - PubMed
    1. Brenner S. The genetics of Caenorhabditis elegans. Genetics. 1974;77:71–94. - PMC - PubMed

Publication types

Substances