

Analysis of Computed Tomography Radiation Doses Used for Lung Cancer Screening Scans
- PMID: 31545340
- PMCID: PMC6764003
- DOI: 10.1001/jamainternmed.2019.3893
Analysis of Computed Tomography Radiation Doses Used for Lung Cancer Screening Scans
Abstract
Importance: The American College of Radiology (ACR) has recognized the importance of minimizing radiation doses used for lung cancer screening (LCS) computed tomography (CT). However, without standard protocols, doses could still be unnecessarily high, reducing screening margin of benefit.
Objective: To characterize LCS CT radiation doses and identify factors explaining variation.
Design, setting, and participants: We prospectively collected LCS examination dose metrics, from 2016 to 2017, at US institutions in the University of California, San Francisco International Dose Registry. Institution-level factors were collected through baseline survey. Mixed-effects linear and logistic regression models were estimated using forward variable selection. Results are presented as percentage excess dose and odds ratios (ORs) with 95% confidence intervals (CIs). The analysis was conducted between 2018 and 2019.
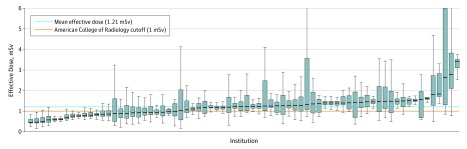
Main outcomes and measures: Log-transformed measures of (1) mean volume CT dose index (CTDIvol, mGy), reflecting the average radiation dose per slice; (2) mean effective dose (ED, mSv), reflecting the total dose received and estimated future cancer risk; (3) proportion of CT scans using radiation doses above ACR benchmarks (CTDIvol >3 mGy, ED >1 mSv); and (4) proportion of CT scans using radiation doses above 75th percentile of registry doses (CTDIvol >2.7 mGy, ED >1.4 mSv).
Results: Data were collected for 12 529 patients undergoing LCS CT scans performed at 72 institutions. Overall, 7232 participants (58%) were men, and the median age was 65 years (interquartile range [IQR], 60-70). Of 72 institutions, 15 (21%) had median CTDIvol and 47 (65%) had median ED above ACR guidelines. Institutions allowing any radiologists to establish protocols had 44% higher mean CTDIvol (mean dose difference [MDD], 44%; 95% CI, 19%-69%) and 27% higher mean ED (MDD, 27%; 95% CI, 5%-50%) vs those limiting who established protocols. Institutions allowing any radiologist to establish protocols had higher odds of examinations exceeding ACR CTDIvol guidelines (OR, 12.0; 95% CI, 2.0-71.4), and 75th percentile of registry CTDIvol (OR, 19.0; 95% CI, 1.9-186.7) or ED (OR, 8.5; 95% CI, 1.7-42.9). Having lead radiologists establish protocols resulted in lower odds of doses exceeding ACR ED guidelines (OR, 0.01; 95% CI, 0.001-0.1). Employing external vs internal medical physicists was associated with increased odds of exceeding ACR CTDIvol guidelines (OR, 6.1; 95% CI, 1.8-20.8). Having medical physicists establish protocols was associated with decreased odds of exceeding 75th percentile of registry CTDIvol (OR, 0.09; 95% CI, 0.01-0.59). Institutions reporting protocol updates as needed had 27% higher mean CTDIvol (MDD, 27%; 95% CI, 8%-45%).
Conclusions and relevance: Facilities varied in LCS CT radiation dose distributions. Institutions limiting protocol creation to lead radiologists and having internal medical physicists had lower doses.
Conflict of interest statement
Figures

Comment in
-
Effective Radiation Doses for Lung Cancer Screening Scans.JAMA Intern Med. 2020 Apr 1;180(4):611-612. doi: 10.1001/jamainternmed.2019.7425. JAMA Intern Med. 2020. PMID: 32250396 No abstract available.
-
Effective Radiation Doses for Lung Cancer Screening Scans-Reply.JAMA Intern Med. 2020 Apr 1;180(4):612. doi: 10.1001/jamainternmed.2019.7422. JAMA Intern Med. 2020. PMID: 32250402 No abstract available.
