

Design of a Volumetric Imaging Sequence Using a Vantage-256 Ultrasound Research Platform Multiplexed With a 1024-Element Fully Sampled Matrix Array
- PMID: 31545718
- PMCID: PMC7008949
- DOI: 10.1109/TUFFC.2019.2942557
Design of a Volumetric Imaging Sequence Using a Vantage-256 Ultrasound Research Platform Multiplexed With a 1024-Element Fully Sampled Matrix Array
Abstract
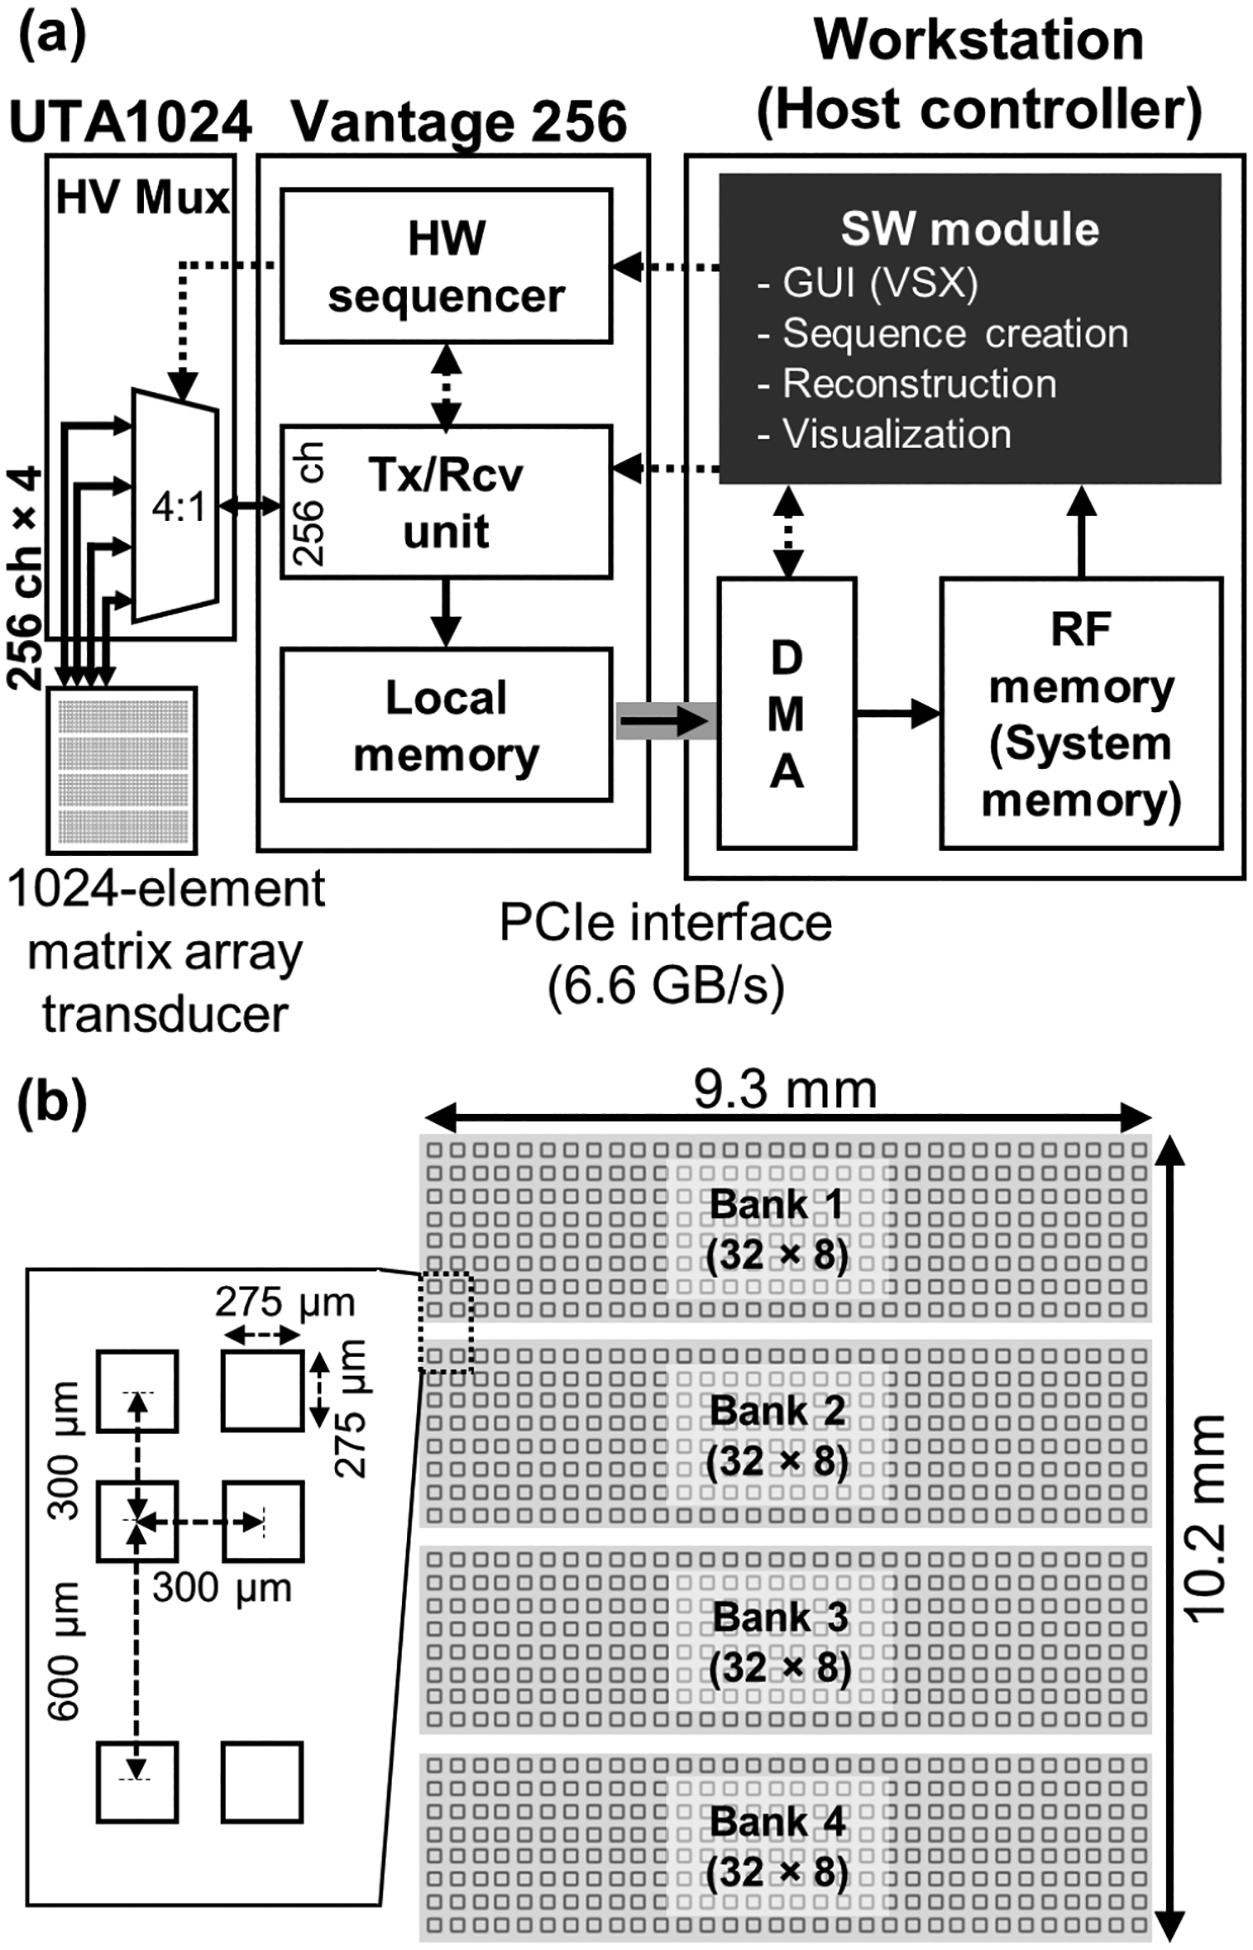
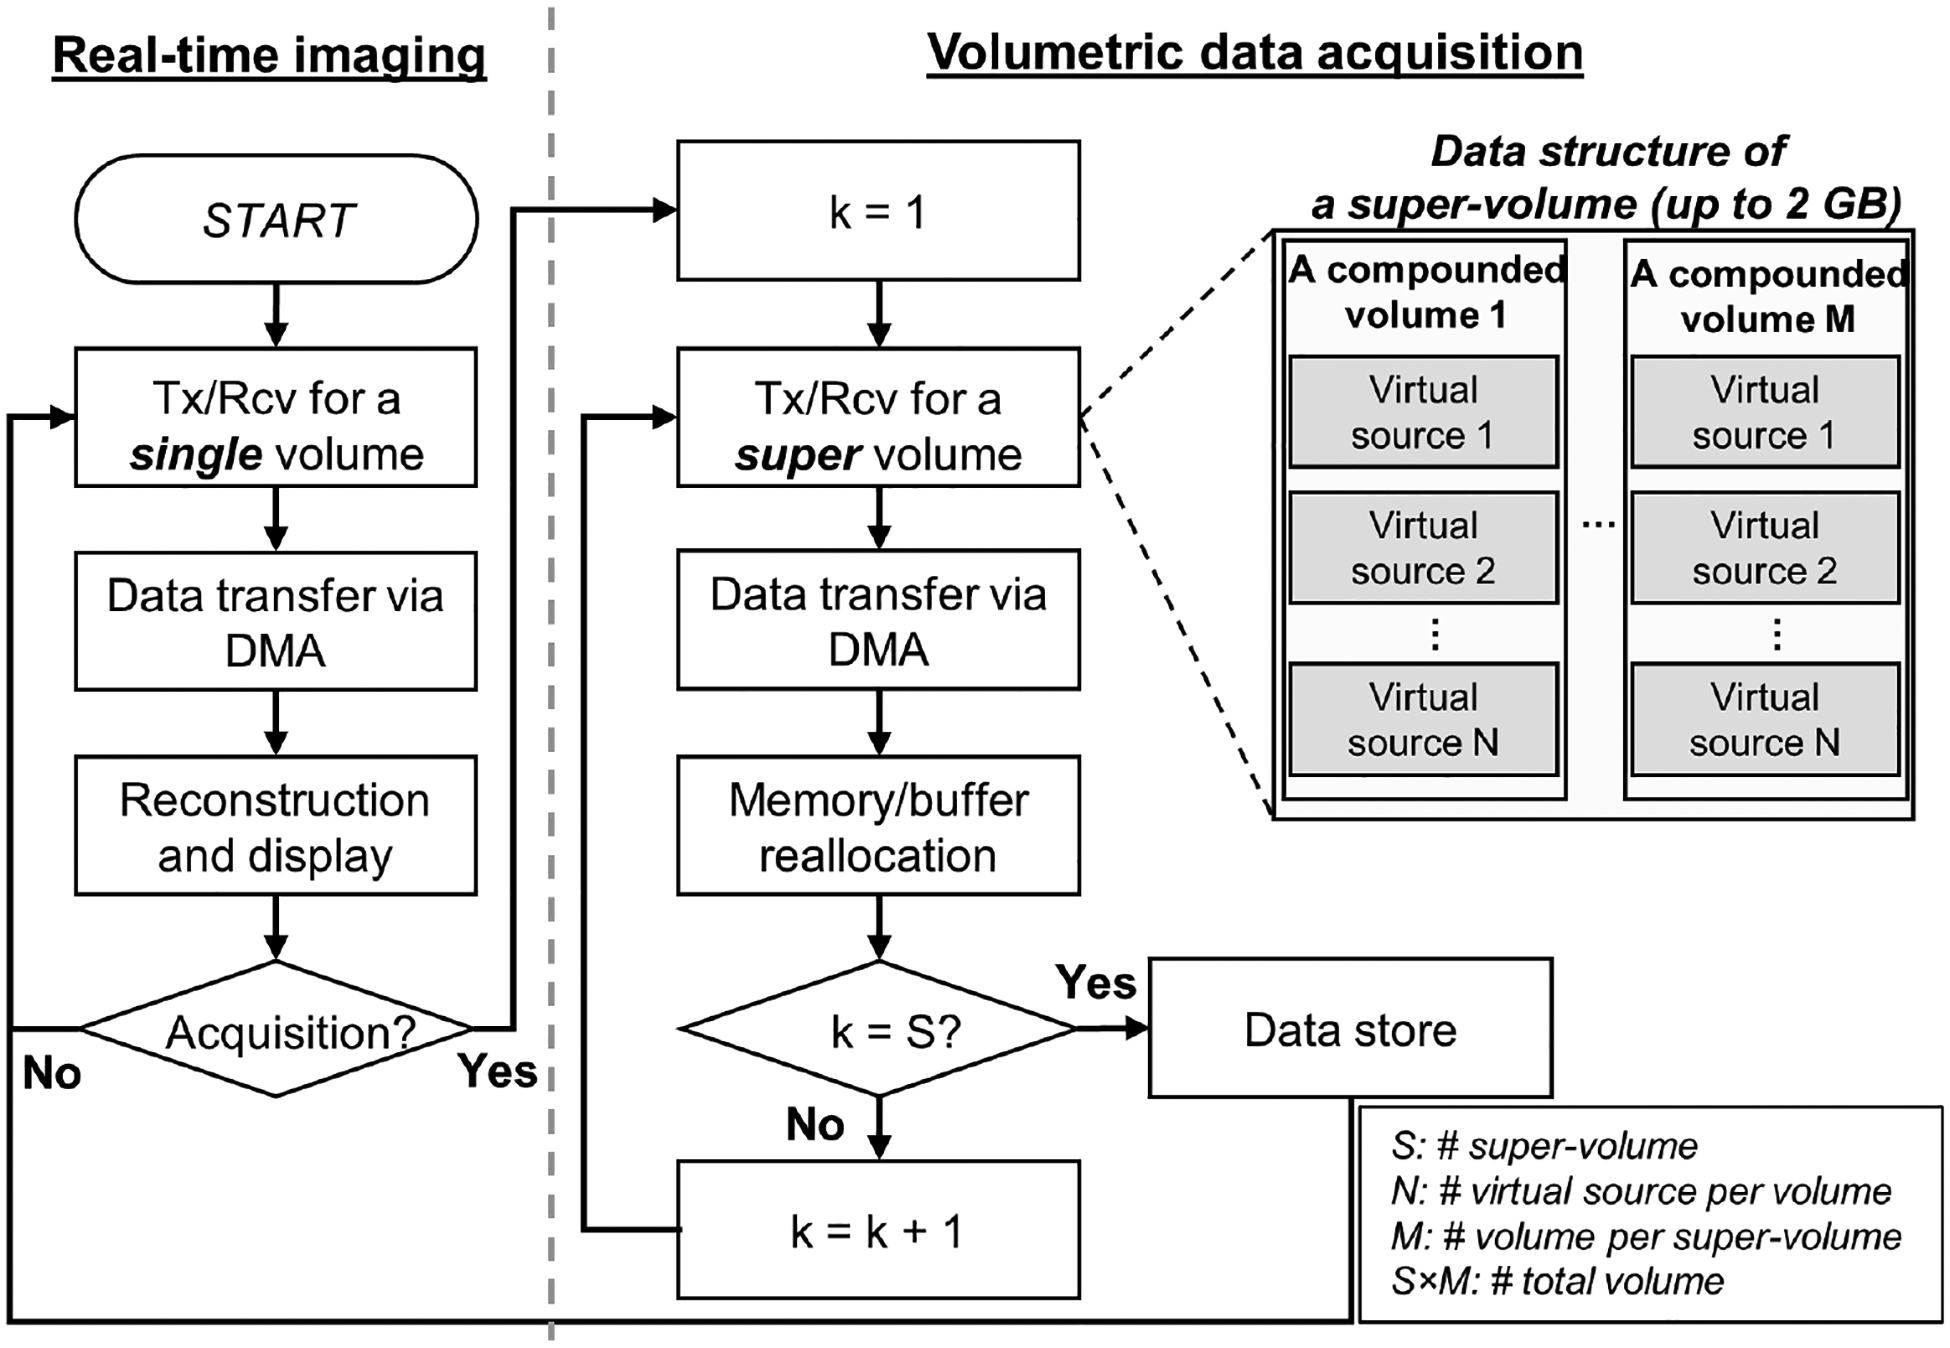
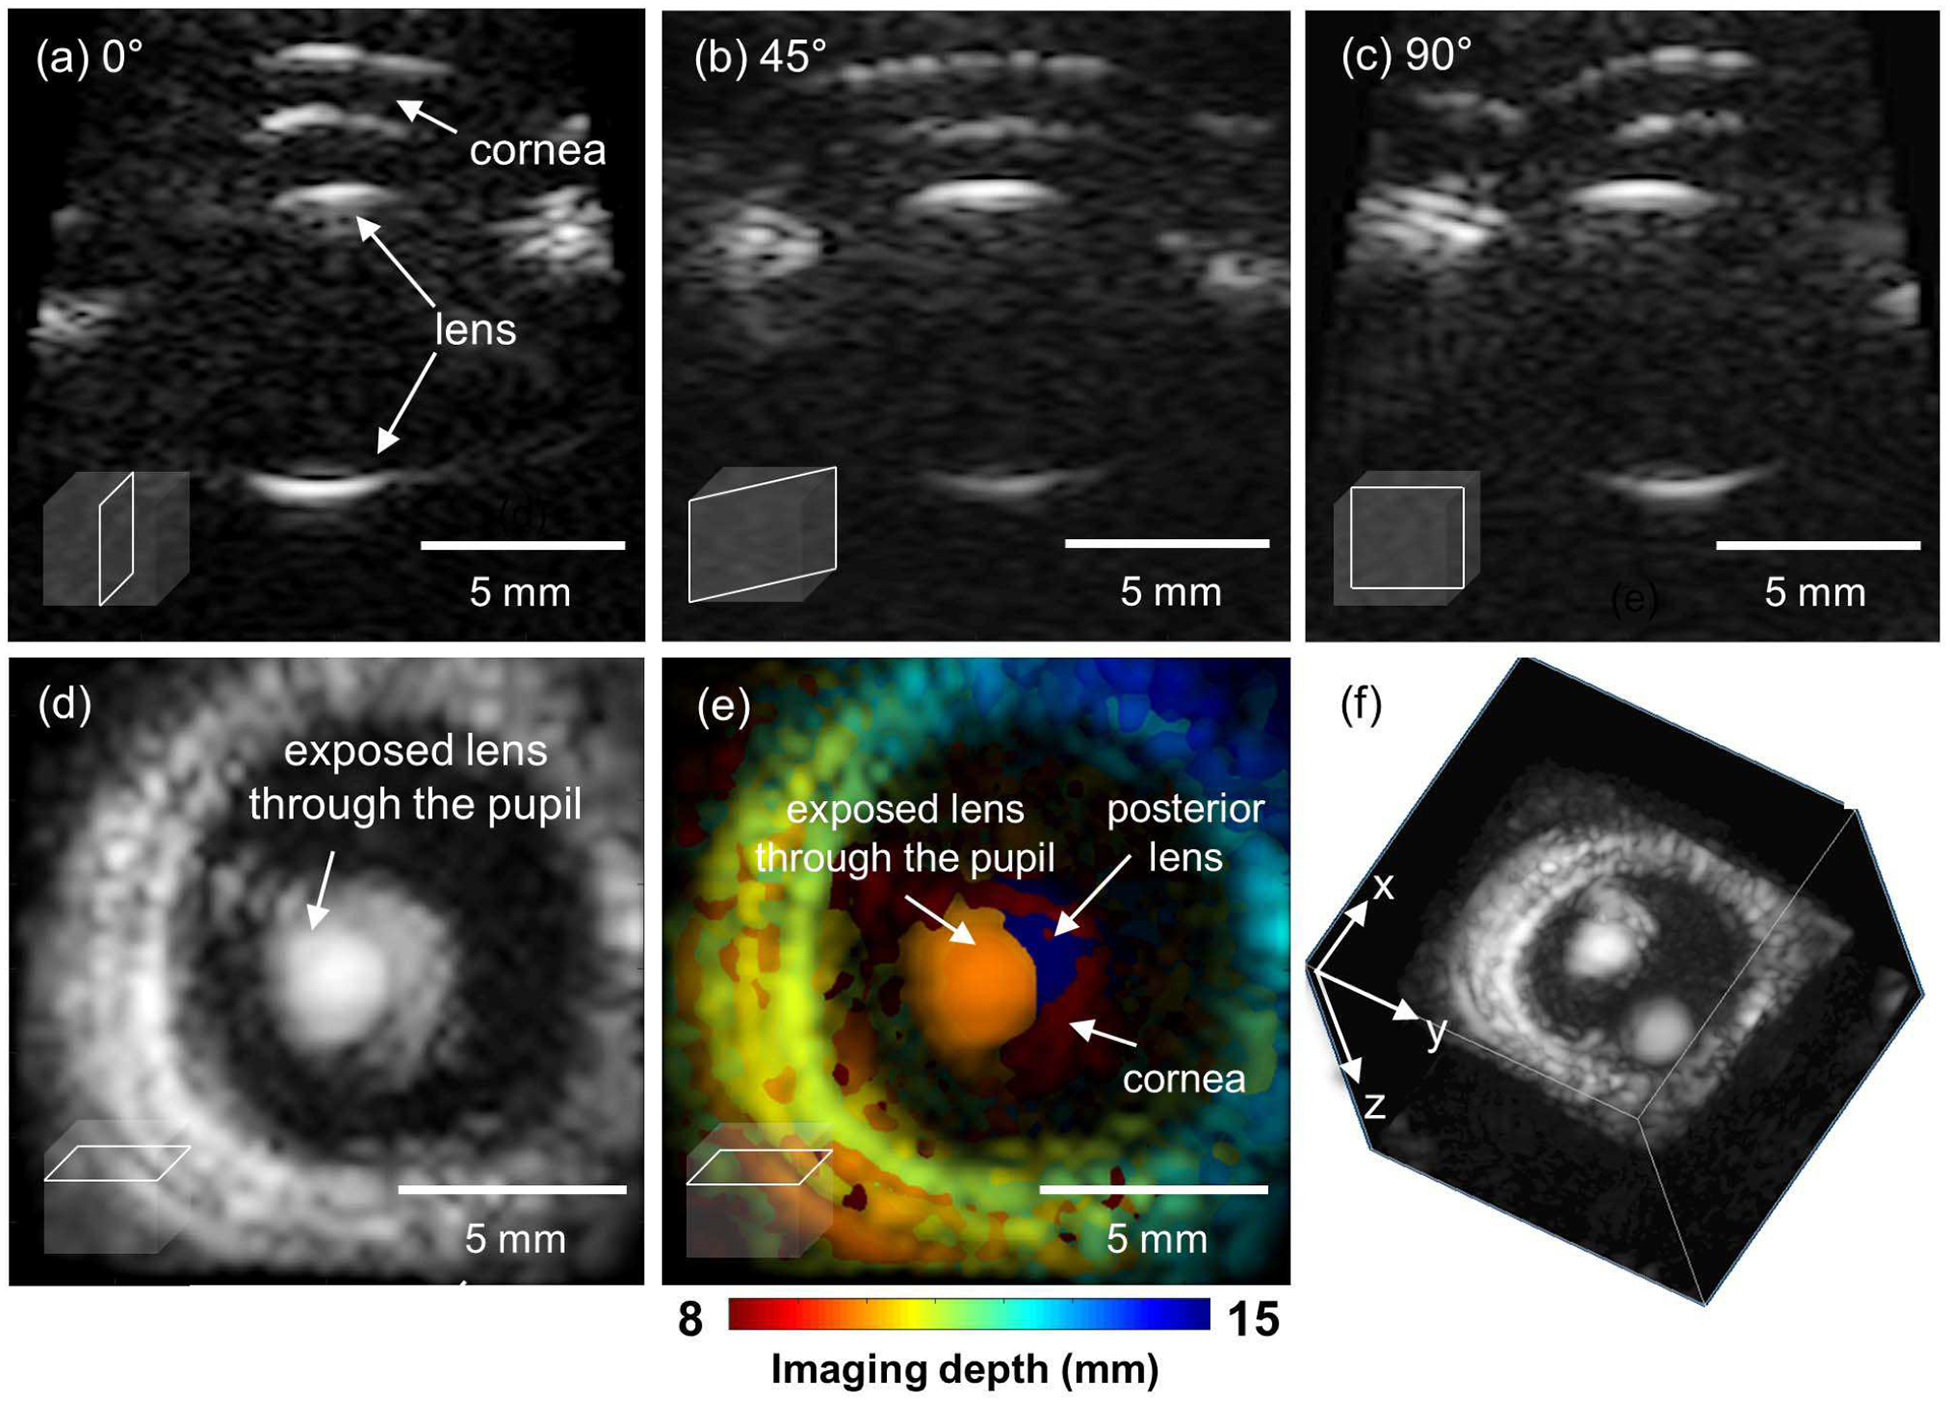
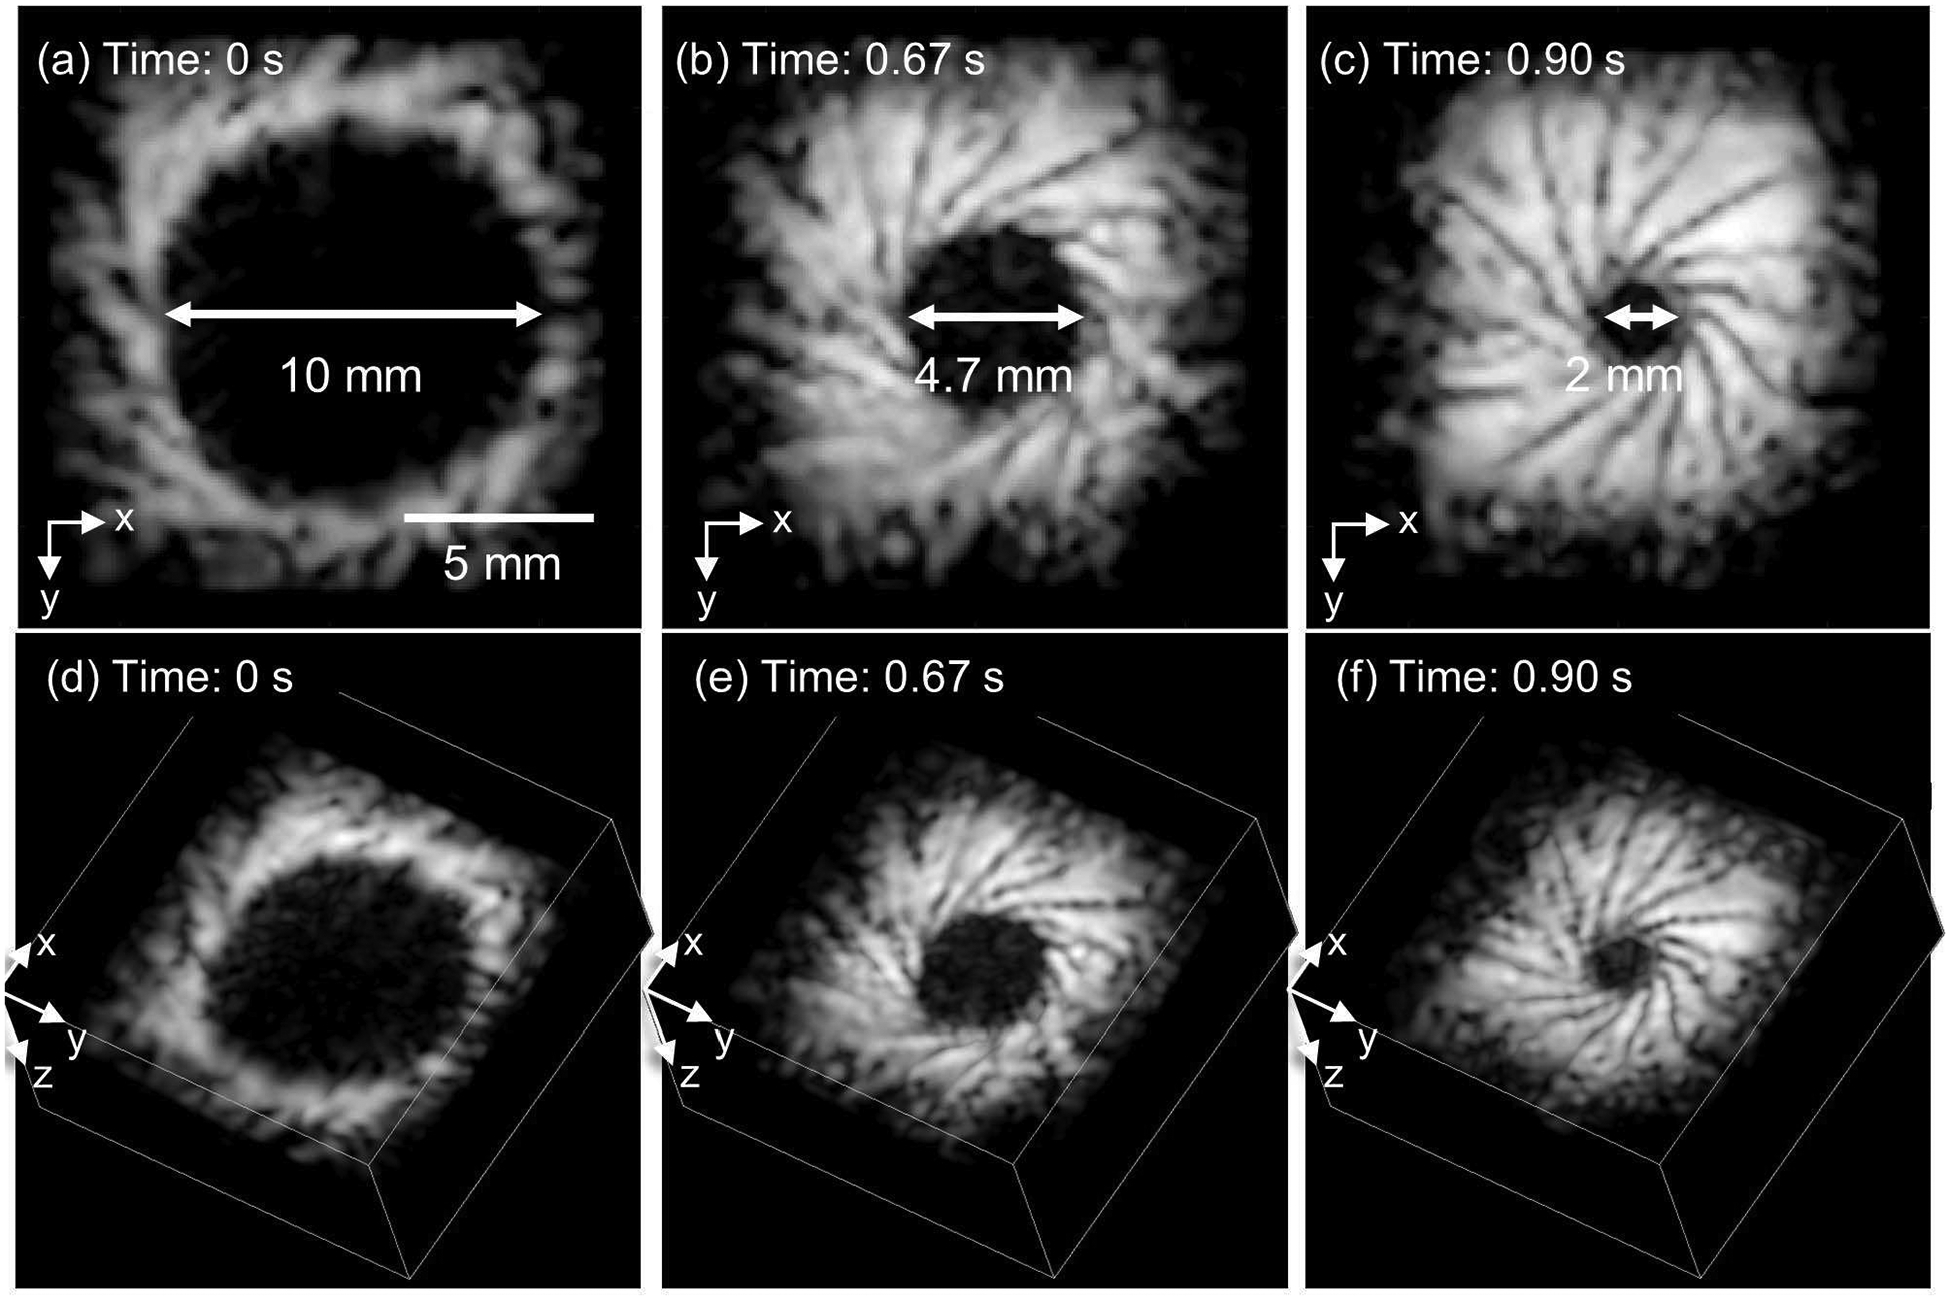
Ultrasound imaging using a matrix array allows real-time multi-planar volumetric imaging. To enhance image quality, the matrix array should provide fast volumetric ultrasound imaging with spatially consistent focusing in the lateral and elevational directions. However, because of the significantly increased data size, dealing with massive and continuous data acquisition is a significant challenge. We have designed an imaging acquisition sequence that handles volumetric data efficiently using a single 256-channel Verasonics ultrasound research platform multiplexed with a 1024-element matrix array. The developed sequence has been applied for building an ultrasonic pupilometer. Our results demonstrate the capability of the developed approach for structural visualization of an ex vivo porcine eye and the temporal response of the modeled eye pupil with moving iris at the volume rate of 30 Hz. Our study provides a fundamental ground for researchers to establish their own volumetric ultrasound imaging platform and could stimulate the development of new volumetric ultrasound approaches and applications.
Figures
Similar articles
-
GPU-based real-time volumetric ultrasound image reconstruction for a ring array.IEEE Trans Med Imaging. 2013 Jul;32(7):1258-64. doi: 10.1109/TMI.2013.2253117. Epub 2013 Mar 18. IEEE Trans Med Imaging. 2013. PMID: 23529080 Free PMC article.
-
A flexible annular-array imaging platform for micro-ultrasound.IEEE Trans Ultrason Ferroelectr Freq Control. 2013 Jan;60(1):178-86. doi: 10.1109/TUFFC.2013.2548. IEEE Trans Ultrason Ferroelectr Freq Control. 2013. PMID: 23287923 Free PMC article.
-
Volumetric real-time imaging using a CMUT ring array.IEEE Trans Ultrason Ferroelectr Freq Control. 2012 Jun;59(6):1201-11. doi: 10.1109/TUFFC.2012.2310. IEEE Trans Ultrason Ferroelectr Freq Control. 2012. PMID: 22718870 Free PMC article.
-
Eco-Friendly Highly Sensitive Transducers Based on a New KNN-NTK-FM Lead-Free Piezoelectric Ceramic for High-Frequency Biomedical Ultrasonic Imaging Applications.IEEE Trans Biomed Eng. 2019 Jun;66(6):1580-1587. doi: 10.1109/TBME.2018.2876063. Epub 2018 Nov 19. IEEE Trans Biomed Eng. 2019. PMID: 30452346
-
A two-dimensional array for B-mode and volumetric imaging with multiplexed electrostrictive elements.Ultrason Imaging. 1997 Oct;19(4):235-50. doi: 10.1177/016173469701900401. Ultrason Imaging. 1997. PMID: 9651952
Cited by
-
3Din vivodose verification in prostate proton therapy with deep learning-based proton-acoustic imaging.Phys Med Biol. 2022 Oct 27;67(21):10.1088/1361-6560/ac9881. doi: 10.1088/1361-6560/ac9881. Phys Med Biol. 2022. PMID: 36206745 Free PMC article.
-
3-D H-scan ultrasound imaging of relative scatterer size using a matrix array transducer and sparse random aperture compounding.Comput Biol Med. 2022 Dec;151(Pt B):106316. doi: 10.1016/j.compbiomed.2022.106316. Epub 2022 Nov 17. Comput Biol Med. 2022. PMID: 36442278 Free PMC article.
-
Design and Implementation of Analog-Digital Hybrid Beamformers for Low-Complexity Ultrasound Systems: A Feasibility Study.Bioengineering (Basel). 2023 Dec 21;11(1):8. doi: 10.3390/bioengineering11010008. Bioengineering (Basel). 2023. PMID: 38275576 Free PMC article.
-
Current Development and Applications of Super-Resolution Ultrasound Imaging.Sensors (Basel). 2021 Apr 1;21(7):2417. doi: 10.3390/s21072417. Sensors (Basel). 2021. PMID: 33915779 Free PMC article. Review.
-
Synchronization of RF Data in Ultrasound Open Platforms (UOPs) for High-Accuracy and High-Resolution Photoacoustic Tomography Using the "Scissors" Programming Method.IEEE Trans Ultrason Ferroelectr Freq Control. 2022 Jun;69(6):1994-2000. doi: 10.1109/TUFFC.2022.3164371. Epub 2022 May 26. IEEE Trans Ultrason Ferroelectr Freq Control. 2022. PMID: 35377843 Free PMC article.
References
-
- Wilson SR, Gupta C, Eliasziw M, and Andrew A, “Volume imaging in the abdomen with ultrasound: How we do it,” Am. J. Roentgenol, vol. 193, no. 1, pp. 79–85, Jul. 2009. - PubMed
-
- Mozaffari MH and Lee W-S, “Freehand 3-D Ultrasound Imaging: A Systematic Review.,” Ultrasound Med. Biol, vol. 43, no. 10, pp. 2099–2124, Oct. 2017. - PubMed
-
- Mercier L, Langø T, Lindseth F, and Collins DL, “A review of calibration techniques for freehand 3-D ultrasound systems,” Ultrasound Med. Biol, vol. 31, no. 4, pp. 449–471, Apr. 2005. - PubMed
