

Impact of Outdoor Air Pollution on Indoor Air Quality in Low-Income Homes during Wildfire Seasons
- PMID: 31546585
- PMCID: PMC6801919
- DOI: 10.3390/ijerph16193535
Impact of Outdoor Air Pollution on Indoor Air Quality in Low-Income Homes during Wildfire Seasons
Abstract
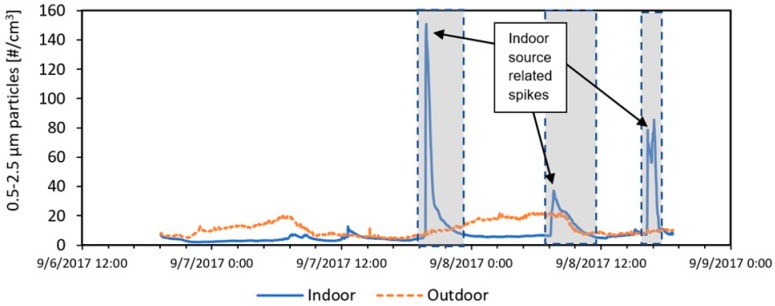
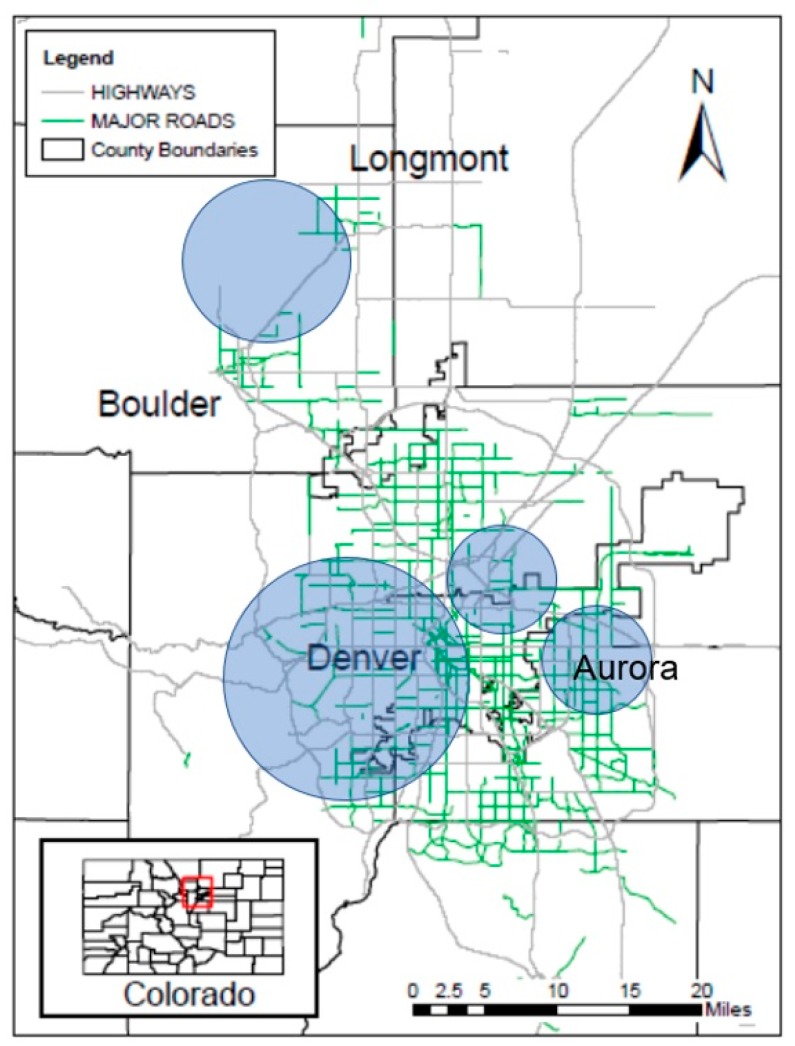
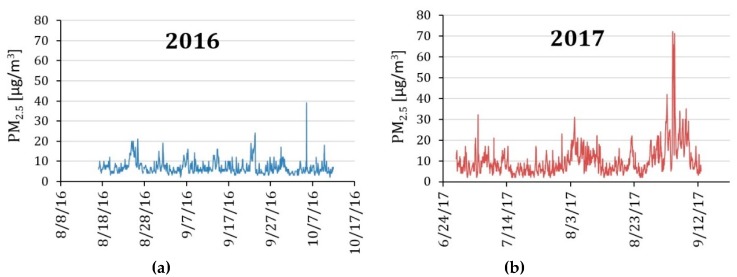
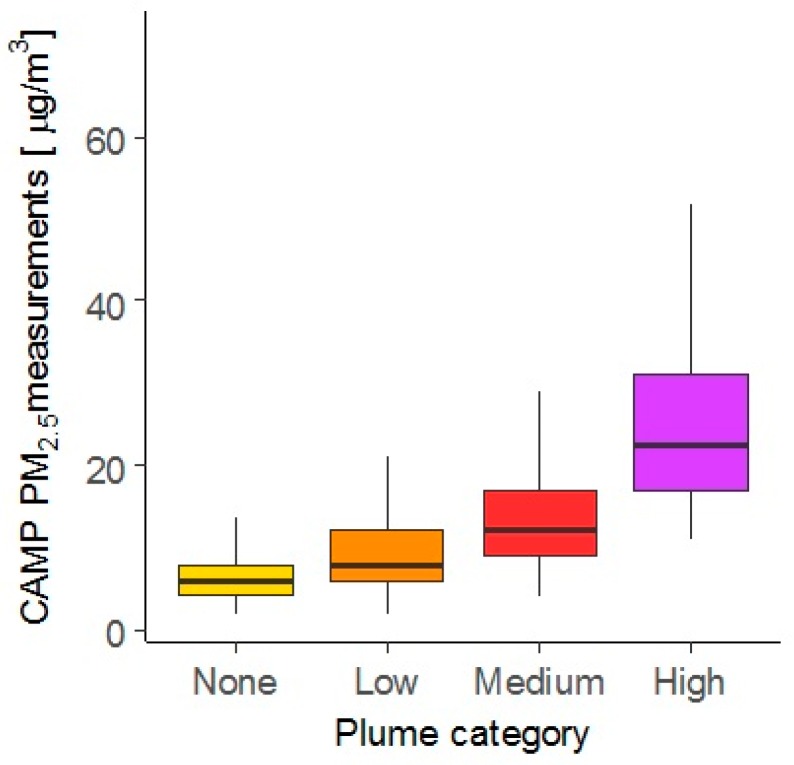
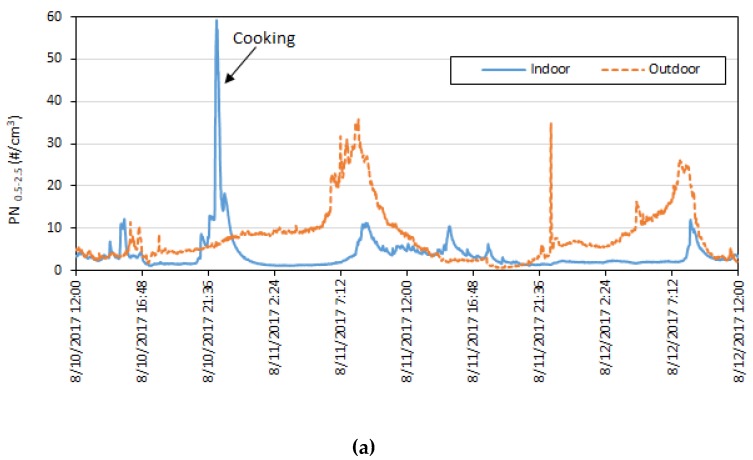
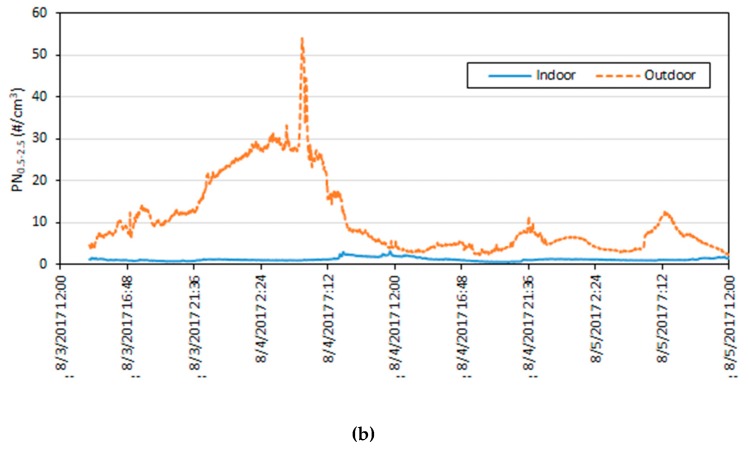
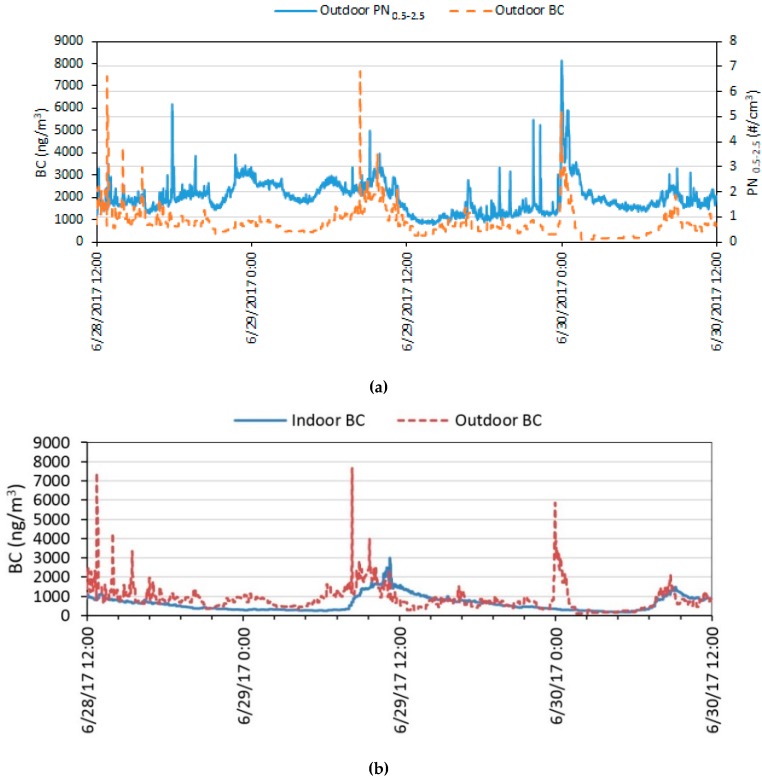
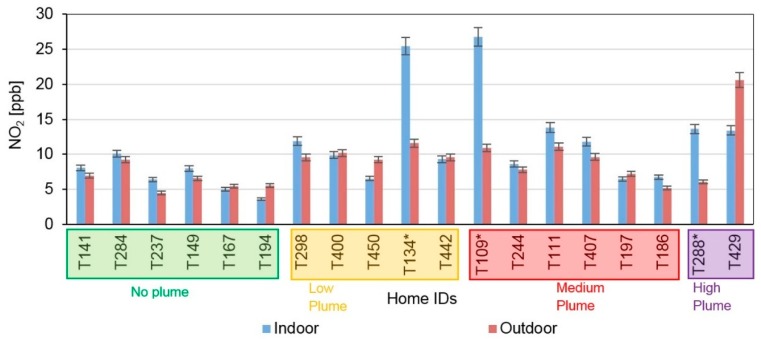
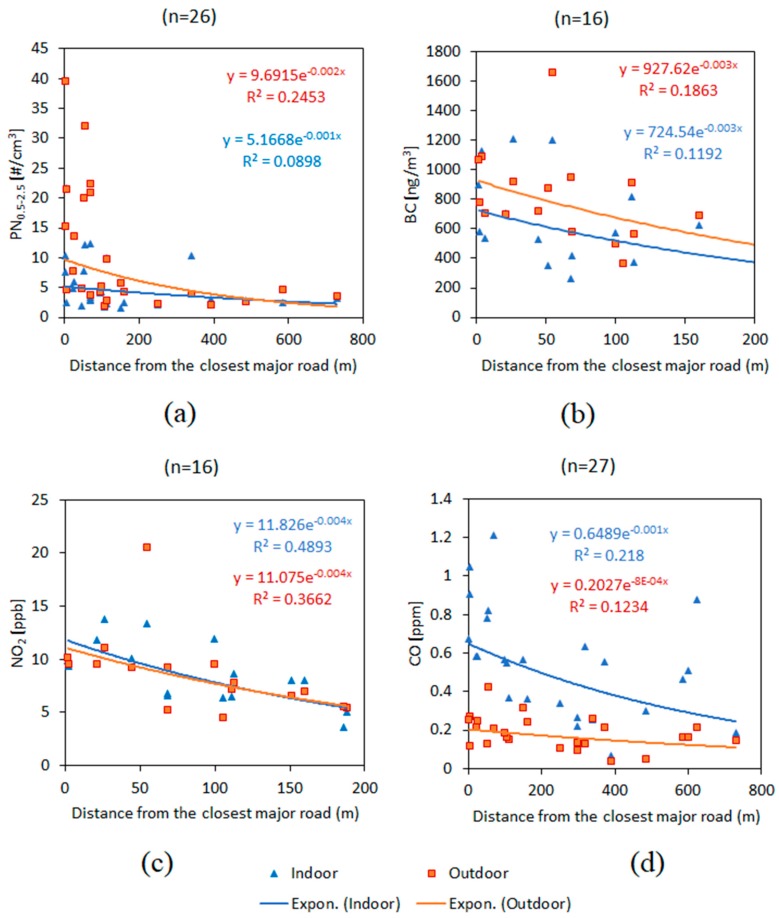
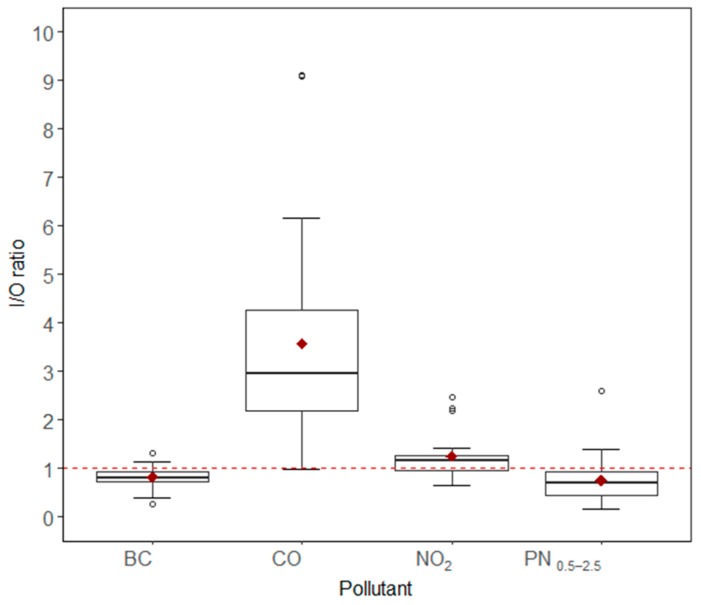
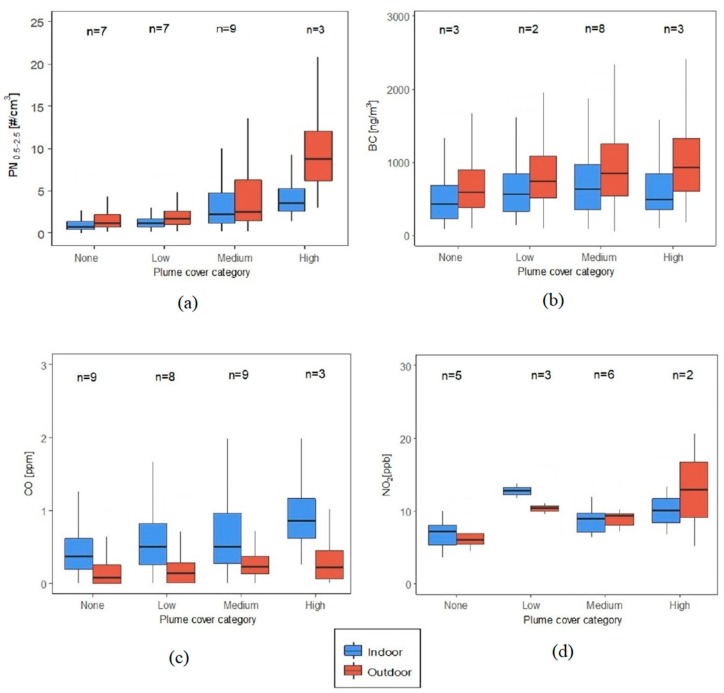
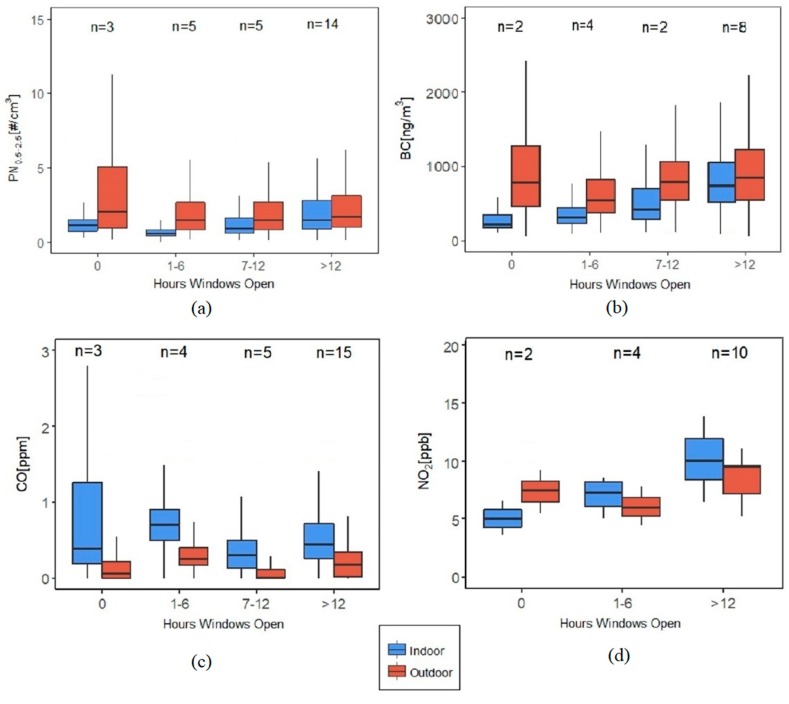
Indoor and outdoor number concentrations of fine particulate matter (PM2.5), black carbon (BC), carbon monoxide (CO), and nitrogen dioxide (NO2) were monitored continuously for two to seven days in 28 low-income homes in Denver, Colorado, during the 2016 and 2017 wildfire seasons. In the absence of indoor sources, all outdoor pollutant concentrations were higher than indoors except for CO. Results showed that long-range wildfire plumes elevated median indoor PM2.5 concentrations by up to 4.6 times higher than outdoors. BC, CO, and NO2 mass concentrations were higher indoors in homes closer to roadways compared to those further away. Four of the homes with mechanical ventilation systems had 18% higher indoor/outdoor (I/O) ratios of PM2.5 and 4% higher I/O ratios of BC compared to other homes. Homes with exhaust stove hoods had PM2.5 I/O ratios 49% less than the homes with recirculating hoods and 55% less than the homes with no stove hoods installed. Homes with windows open for more than 12 hours a day during sampling had indoor BC 2.4 times higher than homes with windows closed. This study provides evidence that long-range wildfire plumes, road proximity, and occupant behavior have a combined effect on indoor air quality in low-income homes.
Keywords: PM2.5; black carbon; energy efficiency; infiltration; low-cost sensors; traffic-related air pollution; wildfire smoke.
Conflict of interest statement
The authors declare no conflict of interest. The funders had no role in the design of the study; in the collection, analyses, or interpretation of data; in the writing of the manuscript, or in the decision to publish the results.
Figures
Similar articles
-
Evaluating heterogeneity in indoor and outdoor air pollution using land-use regression and constrained factor analysis.Res Rep Health Eff Inst. 2010 Dec;(152):5-80; discussion 81-91. Res Rep Health Eff Inst. 2010. PMID: 21409949
-
Association of Roadway Proximity with Indoor Air Pollution in a Peri-Urban Community in Lima, Peru.Int J Environ Res Public Health. 2015 Oct 26;12(10):13466-81. doi: 10.3390/ijerph121013466. Int J Environ Res Public Health. 2015. PMID: 26516875 Free PMC article.
-
Indoor air sampling for fine particulate matter and black carbon in industrial communities in Pittsburgh.Sci Total Environ. 2015 Dec 1;536:108-115. doi: 10.1016/j.scitotenv.2015.06.117. Epub 2015 Jul 21. Sci Total Environ. 2015. PMID: 26204046
-
Public health and components of particulate matter: the changing assessment of black carbon.J Air Waste Manag Assoc. 2014 Jun;64(6):620-60. doi: 10.1080/10962247.2014.912692. J Air Waste Manag Assoc. 2014. PMID: 25039199 Review.
-
The cost of clean air: Global disparities in reducing indoor wildfire-related PM2.5 exposure.Sci Adv. 2025 May 16;11(20):eady0890. doi: 10.1126/sciadv.ady0890. Epub 2025 May 14. Sci Adv. 2025. PMID: 40367168 Free PMC article. Review.
Cited by
-
Retrospective analysis of wildfire smoke exposure and birth weight outcomes in the San Francisco Bay Area of California.Environ Res Health. 2023 Jun 1;1(2):025009. doi: 10.1088/2752-5309/acd5f5. Epub 2023 Jun 13. Environ Res Health. 2023. PMID: 37324234 Free PMC article.
-
From Raising Awareness to a Behavioural Change: A Case Study of Indoor Air Quality Improvement Using IoT and COM-B Model.Sensors (Basel). 2023 Mar 30;23(7):3613. doi: 10.3390/s23073613. Sensors (Basel). 2023. PMID: 37050669 Free PMC article.
-
Social Vulnerability in US Communities Affected by Wildfire Smoke, 2011 to 2021.Am J Public Health. 2023 Jul;113(7):759-767. doi: 10.2105/AJPH.2023.307286. Am J Public Health. 2023. PMID: 37285572 Free PMC article.
-
Wildfire Smoke Adjustment Factors for Low-Cost and Professional PM2.5 Monitors with Optical Sensors.Sensors (Basel). 2020 Jun 30;20(13):3683. doi: 10.3390/s20133683. Sensors (Basel). 2020. PMID: 32630124 Free PMC article.
-
Adaptation Resources and Responses to Wildfire Smoke and Other Forms of Air Pollution in Low-Income Urban Settings: A Mixed-Methods Study.Int J Environ Res Public Health. 2023 Apr 4;20(7):5393. doi: 10.3390/ijerph20075393. Int J Environ Res Public Health. 2023. PMID: 37048007 Free PMC article.
References
-
- Klepeis N.E., Nelson W.C., Ott W.R., Robinson J.P., Tsang A.M., Switzer P., Behar J.V., Hern S.C., Engelmann W.H. The National Human Activity Pattern Survey (NHAPS): A resource for assessing exposure to environmental pollutants. J. Expo. Sci. Environ. Epidemiol. 2001;11:231–252. doi: 10.1038/sj.jea.7500165. - DOI - PubMed
-
- Jacob D.J., Winner D.A. Effect of climate change on air quality. Atmos. Environ. 2009;43:51–63. doi: 10.1016/j.atmosenv.2008.09.051. - DOI
-
- Melamed M.L., Schmale J., Von Schneidemesser E. Sustainable policy—Key considerations for air quality and climate change. Curr. Opin. Environ. Sustain. 2016;23:85–91. doi: 10.1016/j.cosust.2016.12.003. - DOI
-
- Lathière J., Hauglustaine D.A., De Noblet-Ducoudré N., Krinner G., Folberth G.A. Past and future changes in biogenic volatile organic compound emissions simulated with a global dynamic vegetation model. Geophys. Res. Lett. 2005;32 doi: 10.1029/2005GL024164. - DOI
Publication types
MeSH terms
Substances
LinkOut - more resources
Full Text Sources
Medical
