

Development of Teleost Intermuscular Bones Undergoing Intramembranous Ossification Based on Histological-Transcriptomic-Proteomic Data
- PMID: 31546739
- PMCID: PMC6801895
- DOI: 10.3390/ijms20194698
Development of Teleost Intermuscular Bones Undergoing Intramembranous Ossification Based on Histological-Transcriptomic-Proteomic Data
Abstract
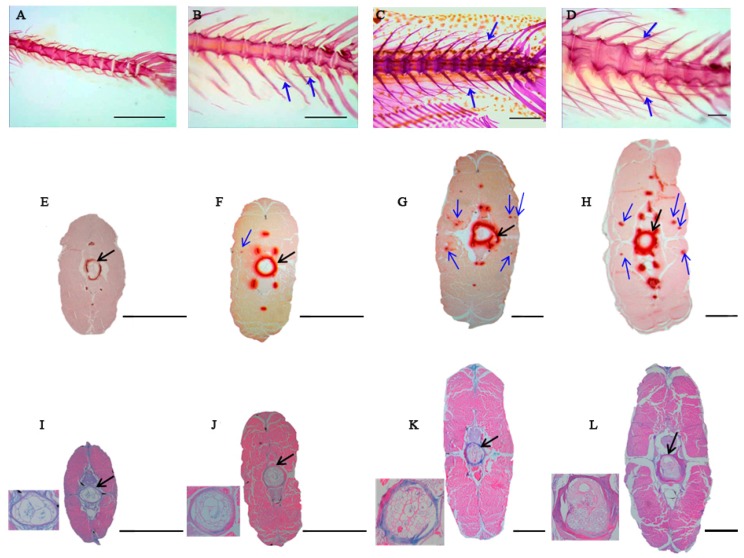
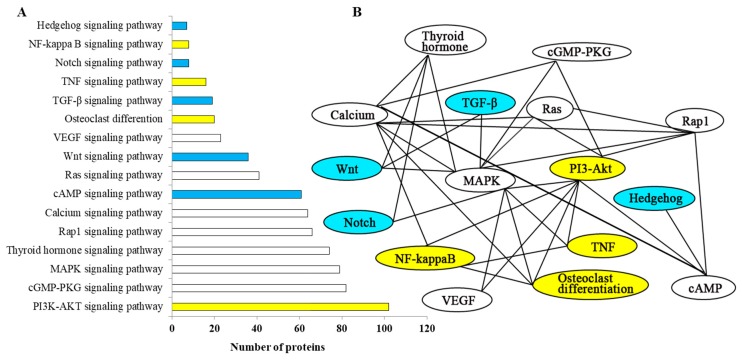
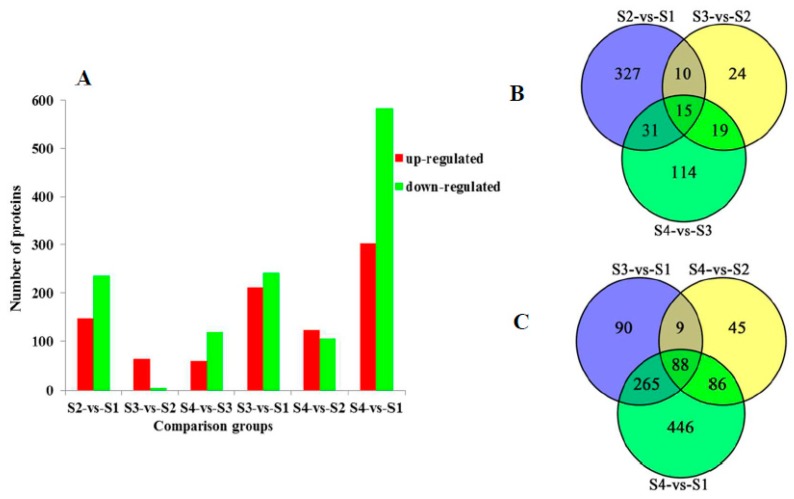
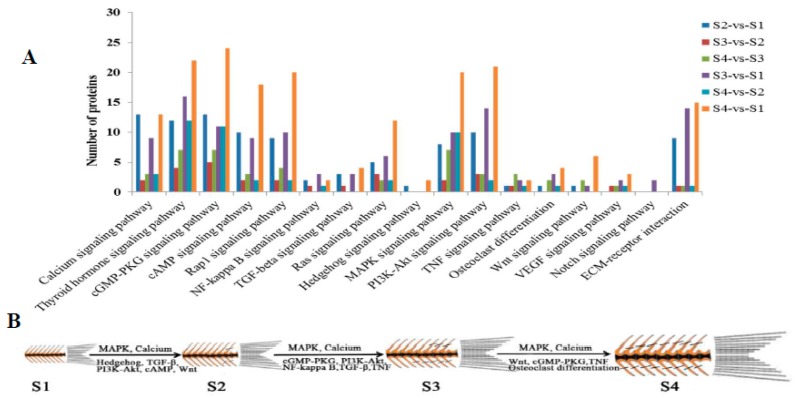
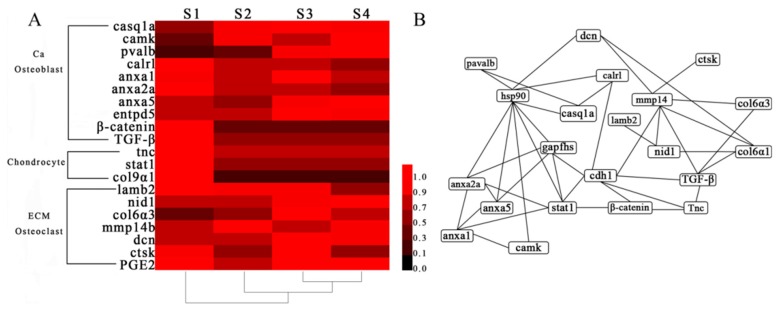
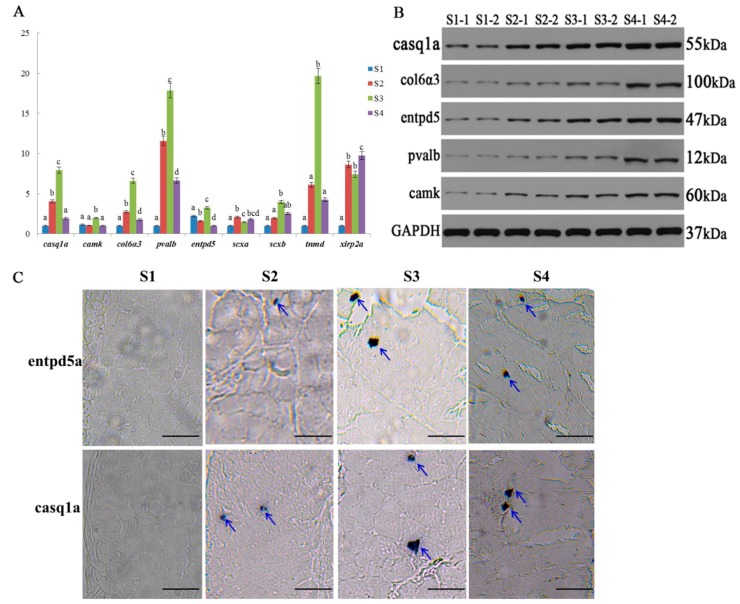
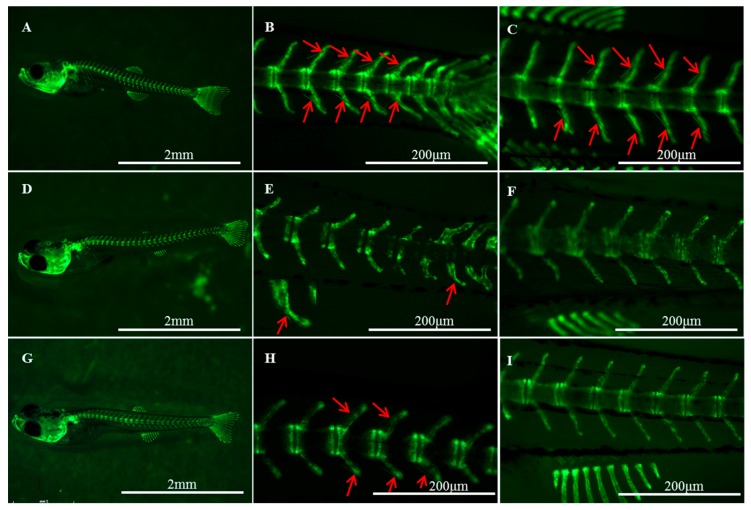
Intermuscular bones (IBs) specially exist in lower teleost fish and the molecular mechanism for its development remains to be clarified. In this study, different staining methods and comparative proteomics were conducted to investigate the histological structure and proteome of IB development in Megalobrama amblycephala, including four key IB developmental stages (S1-IBs have not emerged in the tail part; S2-several small IBs started to ossify in the tail part; S3-IBs appeared rapidly; S4-all the IBs appeared with mature morphology). Alcian blue and alizarin red S stained results indicated that IBs were gradually formed from S2 to S4, undergoing intramembranous ossification without a cartilaginous phase. A total of 3368 proteins were identified by using the isobaric tags for relative and absolute quantitation (iTRAQ) approach. Functional annotation showed that proteins which were differentially expressed among stages were involved in calcium, MAPK, Wnt, TGF-β, and osteoclast pathways which played a critical role in bone formation and differentiation. Three proteins (collagen9α1, stat1, tnc) associated with chondrocytes did not exhibit significant changes through S2 to S4; however, proteins (entpd5, casq1a, pvalb, anxa2a, anxa5) which associated with osteoblasts and bone formation and differentiation showed significantly a higher expression level from S1 to S2, as well as to S3 and S4. These further demonstrated that development of IBs did not go through a cartilaginous phase. The inhibitors of TGF-β and Wnt pathways were tested on zebrafish (sp7/eGFP) and the results indicated that both inhibitors significantly delayed IB development. This study provides a comprehensive understanding of the IB ossification pattern, which will help further elucidate the molecular mechanisms for IB development in teleosts.
Keywords: genes expression; histological structure; intermuscular bone; ossification process; teleost.
Conflict of interest statement
The authors declare no conflict of interest.
Figures
Similar articles
-
Molecular mechanisms of intermuscular bone development in fish: a review.Zool Res. 2021 May 18;42(3):362-376. doi: 10.24272/j.issn.2095-8137.2021.044. Zool Res. 2021. PMID: 33998184 Free PMC article. Review.
-
Comparative proteomics analysis of teleost intermuscular bones and ribs provides insight into their development.BMC Genomics. 2017 Feb 10;18(1):147. doi: 10.1186/s12864-017-3530-z. BMC Genomics. 2017. PMID: 28183283 Free PMC article.
-
Genome-wide analysis of intermuscular bone development reveals changes of key genes expression and signaling pathways in blunt snout bream (Megalobrama amblycephala).Genomics. 2021 Jan;113(1 Pt 2):654-663. doi: 10.1016/j.ygeno.2020.09.062. Epub 2020 Oct 1. Genomics. 2021. PMID: 33011328
-
Transcriptomic analysis of intermuscular bone development in barbel steed (Hemibarbus labeo).Comp Biochem Physiol Part D Genomics Proteomics. 2022 Dec;44:101030. doi: 10.1016/j.cbd.2022.101030. Epub 2022 Nov 2. Comp Biochem Physiol Part D Genomics Proteomics. 2022. PMID: 36343604
-
Single-cell transcriptomes and runx2b-/- mutants reveal the genetic signatures of intermuscular bone formation in zebrafish.Natl Sci Rev. 2022 Aug 2;9(11):nwac152. doi: 10.1093/nsr/nwac152. eCollection 2022 Nov. Natl Sci Rev. 2022. PMID: 36478733 Free PMC article. Review.
Cited by
-
Decoding the fish genome opens a new era in important trait research and molecular breeding in China.Sci China Life Sci. 2024 Oct;67(10):2064-2083. doi: 10.1007/s11427-023-2670-5. Epub 2024 Aug 12. Sci China Life Sci. 2024. PMID: 39145867 Review.
-
Histomorphometry of limb skeletogenesis in prehatched precocial embryos (Japanese quail and Cochin chicken) and altricial embryos (racing pigeons and cockatiel birds).Open Vet J. 2025 May;15(5):2138-2148. doi: 10.5455/OVJ.2025.v15.i5.32. Epub 2025 May 31. Open Vet J. 2025. PMID: 40557077 Free PMC article.
-
Molecular mechanisms of intermuscular bone development in fish: a review.Zool Res. 2021 May 18;42(3):362-376. doi: 10.24272/j.issn.2095-8137.2021.044. Zool Res. 2021. PMID: 33998184 Free PMC article. Review.
-
Dynamic mRNA and miRNA expression of the head during early development in bighead carp (Hypophthalmichthys nobilis).BMC Genomics. 2022 Mar 1;23(1):168. doi: 10.1186/s12864-022-08387-x. BMC Genomics. 2022. PMID: 35232381 Free PMC article.
-
Identification of hub genes and therapeutic drugs in osteonecrosis of the femoral head through integrated bioinformatics analysis and literature mining.Sci Rep. 2023 Jul 24;13(1):11972. doi: 10.1038/s41598-023-39258-4. Sci Rep. 2023. PMID: 37488209 Free PMC article.
References
-
- Patterson C., Johnson G.D. The intermuscular bones and ligaments of Teleostean Fishes. Smithsonian Contribution Zool Press; Washington, DC, USA: 1995.
-
- Danos N., Ward A.B. The homology and origins of intermuscular bones in fishes: Phylogenetic or biomechanical determinants? Biol. J. Linn. Soc. Lond. 2012;106:607–622. doi: 10.1111/j.1095-8312.2012.01893.x. - DOI
-
- Nie C.H., Hilsdorf A.W.S., Wan S.M., Gao Z.X. Understanding the development of intermuscular bones in teleost: Status and future directions for aquaculture. Rev. Aquacult. 2019 doi: 10.1111/raq.12348. - DOI
-
- Gemballa S., Britz R. Homology of intermuscular bones in Acanthomorph fishes. Am. Mus. Novit. 1998;3241:1–25.
-
- Bing Z. On the myoseptal spines of the carp (Cyprinus carpio L.) Acta Zool. Sin. 1962;14:175–178.
MeSH terms
Substances
Grants and funding
LinkOut - more resources
Full Text Sources
Molecular Biology Databases
Research Materials
Miscellaneous
