. 2019 Sep 19;11(9):2251.
doi: 10.3390/nu11092251.

Expression of Renin-Angiotensin System Components in the Taste Organ of Mice

Affiliations

Expression of Renin-Angiotensin System Components in the Taste Organ of Mice

Noriatsu Shigemura et al. Nutrients. .

Abstract

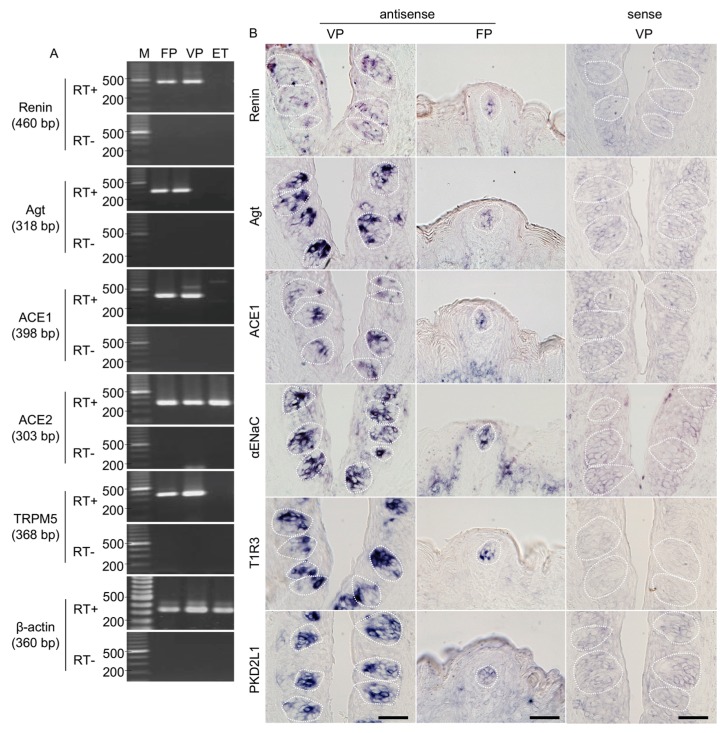
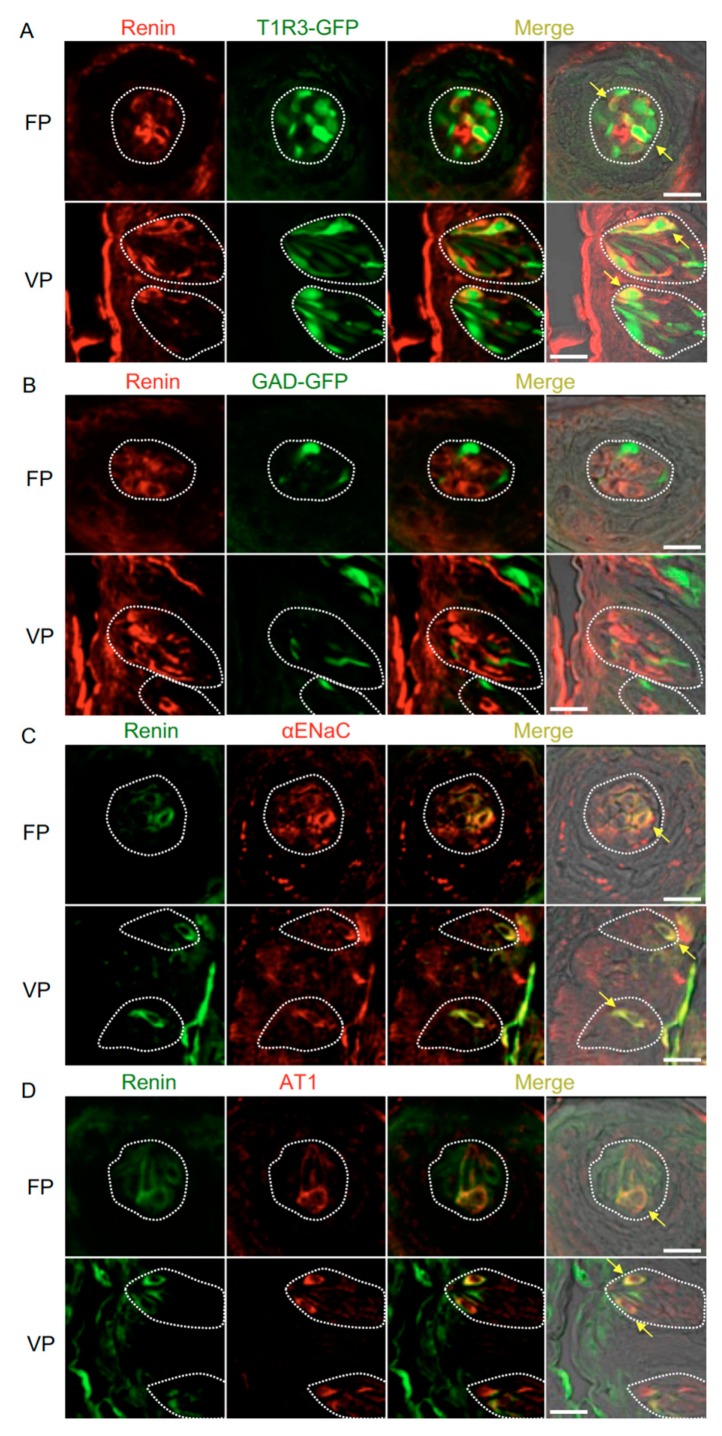
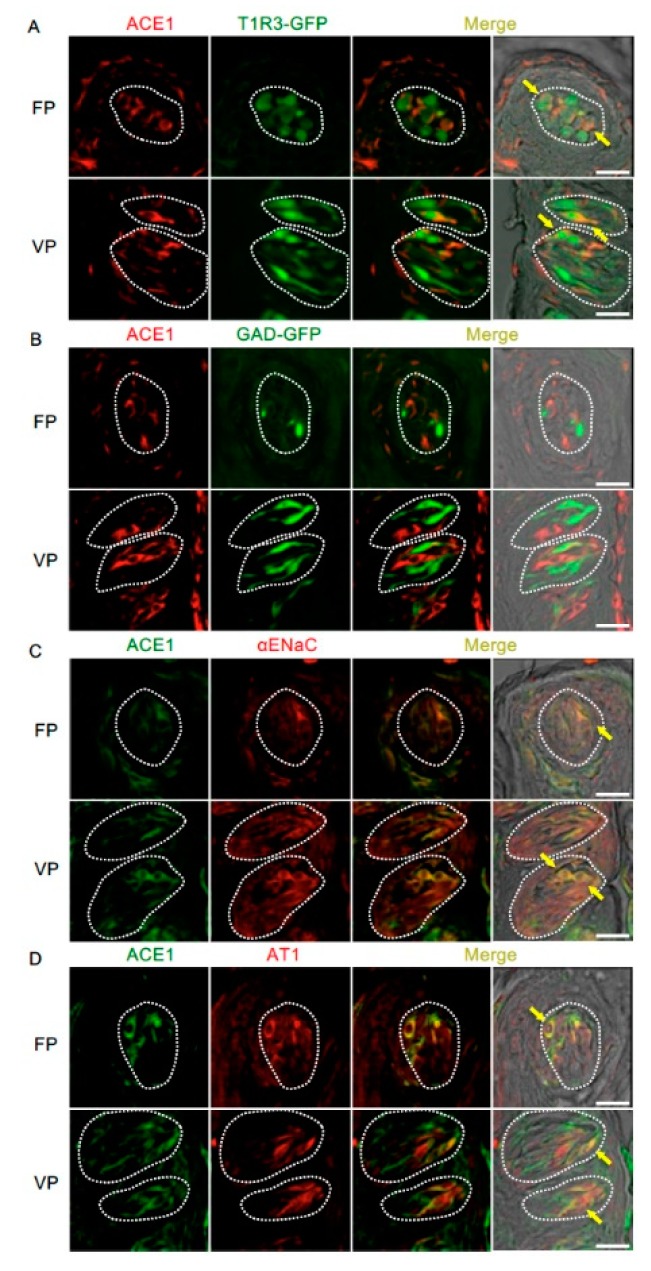
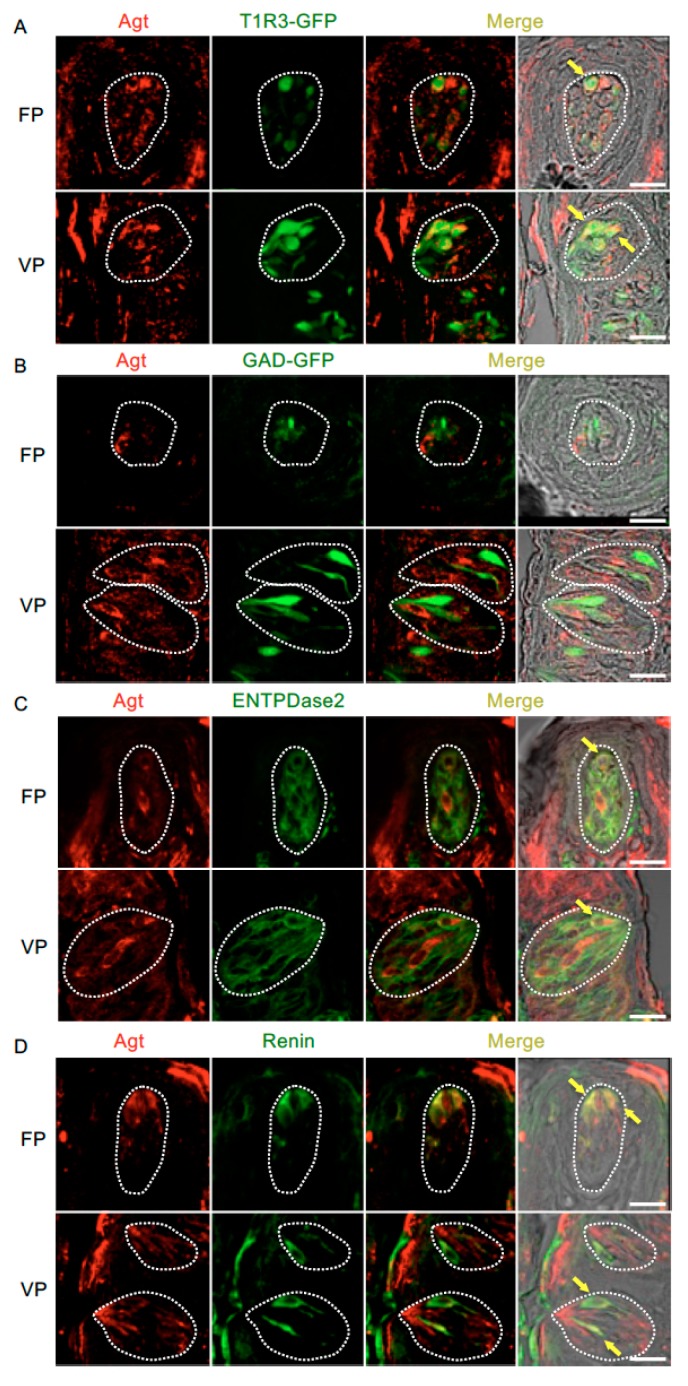
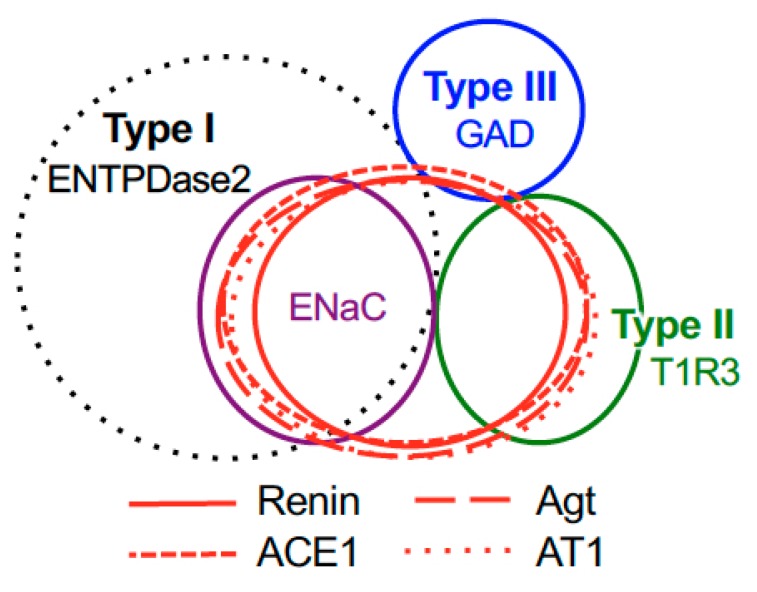
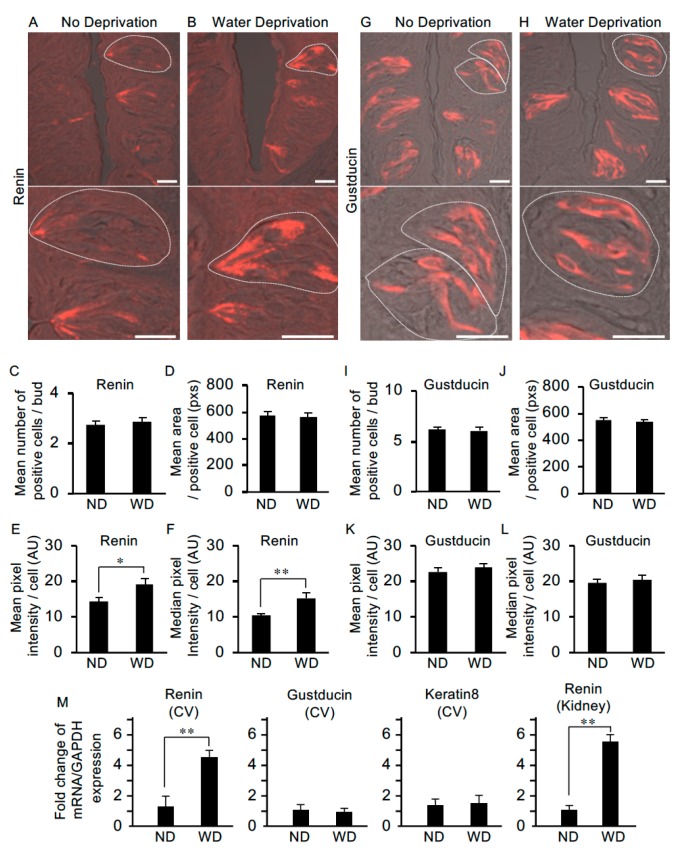
The systemic renin-angiotensin system (RAS) is an important regulator of body fluid and sodium homeostasis. Angiotensin II (AngII) is a key active product of the RAS. We previously revealed that circulating AngII suppresses amiloride-sensitive salt taste responses and enhances the responses to sweet compounds via the AngII type 1 receptor (AT1) expressed in taste cells. However, the molecular mechanisms underlying the modulation of taste function by AngII remain uncharacterized. Here we examined the expression of three RAS components, namely renin, angiotensinogen, and angiotensin-converting enzyme-1 (ACE1), in mouse taste tissues. We found that all three RAS components were present in the taste buds of fungiform and circumvallate papillae and co-expressed with αENaC (epithelial sodium channel α-subunit, a salt taste receptor) or T1R3 (taste receptor type 1 member 3, a sweet taste receptor component). Water-deprived mice exhibited significantly increased levels of renin expression in taste cells (p < 0.05). These results indicate the existence of a local RAS in the taste organ and suggest that taste function may be regulated by both locally-produced and circulating AngII. Such integrated modulation of peripheral taste sensitivity by AngII may play an important role in sodium/calorie homeostasis.

Keywords: angiotensin II; angiotensin-converting enzyme; angiotensinogen; renin; sodium taste; taste.


Conflict of interest statement

The authors declare no conflict of interest.

Figures

Figure 1
Figure 1
Renin, angiotensinogen (Agt) and angiotensin-converting enzyme-1 (ACE1) mRNAs are expressed in mouse taste bud cells. (A) Reverse transcription-polymerase chain reaction (RT-PCR) amplification of renin, Agt, ACE1, ACE2, transient receptor potential channel M5 (TRPM5), and β-actin mRNAs from fungiform papillae (FP), circumvallate papillae (VP), and tongue epithelium devoid of taste cells (ET). RT+ and RT− conditions are, respectively, with and without reverse transcriptase. M (bp): 100 bp marker ladder. (B) In situ hybridization detection of renin, Agt, ACE1, epithelial sodium channel α subunit (αENaC), taste receptor type 1 member 3 (T1R3), and polycystic kidney disease 2-like 1 (PKD2L1) in FP and VP of B6 mice. The sense probes served as a negative control. Dotted lines indicate the outlines of taste buds: scale bar, 50 μm.
Figure 2
Figure 2
Co-expression of renin with taste receptor family 1 member 3 (T1R3), glutamate decarboxylase 67 (GAD), epithelial sodium channel α subunit (αENaC) or angiotensin II type 1 receptor (AT1) in taste bud cells. (A) Expression of renin in fungiform papillae (FP) and circumvallate papillae (VP) of T1R3-green fluorescent protein (GFP) mice. (B) Expression of renin in FP and VP of GAD67-GFP mice. (C) Co-expression of renin with αENaC in FP and VP of B6 mice. (D) Co-expression of renin with AT1 in FP and VP of B6 mice. Immunostaining for renin is shown in red (A,B) or green (C,D). GFP fluorescence in T1R3-GFP and GAD67-GFP mice is shown in green (A,B). Immunostaining for αENaC and AT1 is shown in red (C,D). The last merge panels: Nomarski images were overlaid with immunofluorescence (or GFP) merge images. Arrows indicate renin-expressing taste cells that co-express T1R3, αENaC, or AT1. Dotted lines indicate the outlines of taste buds: scale bar, 25 μm.
Figure 3
Figure 3
Co-expression of angiotensin-converting enzyme-1 (ACE1) with taste receptor type 1 member 3 (T1R3), glutamate decarboxylase 67 (GAD), epithelial sodium channel α subunit (αENaC) or angiotensin II type 1 receptor (AT1) in taste bud cells. (A) Expression of ACE1 in fungiform papillae (FP) and circumvallate papillae (VP) of T1R3-green fluorescent protein (GFP) mice. (B) Expression of ACE1 in FP and VP of GAD67-GFP mice. (C) Co-expression of ACE1 with αENaC in FP and VP of B6 mice. (D) Co-expression of ACE1 with AT1 in FP and VP of B6 mice. Immunostaining for ACE1 is shown in red (A,B) or green (C,D). GFP fluorescence in T1R3-GFP and GAD67-GFP mice is shown in green (A,B). Immunostaining for αENaC and AT1 is shown in red (C,D). The last merge panels: Nomarski images were overlaid with immunofluorescence (or GFP) merge images. Arrows indicate ACE1-expressing taste cells that co-express T1R3, αENaC, or AT1. Dotted lines indicate the outlines of taste buds: scale bar, 25 μm.
Figure 4
Figure 4
Co-expression of angiotensinogen (Agt) with taste receptor type 1 member 3 (T1R3), glutamate decarboxylase 67 (GAD), nucleoside triphosphate diphosphohydrolase-2 (ENTPDase2) and renin in taste bud cells. (A) Expression of Agt in fungiform papillae (FP) and circumvallate papillae (VP) of T1R3-green fluorescent protein (GFP) mice. (B) Expression of Agt in FP and VP of GAD67-GFP mice. (C) Co-expression of Agt with ENTPDase2 in FP and VP of B6 mice. (D) Co-expression of Agt with renin in FP and VP of B6 mice. Immunostaining for Agt is shown in red. GFP fluorescence in T1R3-GFP and GAD67-GFP mice and immunostaining for ENTPDase2 and renin are shown in green. The last merge panels: Nomarski images were overlaid with immunofluorescence (or GFP) merge images. Arrows indicate Agt-expressing taste cells that co-express T1R3, ENTPDase2, or renin. Dotted lines indicate the outlines of taste buds: scale bar, 25 μm.
Figure 5
Figure 5
Summary of the patterns of co-expression between renin, angiotensinogen (Agt), angiotensin-converting enzyme-1 (ACE1), angiotensin II type 1 receptor (AT1) and type-specific markers of taste cells [nucleoside triphosphate diphosphohydrolase-2 (ENTPDase2) for cell type I, taste receptor type 1 member 3 (T1R3) for cell type II, and glutamate decarboxylase 67 (GAD) for cell type III] in both the fungiform and circumvallate papillae of mice.
Figure 6
Figure 6
The level of renin expression in taste cells is upregulated after water deprivation. (A) In non-deprived (control) mice, renin was expressed at the apical process regions of taste cells and more weakly in the cell body regions (lower image: higher magnification of the upper image). (B) In mice deprived of water for 47 h, renin expression was observed throughout some cells, i.e., from apical to basal regions. Water deprivation did not change the mean number of renin-positive cells per taste bud [n = 28 taste buds from three non-water deprived mice (ND), n = 27 taste buds from three water-deprived mice (WD)] (C) or the mean area of renin-positive cells (n = 28 taste cells from ND, n = 28 taste cells from WD) (pixels: pxs) (D). However, significant differences were detected in the mean pixel intensity (E) and median pixel intensity (F) of renin-positive cells (arbitrary unit: AU). Gustducin immunoreactivity was detected throughout positive cells from the apical to the basal regions in both non-water-deprived mice (G) and water-deprived mice (H). Water deprivation did not change the mean number of gustducin-positive cells per taste bud (n = 23 taste buds from ND, n = 23 taste buds from WD) (I), mean area of gustducin-positive cells (n = 32 taste cells from ND, n = 38 taste cells from WD) (pixels: pxs) (J), mean pixel intensity of gustducin-positive cells (K) or median pixel intensity (L) of gustducin-positive cells (arbitrary unit: AU). (M) Quantification of mRNA expression of renin, gustducin and keratin 8 by real-time PCR in the circumvallate taste papilla (CV) and Kidney (as the control tissue for renin expression) from ND and WD. Data were obtained from at least three independent experiments (n = 3–7 mice) per group each PCR assays were performed in triplicate. The quantitative PCR results were normalized using the ΔΔCt method with GAPDH (glyceraldehyde-3-phosphate dehydrogenase) in each sample as the reference, and shown as fold change of mRNA expression compared to ND. * p < 0.05, ** p < 0.01 for comparisons between ND and WD groups (Student’s t-test). All data are presented as the mean ± standard error of the mean. Dotted lines indicate the outlines of taste buds: scale bar, 25 μm.

References

    1. Fyhrquist F., Saijonmaa O. Renin-angiotensin system revisited. J. Intern. Med. 2008;264:224–236. doi: 10.1111/j.1365-2796.2008.01981.x. - DOI - PMC - PubMed
    1. Avrith D.B., Fitzsimons J.T. Increased sodium appetite in the rat induced by intracranial administration of components of the renin–angiotensin system. J. Physiol. 1980;301:349–364. doi: 10.1113/jphysiol.1980.sp013210. - DOI - PMC - PubMed
    1. Fitts D.A., Thunhorst R.L. Rapid elicitation of salt appetite by an intravenous infusion of angiotensin II in rats. Am. J. Physiol. 1996;270:R1092–R1098. doi: 10.1152/ajpregu.1996.270.5.R1092. - DOI - PubMed
    1. Shigemura N., Iwata S., Yasumatsu K., Ohkuri T., Horio N., Sanematsu K., Yoshida R., Margolskee R.F., Ninomiya Y. Angiotensin II modulates salty and sweet taste sensitivities. J. Neurosci. 2013;33:6267–6277. doi: 10.1523/JNEUROSCI.5599-12.2013. - DOI - PMC - PubMed
    1. Braun-Menéndez E., Fasciolo J.C., Leloir L.F., Munoz J.M. La sustancia hipertensora de la sangre del riñón isquemido. Rev. Soc. Argent. Biol. 1939;15:420–425.

MeSH terms