. 2019 Sep 19;10(9):727.
doi: 10.3390/genes10090727.

Forming Big Datasets through Latent Class Concatenation of Imperfectly Matched Databases Features

Affiliations

Forming Big Datasets through Latent Class Concatenation of Imperfectly Matched Databases Features

Christopher W Bartlett et al. Genes (Basel). .

Abstract

Informatics researchers often need to combine data from many different sources to increase statistical power and study subtle or complicated effects. Perfect overlap of measurements across academic studies is rare since virtually every dataset is collected for a unique purpose and without coordination across parties not-at-hand (i.e., informatics researchers in the future). Thus, incomplete concordance of measurements across datasets poses a major challenge for researchers seeking to combine public databases. In any given field, some measurements are fairly standard, but every organization collecting data makes unique decisions on instruments, protocols, and methods of processing the data. This typically denies literal concatenation of the raw data since constituent cohorts do not have the same measurements (i.e., columns of data). When measurements across datasets are similar prima facie, there is a desire to combine the data to increase power, but mixing non-identical measurements could greatly reduce the sensitivity of the downstream analysis. Here, we discuss a statistical method that is applicable when certain patterns of missing data are found; namely, it is possible to combine datasets that measure the same underlying constructs (or latent traits) when there is only partial overlap of measurements across the constituent datasets. Our method, ROSETTA empirically derives a set of common latent trait metrics for each related measurement domain using a novel variation of factor analysis to ensure equivalence across the constituent datasets. The advantage of combining datasets this way is the simplicity, statistical power, and modeling flexibility of a single joint analysis of all the data. Three simulation studies show the performance of ROSETTA on datasets with only partially overlapping measurements (i.e., systematically missing information), benchmarked to a condition of perfectly overlapped data (i.e., full information). The first study examined a range of correlations, while the second study was modeled after the observed correlations in a well-characterized clinical, behavioral cohort. Both studies consistently show significant correlations >0.94, often >0.96, indicating the robustness of the method and validating the general approach. The third study varied within and between domain correlations and compared ROSETTA to multiple imputation and meta-analysis as two commonly used methods that ostensibly solve the same data integration problem. We provide one alternative to meta-analysis and multiple imputation by developing a method that statistically equates similar but distinct manifest metrics into a set of empirically derived metrics that can be used for analysis across all datasets.

Keywords: data blending; data integration; data pools; databases; informatics.


Conflict of interest statement

The authors declare no conflict of interest.

Figures
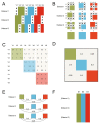
Figure 1
Figure 1
The ROSETTA flow of information. The method consists of three steps to get from the constituent datasets that are the input to ROSETTA in this example, to the final harmonized single output dataset. (A) The constituent datasets are concatenated and missing data is shown with an “X”. We assume the datasets are independent in terms of the rows; in biology, these are typically the different subjects that were measured. The columns are the nine measurements (V1-V9) that occurred across the three constituent datasets illustrated here. Importantly, no measurement was common to all three datasets, preventing a simple joint analysis on at least that one common measure, but the lack of complete overlap for any single measurement will not preclude using the Rosetta pipeline. We also applied color to show that the nine measurements come from three unique measurement domains. In the simulation study, we manipulate the strength of the correlations between the domains, but we expect that Rosetta is most useful when the domains have non-zero correlations. (B) The first step is to construct the pairwise correlation matrix for all measures across all datasets. In panel B, we show that logical intersections of the datasets allow for each domain to have a complete pairwise correlation matrix despite the pattern of missing data. (C) The same logic from panel B can be extended to show that the entire 9x9 matrix can be successfully estimated. The second step is to construct the geometry for the factor analysis using the 9x9 correlation matrix from step one (in panel C). The factor analysis provides a set of linear weights for combining the measurements into factor scores. (D) Importantly, the correlation between the factors will be used in the next step. (E) The third step is to apply the factor loadings and the correlations between the factors from the second step as a constraint for each constituent dataset (using the math from confirmatory factor analysis). Factor loadings are set equal to zero when a measure is not present in a given dataset, then the constraint on the correlations between the factors ensures equivalence of the factors between the datasets. While this third step is similar to the hypothesis testing of confirmatory factor analysis, where a model from one dataset is applied to a novel dataset, in ROSETTA the model was derived over all datasets and that same model is being used as a constraint when applied to each constituent dataset (i.e., Rosetta is not a hypothesis testing procedure). (F) The final result is a complete dataset of the domain factor scores for analysis. Rather than outputting nine variables (such as would occur with multiple imputation), Rosetta output three domain factor scores per subject (labeled D1–D3).
Figure 2
Figure 2
Study 1: Comparison of ROSETTA trait scores on incomplete data versus latent trait scores on complete data. We compared values of the latent traits from the full dataset condition (ground truth) on the x-axis to the incomplete matched datasets derived with ROSETTA on the y-axis.
Figure 3
Figure 3
Study 2: Data Modeled After a Clinical Behavioral Dataset, Comparison of ROSETTA scores versus scores from complete data. We compared values of the latent traits from the full dataset condition (ground truth) on the x-axis to the incomplete matched datasets derived with ROSETTA on the y-axis.
Figure 4
Figure 4
Study 3: Average –log(p-value) on the y-axis for Each Method by Within-Domain Correlation (panels) and Between-Domain Correlation (x-axis). Provided the within-domain correlation is >0.3 on average, ROSETTA shows a clear advantage for downstream analysis. When the within-domain correlation is 0.2 or less, the current implementation of ROSETTA runs into numerical issues and can no longer be applied.

Similar articles

Cited by

References

    1. Haidich A.B. Meta-analysis in medical research. Hippokratia. 2010;14:29–37. - PMC - PubMed
    1. Veugelers P.J., Ekwaru J.P. A statistical error in the estimation of the recommended dietary allowance for vitamin D. Nutrients. 2014;6:4472–4475. doi: 10.3390/nu6104472. - DOI - PMC - PubMed
    1. Schmitt T.A. Current methodological considerations in exploratory and confirmatory factor analysis. J. Psychoeduc. Assess. 2011;29:304–321. doi: 10.1177/0734282911406653. - DOI
    1. Higham N.J. Computing the nearest correlation matrix—A problem from finance. IMA J. Numer. Anal. 2002;22:329–343. doi: 10.1093/imanum/22.3.329. - DOI
    1. Bartlett C.W., Vieland V.J. Accumulating quantitative trait linkage evidence across multiple datasets using the posterior probability of linkage. Genet. Epidemiol. 2007;31:91–102. doi: 10.1002/gepi.20193. - DOI - PubMed

LinkOut - more resources