. 2019 Sep 20;8(10):1514.
doi: 10.3390/jcm8101514.

Brain-Immune Alterations and Mitochondrial Dysfunctions in a Mouse Model of Paediatric Autoimmune Disorder Associated with Streptococcus: Exacerbation by Chronic Psychosocial Stress

Affiliations

Brain-Immune Alterations and Mitochondrial Dysfunctions in a Mouse Model of Paediatric Autoimmune Disorder Associated with Streptococcus: Exacerbation by Chronic Psychosocial Stress

Maria Antonietta Ajmone-Cat et al. J Clin Med. .

Abstract

Adverse psychosocial experiences have been shown to modulate individual responses to immune challenges and affect mitochondrial functions. The aim of this study was to investigate inflammation and immune responses as well as mitochondrial bioenergetics in an experimental model of Paediatric Autoimmune Neuropsychiatric Disorders Associated with Streptococcus (PANDAS). Starting in adolescence (postnatal day 28), male SJL/J mice were exposed to five injections (interspaced by two weeks) with Group-A beta-haemolytic streptococcus (GAS) homogenate. Mice were exposed to chronic psychosocial stress, in the form of protracted visual exposure to an aggressive conspecific, for four weeks. Our results indicate that psychosocial stress exacerbated individual response to GAS administrations whereby mice exposed to both treatments exhibited altered cytokine and immune-related enzyme expression in the hippocampus and hypothalamus. Additionally, they showed impaired mitochondrial respiratory chain complexes IV and V, and reduced adenosine triphosphate (ATP) production by mitochondria and ATP content. These brain abnormalities, observed in GAS-Stress mice, were associated with blunted titers of plasma corticosterone. Present data support the hypothesis that challenging environmental conditions, in terms of chronic psychosocial stress, may exacerbate the long-term consequences of exposure to GAS processes through the promotion of central immunomodulatory and oxidative stress.

Keywords: Adverse emotional experience; Animal Models; Immunity; Mitochondrial bioenergetics; Neuroinflammation; PANDAS.


Conflict of interest statement

The authors declare no conflict of interest.

Figures

Figure 1
Figure 1
Timing of stress exposure and of the Group-A beta-haemolytic streptococcus (GAS) injections, expressed in weeks, and the experimental procedures performed. Mice (N = 9–10 per group) received 5 injections of GAS homogenate or Phosphate Buffer Saline (PBS), formulated with the indicated adjuvants (CFA = Complete Freund’s adjuvant; IFA = Incomplete Freund’s adjuvant). Serum samples were collected for antibody determination and corticosterone (CORT) concentration assessment; brain samples were collected for mRNA expression and mitochondrial analyses.
Figure 2
Figure 2
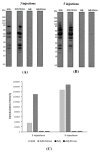
(A,B): Representative immunoblot of GAS extracts probed with pooled sera from mice either treated with 3 (A) or 5 doses (B) of GAS homogenate (GAS), GAS homogenate and psychosocial stress (GAS-Stress), adjuvant alone (Adj), or adjuvant and psychosocial stress (Adj-Stress). (C): Densitometric analysis of overall lane intensities from the blot shown in (A,B).
Figure 3
Figure 3
Glucocorticoid receptor (GR) mRNA expression in GAS-Stress mice and relative controls. RT-PCR were performed with mRNAs extracted from hypothalamus (A) and hippocampus (B) of control mice (PBS-no Stress), Group-A beta-haemolytic streptococcus injected mice (GAS-no Stress), psychosocial stressed mice (PBS-Stress), and mice exposed to haemolytic streptococcus and psychosocially stressed (GAS-Stress) at two weeks from treatment endings. Relative expression of GR mRNA in each area is presented as fold change over the expression measured in control mice (PBS-no Stress), taken as 1, and calculated using the 2-ΔΔCt method, normalized to hypoxanthine guanine phosphoribosyl transferase (HPRT), as detailed in the Materials and Methods section. Data are mean ± SEM, N= 4–6 per group. $ p < 0.05: GAS-Stress vs. PBS-Stress; # p < 0.05: GAS-no Stress vs. PBS-no Stress; * p < 0.05 PBS-no Stress vs. PBS-Stress. Cohen’s d measures are reported in Table S1A.
Figure 4
Figure 4
mRNA relative levels of inflammatory and oxidative stress-related markers in hypothalamus of GAS-Stress mice and relative controls. RT-PCR analysis was performed with mRNAs extracted from hypothalamus of control mice (PBS-no Stress), Group-A beta-haemolytic streptococcus injected mice (GAS-no Stress), psychosocially stressed mice (PBS-Stress) and mice exposed to haemolytic streptococcus and psychosocially stressed (GAS-Stress), at two weeks from treatment endings. Expression of each gene is presented as fold change over the expression measured in the hypothalamus of control mice (PBS-no Stress), taken as 1. The relative expression level of each mRNA was calculated using the 2-ΔΔCt method, normalized to hypoxanthine guanine phosphoribosyl transferase (HPRT), as detailed in the Materials and Methods section. Data are mean ± SEM, N = 4–6 per group. (A) IL-1β mRNA levels: $ p < 0.05 for GAS-no Stress vs. PBS-no Stress; * p < 0.05 for PBS-Stress vs. PBS-no Stress. (B) TNF-α mRNA levels: $ p < 0.05 for GAS-Stress vs. PBS-Stress; * p < 0.05 for PBS-Stress vs. PBS-no Stress. (C) IL-10 mRNA levels: $ p < 0.05 for GAS-Stress vs. PBS-Stress; * p < 0.05 for PBS-Stress vs. PBS-no Stress. (D) iNOS mRNA levels. (E) Arg-1 mRNA levels: * p < 0.01 for PBS-Stress vs. PBS-no Stress. (F) MnSOD mRNA level: $ p < 0.05 for GAS-Stress vs. PBS-Stress; * p < 0.05 for GAS-Stress vs. GAS-no Stress. (G) CD11b mRNA levels: $ p < 0.05 for GAS-Stress vs. PBS-Stress; * p < 0.05 for GAS-Stress vs. GAS-no Stress. Cohen’s d measures are reported in Table S1A.
Figure 5
Figure 5
mRNA relative levels of inflammatory and oxidative stress-related markers in the hippocampus of GAS-Stress mice and relative controls. RT-PCR analysis was performed with mRNAs extracted from hippocampus of control mice (PBS-no Stress), Group-A beta-haemolytic streptococcus exposed mice (GAS-no Stress), psychosocially stressed mice (PBS-Stress) and mice exposed to haemolytic streptococcus and psychosocially stressed (GAS-Stress), at two weeks from treatment endings. Expression of each gene is presented as fold change over the expression measured in the hippocampus of control mice (PBS-no Stress), taken as 1. The relative expression level of each mRNA was calculated using the 2-ΔΔCt method, normalized to hypoxanthine guanine phosphoribosyl transferase (HPRT), as detailed in the Materials and Methods section. Data are mean ± SEM, n = 4–6 per group. (A) IL-1β mRNA levels: $ p < 0.01 for GAS- Stress vs. PBS-Stress; * p < 0.05 for GAS-Stress vs. GAS-no Stress and for PBS-Stress vs. PBS-no Stress. (B) TNF-α mRNA levels: $ p < 0.05 for GAS-Stress vs. PBS-Stress; * p < 0.05 for PBS-Stress vs. PBS-no Stress. (C) IL-10 mRNA levels: $ p < 0.05 for GAS-Stress vs. PBS-Stress; * p < 0.05 for PBS-Stress vs. PBS-no Stress. (D) iNOS mRNA level: $ p < 0.01 for GAS-Stress vs. PBS-Stress; * p < 0.01 for GAS-Stress vs. GAS-no Stress and p < 0.05 for PBS-Stress vs. PBS-no Stress. (E) Arg-1 mRNA levels. (F) MnSOD mRNA level: $ p < 0.05 for PBS vs. GAS. (G) CD11b mRNA levels: * p < 0.01 for PBS-Stress vs. PBS-no Stress and vs. GAS-Stress. Cohen’s d measures are reported in Table S1A.
Figure 6
Figure 6
Mitochondrial respiratory chain (MRC) complex activities in brain of GAS-Stress mice and relative controls. The activities of the MRC (A) complex I, (B) complex II, (C) complex III, (D) complex IV and (E) complex V (ATP synthase) were measured spectrophotometrically in mitochondrial membrane enriched fractions from cryopreserved brain hemispheres of wt littermates control mice (PBS-no Stress), Group-A beta-haemolytic streptococcus exposed mice (GAS-no Stress), psychosocially stressed mice (PBS-Stress) and psychosocially stressed mice exposed to haemolytic streptococcus (GAS-Stress), at two weeks from treatment endings. Complex activities are expressed as nmol/min × mg protein. Data are mean rates ± SD obtained from three independent experiments. For MRC complex IV and V activities $ p < 0.05 for PBS-Stress vs. GAS-Stress; ** p < 0.01 for GAS no-Stress vs. GAS-Stress. Cohen’s d measures are reported in Table S1B.
Figure 7
Figure 7
Mitochondrial ATP production and ATP level in the brain of GAS-Stress mice and relative controls. The rate of mitochondrial ATP production was measured in mitochondria isolated from cryopreserved brain hemispheres in the presence of the respiratory substrates of (A) complex I glutamate plus malate (GLU/MAL), (B) complex II succinate (SUCC) plus rotenone or (C) complex IV ascorbate plus TMPD (ASC/TMPD). Values are mean rates ± SD obtained from three independent experiments and expressed as nmol/min × mg protein. Values are mean rates ± SD obtained from three independent experiments and expressed as nmol/min × mg protein. (D) The ATP level was measured as described in Material and Methods. Values are mean rates ± SD obtained from three independent experiments and expressed as nmol/mg protein. For the panels C and D $ p < 0.05 for PBS-Stress vs. GAS-Stress. ** p < 0.01 for GAS no-Stress vs. GAS-Stress. Cohen’s d measures are reported in Table S1C.

References

    1. Benros M.E., Waltoft B.L., Nordentoft M., Østergaard S.D., Eaton W.W., Krogh J., Mortensen P.B. Autoimmune Diseases and Severe Infections as Risk Factors for Mood Disorders. JAMA Psychiatry. 2013;70:812. doi: 10.1001/jamapsychiatry.2013.1111. - DOI - PubMed
    1. Köhler-Forsberg O., Petersen L., Gasse C., Mortensen P.B., Dalsgaard S., Yolken R.H., Mors O., Benros M.E. A Nationwide Study in Denmark of the Association between Treated Infections and the Subsequent Risk of Treated Mental Disorders in Children and Adolescents. JAMA Psychiatry. 2018 doi: 10.1001/jamapsychiatry.2018.3428. - DOI - PMC - PubMed
    1. Sperner-Unterweger B. Immunological aetiology of major psychiatric disorders: Evidence and therapeutic implications. Drugs. 2005;65:1493–1520. doi: 10.2165/00003495-200565110-00004. - DOI - PubMed
    1. Tylee D.S., Sun J., Hess J.L., Tahir M.A., Sharma E., Malik R., Worrall B.B., Levine A.J., Martinson J.J., Nejentsev S., et al. Genetic correlations among psychiatric and immune-related phenotypes based on genome-wide association data. Am. J. Med. Genet. B. Neuropsychiatr. Genet. 2018;177:641–657. doi: 10.1002/ajmg.b.32652. - DOI - PMC - PubMed
    1. Khandaker G.M., Dantzer R., Jones P.B. Immunopsychiatry: Important facts. Psychol. Med. 2017;47:2229–2237. doi: 10.1017/S0033291717000745. - DOI - PMC - PubMed

LinkOut - more resources