. 2019 Sep 12;7(3):70.
doi: 10.3390/biomedicines7030070.

Induction of Urokinase Activity by Retinoic Acid in Two Cell Lines of Neuronal Origin

Affiliations

Induction of Urokinase Activity by Retinoic Acid in Two Cell Lines of Neuronal Origin

Luka Horvat et al. Biomedicines. .

Abstract

Retinoic acid is one of the most well-known agents able to induce differentiation in several types of tumours. Unfortunately, most of the tumours are refractive to the differentiation cues. The aim of this investigation was to analyse the effects of prolonged treatment with retinoic acid on two cell lines of neural origin refractive to differentiation. Cells were also treated with retinoic acid in combination with a poly(ADP-ribosyl) polymerase (PARP) inhibitor because PARP1 is a known chromatin modulator and can influence the process of differentiation. The main methods comprised tumour cell line culturing and treatment; analysis of RNA and protein expression after cell treatment; as well as analysis of urokinase activity, migration, and proliferation. Both cell lines continued to proliferate under the prolonged treatment and showed increase in urokinase plasminogen activator activity. Analysis of gene expression and cell phenotype revealed different mechanisms, which only in neuroblastoma H4 cells could indicate the process of epithelial-mesenchymal transition. The data collected indicate that the activity of the urokinase plasminogen activator, although belonging to an extracellular protease, does not necessary lead to epithelial-mesenchymal reprogramming and increase in cell migration but can have different outcomes depending on the intracellular milieu.

Keywords: PARP1; epithelial-mesenchymal transition; glioblastoma; neuroglioblastoma cell line; retinoic acid; urokinase.


Conflict of interest statement

The authors declare no conflict of interest. The funders had no role in the design of the study; in the collection, analyses, or interpretation of data; in the writing of the manuscript, or in the decision to publish the results.

Figures

Figure 1
Figure 1
Growth curves of A1235 and H4 cells treated with all-trans retinoic acid (ATRA) and the poly(ADP-ribosyl) polymerase (PARP) inhibitor: Cells were treated every second day with 10 µM ATRA and 20 µM PJ-34 and their combination. Cell proliferation was determined by crystal violet staining and absorbance measurement. (A) A1235 cells; (B) H4 cells. * The mean values were significantly different from the control (p < 0.05).
Figure 2
Figure 2
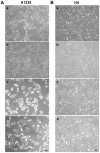
Morphology of A1235 glioblastoma and H4 neuroglioblastoma cells after 9 days of treatment with ATRA and the PARP inhibitor: Microphotographs were taken with epifluorescent microscope Axiovert 40 CFL. (A) A1235 cells; (B) H4 cells; a: control; b: cells treated with 20 µM PJ-34; c: cells treated with 10 µM ATRA; and d: cells treated with 10 µM ATRA and 20 µM PJ-34. Pictures were taken at magnification of 100×, scale bar = 100 µm.
Figure 3
Figure 3
uPA activity of A1235 and cells H4 after treatment with ATRA and the PARP inhibitor: Cells were treated with 10 µM ATRA and 20 µM PJ-34 and their combination every second day. After first day and after more than 9 days of treatment, cells were incubated for 6 h in medium without serum and the urokinase activity was determined in conditioned medium by caseinolysis. The uPA activity was estimated according to the calibration curve of human uPA and protein concentration of corresponding lysates and presented in proportion to control cell values. (A) A1235 cells treated for 1 day; (B) A1235 cells treated for prolonged time period; (C) H4 cells treated for 1 day; and (D) H4 cells treated for prolonged time period. S: 1-day treatment; L: prolonged treatment; PJ-34: cells treated with PARP inhibitor; ATRA: cells treated with ATRA; ATRA + PJ-34: cells treated with ATRA and PARP inhibitor. * The mean values were significantly different from the control (p < 0.05). Experiments were done two times, and representative results are shown.
Figure 4
Figure 4
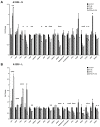
qRT-PCR analysis of the expression of genes involved in the uPA system and EMT in A1235 and H4 cells after 1 and 9 days of ATRA and PJ-34 treatment: Cells were treated with 10 µM ATRA and 20 µM PJ-34 and their combination every second day. RNA was isolated from cells treated for 1 and 9 days, and cDNA was produced and examined by qRT-PCR. Relative gene expression level was obtained by normalization of its values with those of hypoxanthine-guanine phosphoribosyltransferase (HPRT) and is presented as a fold change in comparison with untreated control cell values. (A) A1235 cells treated for 1 day; (B) A1235 cells treated for 9 days; (C) H4 cells treated for 1 day; and (D) H4 cells treated for 9 days. S: 1-day treatment; L: prolonged treatment; PJ-34: cells treated with PARP inhibitor; ATRA: cells treated with ATRA; ATRA + PJ-34: cells treated with ATRA and the PARP inhibitor. Data are expressed as mean ± SD. * The mean values were significantly different from the control (p < 0.05). Experiments with prolonged cell treatment were done at least two times, and representative results are shown.
Figure 4
Figure 4
qRT-PCR analysis of the expression of genes involved in the uPA system and EMT in A1235 and H4 cells after 1 and 9 days of ATRA and PJ-34 treatment: Cells were treated with 10 µM ATRA and 20 µM PJ-34 and their combination every second day. RNA was isolated from cells treated for 1 and 9 days, and cDNA was produced and examined by qRT-PCR. Relative gene expression level was obtained by normalization of its values with those of hypoxanthine-guanine phosphoribosyltransferase (HPRT) and is presented as a fold change in comparison with untreated control cell values. (A) A1235 cells treated for 1 day; (B) A1235 cells treated for 9 days; (C) H4 cells treated for 1 day; and (D) H4 cells treated for 9 days. S: 1-day treatment; L: prolonged treatment; PJ-34: cells treated with PARP inhibitor; ATRA: cells treated with ATRA; ATRA + PJ-34: cells treated with ATRA and the PARP inhibitor. Data are expressed as mean ± SD. * The mean values were significantly different from the control (p < 0.05). Experiments with prolonged cell treatment were done at least two times, and representative results are shown.
Figure 5
Figure 5
Western blot analysis of uPA and PAI-1 in A1235 and H4 cells after treatment with ATRA and PJ-34: After the prolonged treatment with 10 µM ATRA and 20 µM PJ-34 and their combination, the whole cell lysates were immunoblotted against indicated antibodies. (A) Analysis of A1235 cells; (B) analysis of H4 cells; and (C,D) densitometric analysis of western blot films of A1235 and H4 cells, respectively. PJ-34: cells treated with PARP inhibitor; ATRA: cells treated with ATRA; ATRA + PJ-34: cells treated with ATRA and the PARP inhibitor. Data are expressed as mean ± SD. * The mean values were significantly different from the control (p < 0.05). Experiments were done two times, and representative results are presented.
Figure 6
Figure 6
Analysis of cell migration after ATRA and PJ-34 treatment: Cells were seeded in Transwell chambers and allowed to migrate toward the medium with serum in the presence or in the absence of ATRA or PJ-34. Membranes were stained with crystal violet, and the absorbance was measured spectrophotometrically. (A) A1235 cells’ migration after 1 day of treatment; (B) A1235 cells’ migration after prolonged treatment; (C) H4 cells’ migration after 1 day of treatment; and (D) H4 cells’ migration after prolonged treatment. S: 1-day treatment; L: prolonged treatment; PJ-34: cells treated with 20 µM PJ-34; ATRA: cells treated with 10 µM ATRA; ATRA + PJ-34: cells treated with 20 µM PJ-34 and 10 µM ATRA inhibitor. * The mean values were significantly different from the control (p < 0.05). Experiments were done two times.
Figure 7
Figure 7
Metalloprotease activity and expression in A1235 and H4 cells after ATRA and PJ-34 treatment: (A) Zymography of H4 cells. After the prolonged treatment with 10 µM ATRA and 20 µM PJ-34 and their combination, conditioned H4 cells were collected, concentrated, and analysed by zymography on a gelatine-containing polyacrylamide gel. (B) qPCR analysis of MMP expression in A1235 cells; (C) qPCR analysis of MMP expression in H4 cells. RNA was isolated from cells after prolonged treatment, cDNA was produced and examined by qRT-PCR. Relative gene expression level was obtained by normalization of its values with those of hypoxanthine-guanine phosphoribosyltransferase (HPRT) and is presented as a fold change in comparison with untreated control cell values. PJ-34: cells treated with 20 µM PJ-34; ATRA: cells treated with 10 µM ATRA; ATRA + PJ-34: cells treated with 20 µM PJ-34 and 10 µM ATRA inhibitor; MMP2: metalloproteinase 2; MMP3: metalloproteinase 3; MMP9: metalloproteinase 9. * The mean values were significantly different from the control (p < 0.05).

Similar articles

Cited by

References

    1. Hanahan D., Weinberg R.A. The hallmarks of cancer. Cell. 2000;100:57–70. doi: 10.1016/S0092-8674(00)81683-9. - DOI - PubMed
    1. Breitman T.R., Selonick S.E., Collins S.J. Induction of differentiation of the human promyelocytic leukemia cell line (HL-60) by retinoic acid. Proc. Natl. Acad. Sci. USA. 1980;77:2936–2940. doi: 10.1073/pnas.77.5.2936. - DOI - PMC - PubMed
    1. de Thé H. Differentiation therapy revisited. Nat. Rev. Cancer. 2017;18:117–127. doi: 10.1038/nrc.2017.103. - DOI - PubMed
    1. Reynolds C.P., Matthay K.K., Villablanca J.G., Maurer B.J. Retinoid therapy of high-risk neuroblastoma. Cancer Lett. 2003;197:185–192. doi: 10.1016/S0304-3835(03)00108-3. - DOI - PubMed
    1. Janesick A., Wu S.C., Blumberg B. Retinoic acid signalling and neuronal differentiation. Cell Mol. Life Sci. 2015;72:1559–1576. doi: 10.1007/s00018-014-1815-9. - DOI - PMC - PubMed

LinkOut - more resources