. 2019 Sep 23;8(10):362.
doi: 10.3390/plants8100362.

Genome-Wide Identification, Evolution, and Expression Analysis of TPS and TPP Gene Families in Brachypodium distachyon

Affiliations

Genome-Wide Identification, Evolution, and Expression Analysis of TPS and TPP Gene Families in Brachypodium distachyon

Song Wang et al. Plants (Basel). .

Abstract

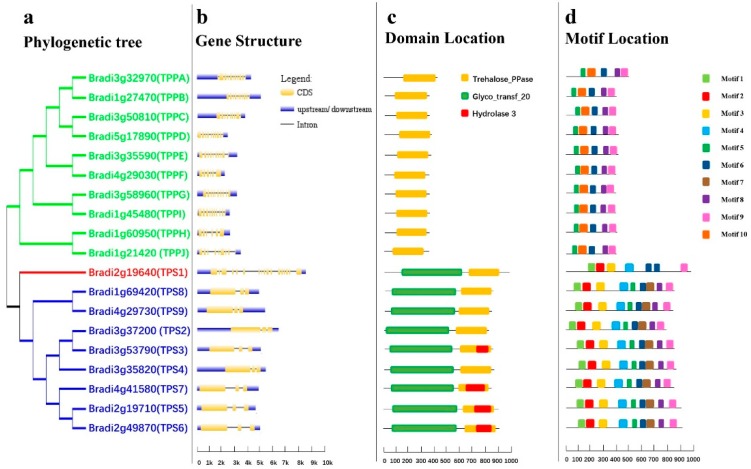
Trehalose biosynthesis enzyme homologues in plants contain two families, trehalose-6-phosphate synthases (TPSs) and trehalose-6-phosphate phosphatases (TPPs). Both families participate in trehalose synthesis and a variety of stress-resistance processes. Here, nine BdTPS and ten BdTPP genes were identified based on the Brachypodium distachyon genome, and all genes were classified into three classes. The Class I and Class II members differed substantially in gene structures, conserved motifs, and protein sequence identities, implying varied gene functions. Gene duplication analysis showed that one BdTPS gene pair and four BdTPP gene pairs are formed by duplication events. The value of Ka/Ks (non-synonymous/synonymous) was less than 1, suggesting purifying selection in these gene families. The cis-elements and gene interaction network prediction showed that many family members may be involved in stress responses. The quantitative real-time reverse transcription (qRT-PCR) results further supported that most BdTPSs responded to at least one stress or abscisic acid (ABA) treatment, whereas over half of BdTPPs were downregulated after stress treatment, implying that BdTPSs play a more important role in stress responses than BdTPPs. This work provides a foundation for the genome-wide identification of the B. distachyon TPS-TPP gene families and a frame for further studies of these gene families in abiotic stress responses.

Keywords: Brachypodium distachyon; TPP; TPS; abiotic stress; expression analysis.


Conflict of interest statement

The authors declare no conflict of interest.

Figures

Figure 1
Figure 1
Phylogenetic relationships and gene structures, domains, and motifs of the BdTPS and BdTPP family. (a) Phylogenetic analysis, Class I, II, and III genes are shown in red, blue, and green, respectively. (b) Gene structure, introns, exons, and upstream/downstream regions are shown as straight lines and yellow and blue bars, respectively. (c) The conserved trehalose-6-phosphate synthase (TPS) domain (Glyco_transf_20), trehalose-6-phosphate phosphatase (TPP) domain (Trehalose_PPase), and haloacid dehalogenase-like hydrolase domain containing 3 (Hydrolase 3) are shown by yellow, green, and red, respectively. (d) Motif analysis, all motifs were identified by MEME tools, as shown in different bars.
Figure 2
Figure 2
Pairwise sequence identities for different regions of the B. distachyon TPS and TPP proteins. (a) Pairwise sequence identities of the TPS and TPP domains in BdTPS. (b) Comparison of the TPS domain, TPP domain, protein sequence, and sequence outside the domain in BdTPS. (c) Comparison of the TPP domain, full-length protein sequence, and sequence outside the domain in BdTPP. (d) Comparison of the TPP domains in BdTPS and BdTPP.
Figure 3
Figure 3
Chromosomal location and gene duplication of BdTPSs/BdTPPs. The chromosome numbers are indicated above, and red lines represent the duplication gene pairs.
Figure 4
Figure 4
Predicted cis-elements related to stress resistance in the BdTPS/BdTPP promoters. Promoter sequences (−1500 bp) of 19 genes were analyzed using the PlantCARE database. The different colors and shapes of markers represent various cis-elements.
Figure 5
Figure 5
Prediction of the transcriptional regulatory network. The green hexagon represents BdTPS/BdTPP genes. Different colors represent different transcription factor families, with brilliant blue, dark blue, orange and purple hexagons indicating MYB, ERF, bZIP and 21 other transcription factor families, including B3, bHLH, C2H2, MIKC_MADS, TCP, LBD, NAC, BES1, EIL, Dof, E2F/DP, G2-like, Nin-like, CAMTA, CPP, Trihelix, ARF, C3H, GATA, TALE, and BBR-BPC family members.
Figure 6
Figure 6
The interaction network between members of the family. Protein interaction network prediction showed that most BdTPS and BdTPP proteins interact with more than one other family member. Line colors represent the various types of evidence used to predict the protein interaction network.
Figure 7
Figure 7
Co-expression neighborhood of PsaN (take BdTPS1 for example, large light green circle). The straight lines of different colors show how strongly two genes are co-expressed, with green, yellow, and red edges indicating strong, medium, and weak co-expression, respectively.
Figure 8
Figure 8
Expression profiles of BdTPS and BdTPP genes in four tissues. Blue color and small circle/red color and large circle that represent low/high expression, respectively.
Figure 9
Figure 9
Expression patterns of BdTPS and BdTPP genes under three different abiotic stresses and abscisic acid (ABA) treatment in the whole plants. The gradient ramp represents different relative expression levels. The green indicates a low expression level and the red indicates a high expression level.
Figure 10
Figure 10
Relative expression level of some BdTPS/BdTPP genes under salt and cold stress conditions at 1, 3, and 6 h after exposure to the abiotic stress. Different lowercase letters (a, b, c) above the bars indicate significantly different values (p < 0.05, t-test).

Similar articles

Cited by

References

    1. Pandey G.K., Pandey A., Prasad M., Böhmer M. Editorial: Abiotic Stress Signaling in Plants: Functional Genomic Intervention. Front. Plant Sci. 2016;7:681–685. doi: 10.3389/fpls.2016.00681. - DOI - PMC - PubMed
    1. Avonce N., Mendoza-Vargas A., Morett E., Iturriaga G. Insights on the evolution of trehalose biosynthesis. BMC Evol. Biol. 2006;6:109–114. doi: 10.1186/1471-2148-6-109. - DOI - PMC - PubMed
    1. Horlacher R., Boos W. Characterization of TreR, the major regulator of the Escherichia coli trehalose system. J. Biol. Chem. 1997;272:13026–13032. doi: 10.1074/jbc.272.20.13026. - DOI - PubMed
    1. Hounsa C.G., Brandt E.V., Thevelein J., Hohmann S., Prior B. Role of trehalose in survival of Saccharomyces cerevisiae under osmotic stress. Microbiology. 1998;144:671–680. doi: 10.1099/00221287-144-3-671. - DOI - PubMed
    1. StrøM A.R., Kaasen I. Trehalose metabolism in Escherichia coli: Stress protection and stress regulation of gene expression. Mol. Microbiol. 2010;8:205–210. doi: 10.1111/j.1365-2958.1993.tb01564.x. - DOI - PubMed

LinkOut - more resources