. 2019 Sep 23;8(10):1526.
doi: 10.3390/jcm8101526.

NT5E/CD73 as Correlative Factor of Patient Survival and Natural Killer Cell Infiltration in Glioblastoma

Affiliations

NT5E/CD73 as Correlative Factor of Patient Survival and Natural Killer Cell Infiltration in Glioblastoma

Jiao Wang et al. J Clin Med. .

Abstract

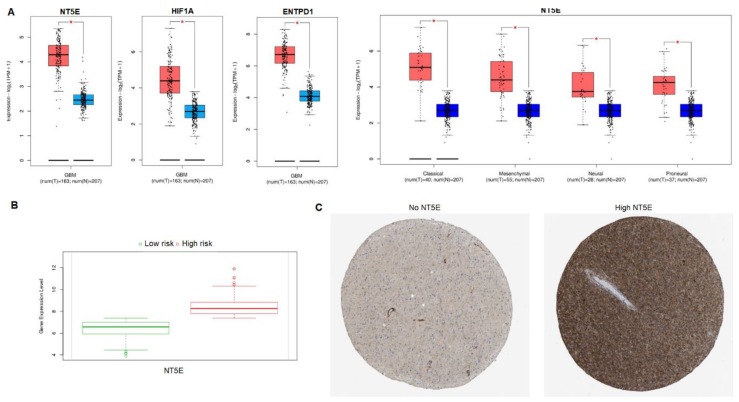
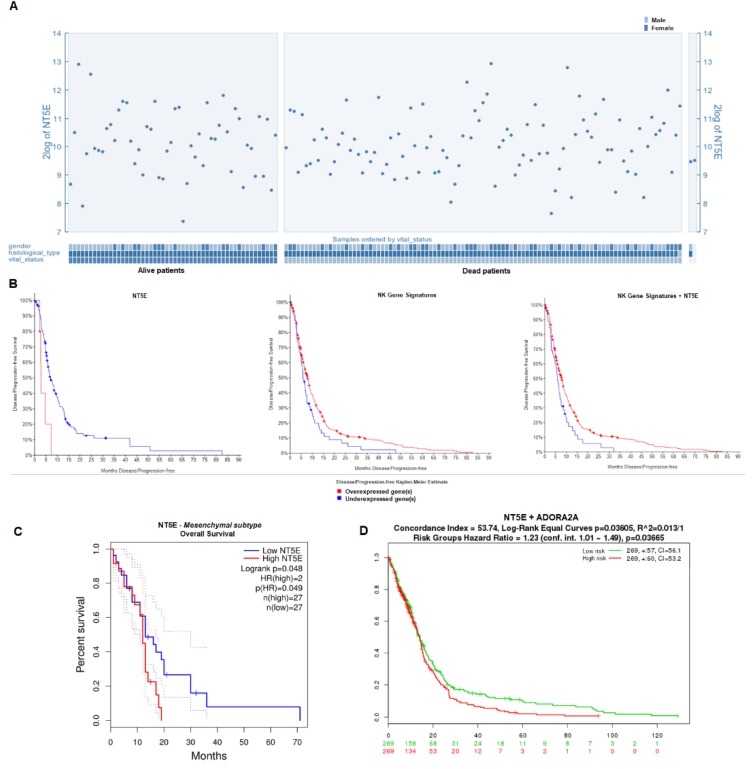
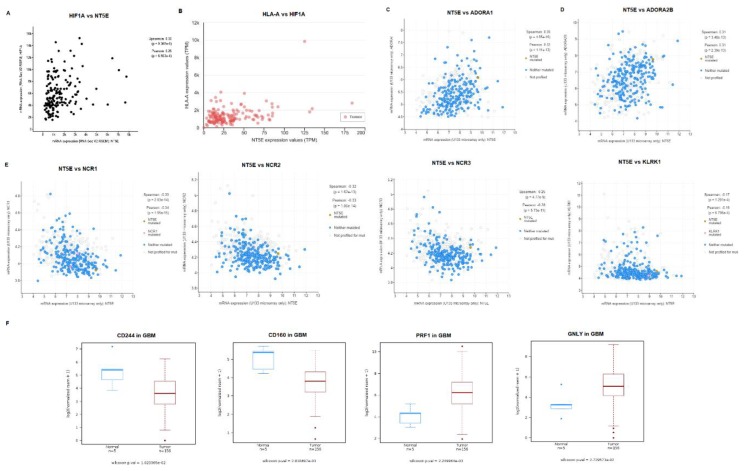
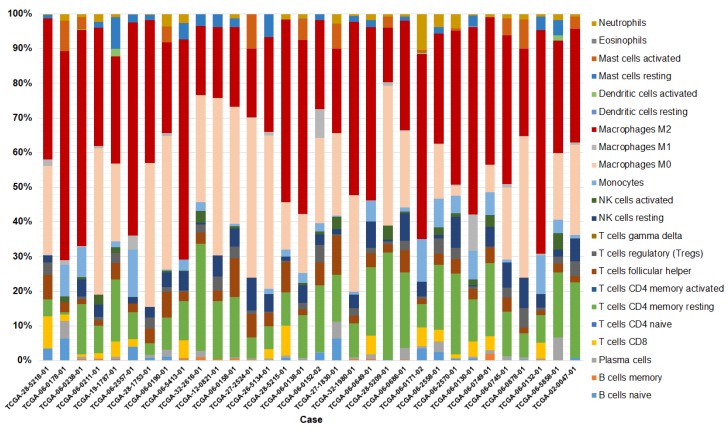
CD73, a cell-surface protein encoded by the gene NT5E, is overexpressed in glioblastoma (GBM), where it contributes to the tumor's pathophysiology via the generation of immunosuppressive adenosine. Adenosinergic signaling, in turn, drives immunosuppression of natural killer (NK) cells through metabolic and functional reprogramming. The correlation of CD73 with patient survival in relation to GBM pathology and the intratumoral infiltration of NK cells has not been comprehensively studied before. Here, we present an analysis of the prognostic relevance of CD73 in GBM based on transcriptional gene expression from patient data from The Cancer Genome Atlas (TCGA) database. Utilizing bioinformatics data mining tools, we explore the relationship between GBM prognosis, NT5E expression, and intratumoral presence of NK cells. Our analysis demonstrates that CD73 is a negative prognostic factor for GBM and that presence of NK cells may associate with improved prognosis. Moreover, the interplay between expression of NT5E and specific NK genes hints to potential functional effects of CD73 on NK cell activation.

Keywords: CD73; adenosine; glioblastoma; immunometabolism; natural killer cells.


Conflict of interest statement

The authors declare no conflict of interest.

Figures

Figure 1
Figure 1
Expression of NT5E in glioblastoma (GBM). (A) Expression of NT5E, HIF1A, and ENTPD1 in GBM (red) and normal brain (blue) based on TCGA data analyzed by GEPIA2 (n = 163). NT5E expression was also analyzed with TCGA data stratified into GBM subtypes: Classical, mesenchymal, neural, and proneural. All samples showed higher target gene expression in GBM compared to normal tissue (* p < 0.01). (B) Expression of NT5E in GBM based on risk group. High risk patients showed higher expression of NT5E compared to low risk patients. Risk group analysis was done in SurvExpress (p = 4.91 × 10⁻⁶; n = 538). (C) Immunohistochemical staining of glioma tissue obtained from the Human Protein Atlas showing NT5E-negative tissue (female, age 36; left) and high NT5E-expressing glioma tissue (male, age 71; right).
Figure 2
Figure 2
Survival analysis in the context of NT5E and natural killer (NK) gene signature expression. (A) Expression of NT5E in GBM patient samples plotted on the basis of patient vital status. Analysis was done in R2 (n = 540). (B) Disease-free survival of GBM patients on the basis of NT5E expression level from TCGA RNASeq V2 RSEM data (p = 0.0039; z = 2; left; n = 166); NK gene signatures comprising 13 NK-specific genes from U133 Affymetrix gene expression data (p = 0.0285; middle panel); and both NT5E and NK gene signatures from U133 Affymetrix gene expression data (p = 0.0109; right). Kaplan–Meier plots were generated in cBioPortal (n = 533). (C) Overall survival of GBM patients with the mesenchymal subtype based on NT5E expression. Analysis was done in GEPIA2 (n = 163). (D) Overall survival stratified by risk group for patients expressing NT5E and ADORA2A. Analysis was done in R2.
Figure 3
Figure 3
Correlation of expression of NT5E and NK gene signatures in GBM. (A) Co-expression of NT5E and HIF1A in GBM. Data were analyzed in cBioPortal using U133 Affymetrix microarray data (z = 1; n = 533). (B) Co-expression of NT5E and HLA-A based on TCGA data in UALCAN (n = 156). (C) Co-expression of NT5E and ADORA1 in GBM using the TCGA database analyzed in cBioPortal on the basis of U133 Affymetrix microarray data (z = 1; n = 533). (D) Co-expression of NT5E and ADORA2B in GBM using the TCGA database analyzed in cBioPortal on the basis of U133 Affymetrix microarray data (z = 1). (E) Co-expression of NT5E and genes representing NK activating receptors: NCR1, NCR2, NCR3, and KLRK1 in GBM. Data were analyzed in cBioPortal using U133 Affymetrix microarray data (z = 1). (F) Box-plots of the expression of genes associated with NK cells in GBM (red) and normal tissue (blue): CD244, CD160, PRF1 and GNLY based on TCGA data analyzed in TCGA Wanderer (n = 156).
Figure 4
Figure 4
Profiling of infiltration of immune cells into GBM. Deconvoluted immune cell subsets from The Cancer Genome Atlas (TCGA) data by CIBERSORT indicate NK cells represent up to ~9.48% of GBM immune infiltrates. Data have been trimmed to include cases for which gene expression was p < 0.05.
Figure 5
Figure 5
Proportion of NK cells identified in GBM TCGA samples. Deconvoluted RNASeq transcriptional data into resting and activated NK cells plotted as a percentage of these cells’ presence in individual TCGA samples for which p < 0.05.

Similar articles

Cited by

References

    1. Johnson D.R., O’Neill B.P. Glioblastoma survival in the United States before and during the temozolomide era. J. Neuro Oncol. 2012;107:359–364. doi: 10.1007/s11060-011-0749-4. - DOI - PubMed
    1. Aum D.J., Kim D.H., Beaumont T.L., Leuthardt E.C., Dunn G.P., Kim A.H. Molecular and cellular heterogeneity: The hallmark of glioblastoma. Neurosurg. Focus. 2014;37:E11. doi: 10.3171/2014.9.FOCUS14521. - DOI - PubMed
    1. Brat D.J., Castellano-Sanchez A., Kaur B., Van Meir E.G. Genetic and biologic progression in astrocytomas and their relation to angiogenic dysregulation. Adv. Anat. Pathol. 2002;9:24–36. doi: 10.1097/00125480-200201000-00004. - DOI - PubMed
    1. Yang L., Lin C., Wang L., Guo H., Wang X. Hypoxia and hypoxia-inducible factors in glioblastoma multiforme progression and therapeutic implications. Exp. Cell Res. 2012;318:2417–2426. doi: 10.1016/j.yexcr.2012.07.017. - DOI - PubMed
    1. Bar E.E., Lin A., Mahairaki V., Matsui W., Eberhart C.G. Hypoxia increases the expression of stem-cell markers and promotes clonogenicity in glioblastoma neurospheres. Am. J. Pathol. 2010;177:1491–1502. doi: 10.2353/ajpath.2010.091021. - DOI - PMC - PubMed