

Comparison between Fractionated Dose and Single Dose of Cu-64 Trastuzumab Therapy in the NCI-N87 Gastric Cancer Mouse Model
- PMID: 31547586
- PMCID: PMC6801605
- DOI: 10.3390/ijms20194708
Comparison between Fractionated Dose and Single Dose of Cu-64 Trastuzumab Therapy in the NCI-N87 Gastric Cancer Mouse Model
Abstract
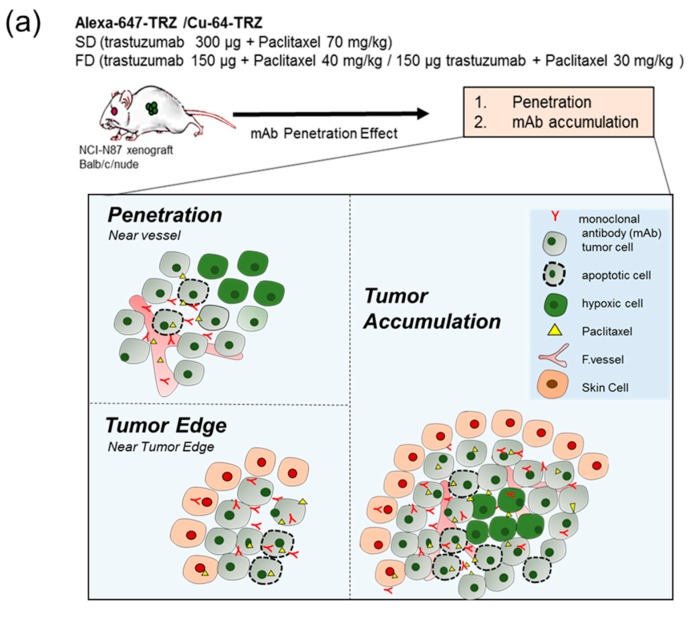
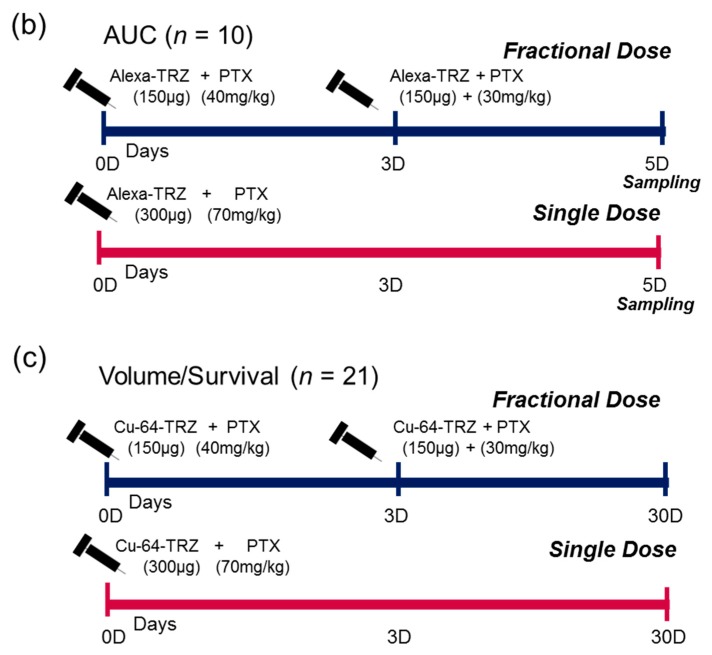
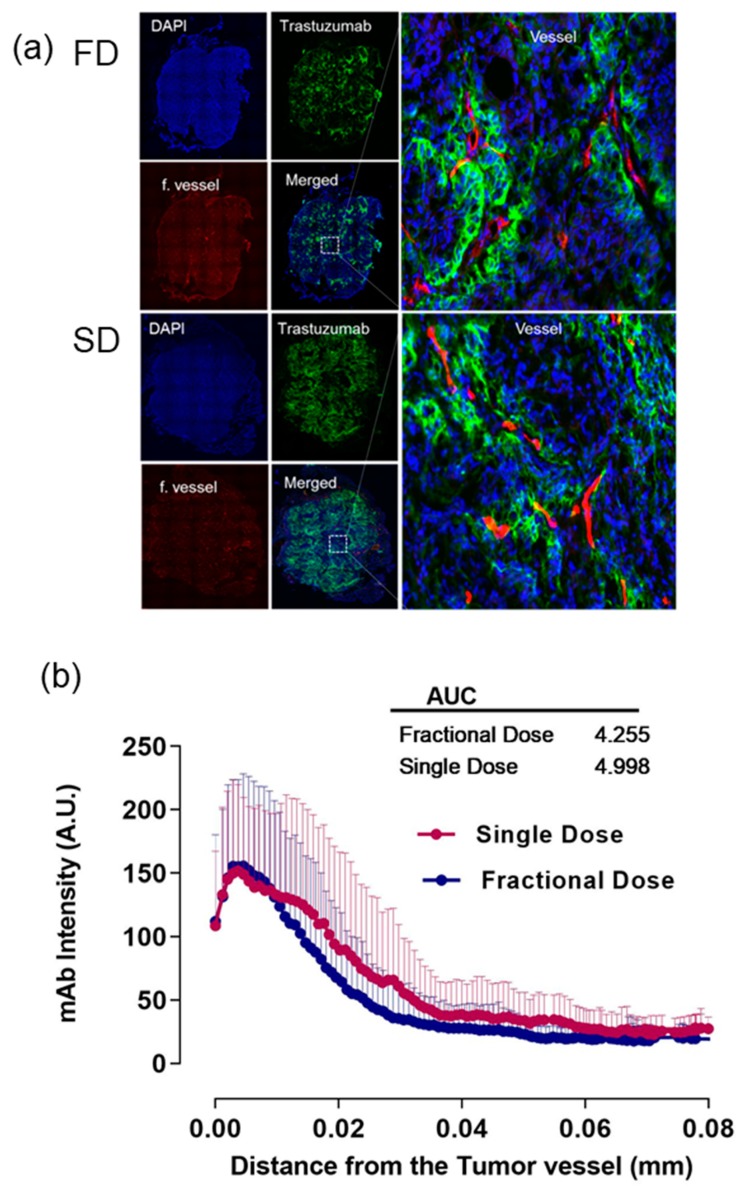
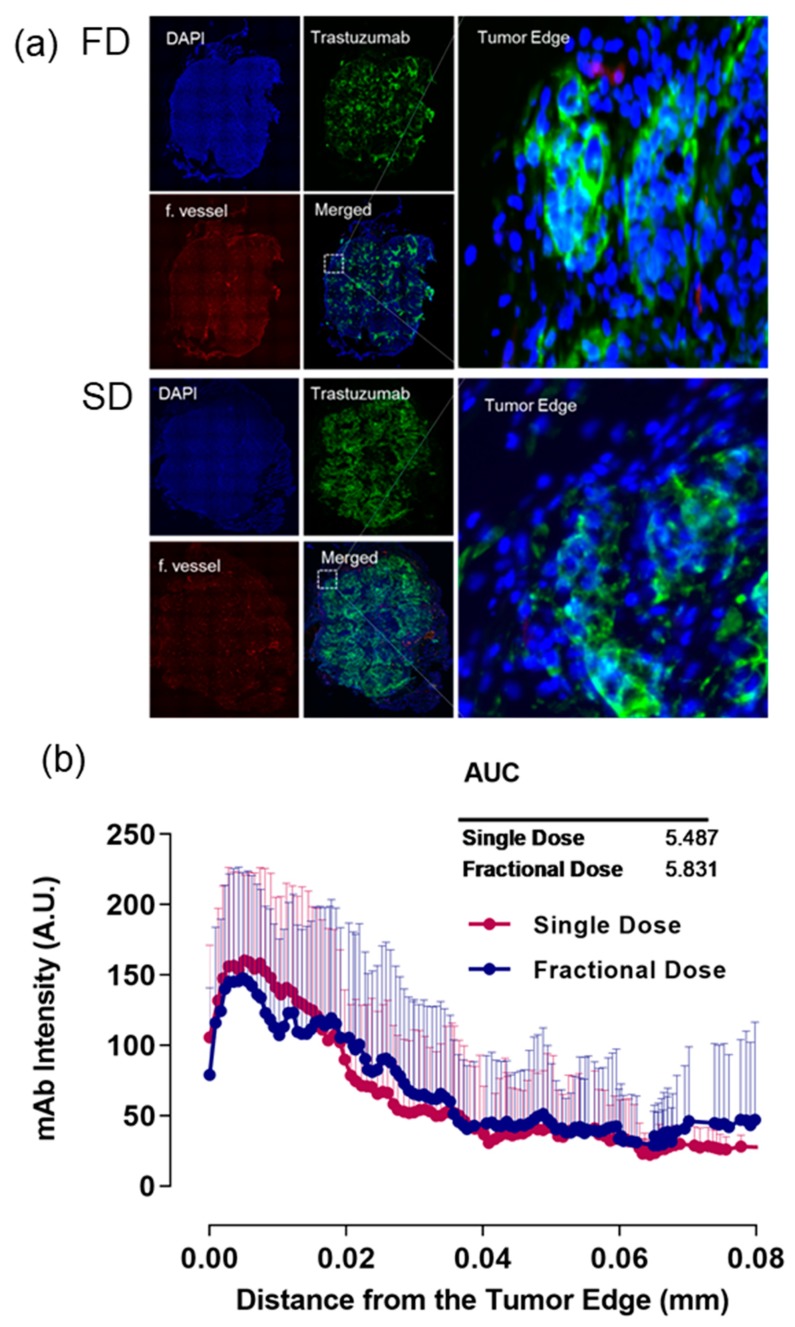
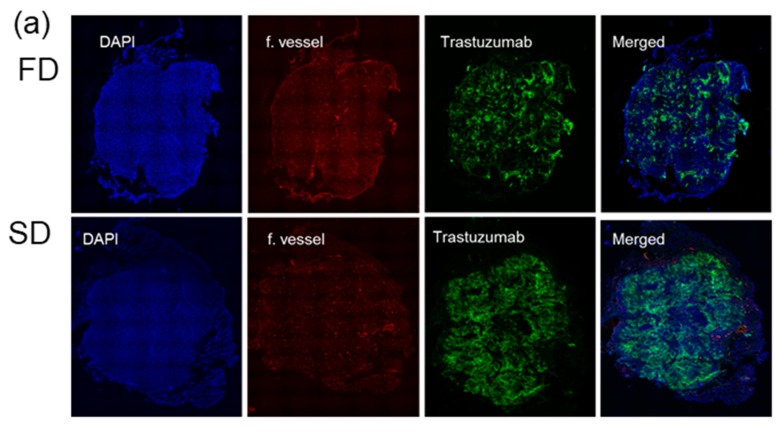
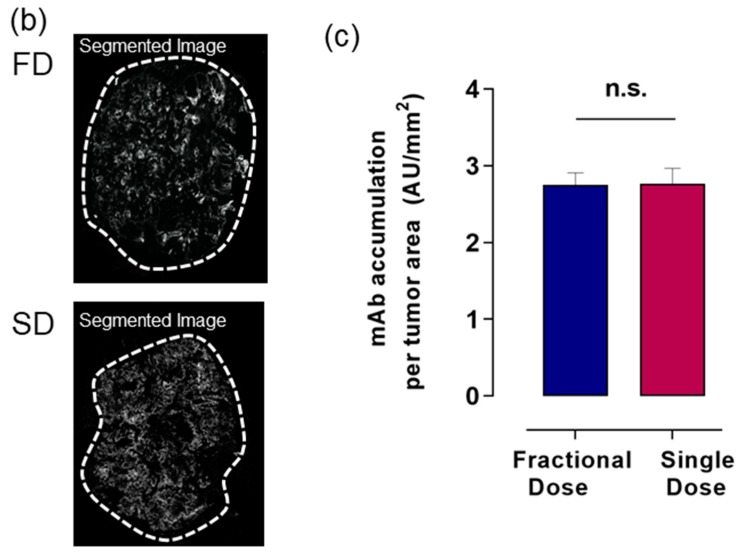
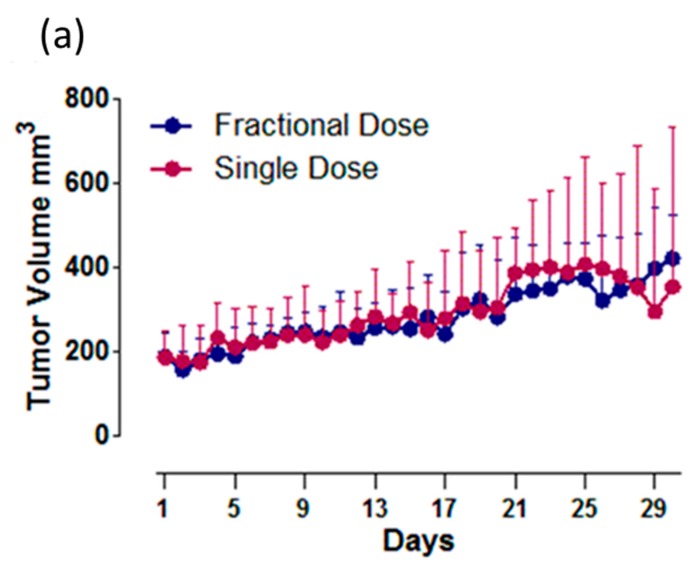
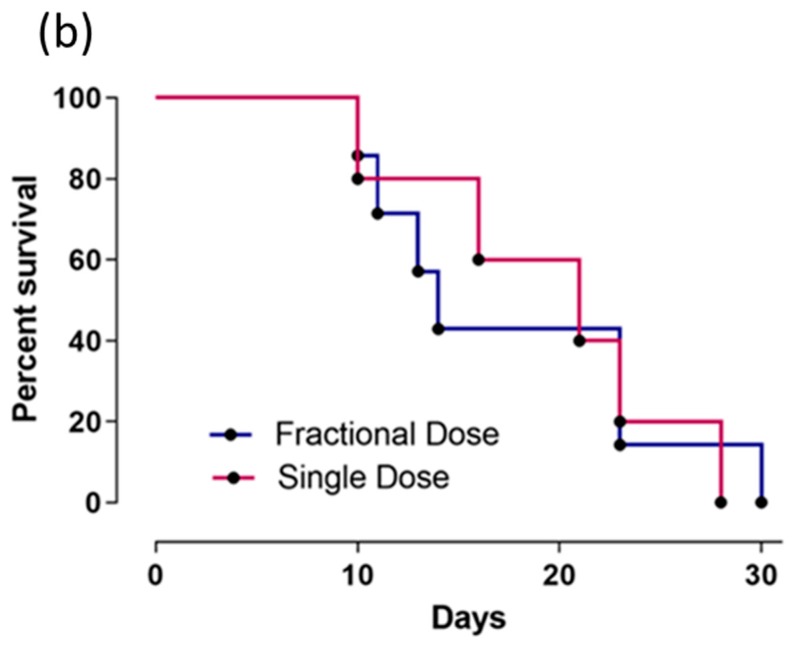
For optimum radioimmunotherapy (RIT), deep penetration and uniform distribution into the tumor core is important. The solid tumor microenvironment, consisting of a highly fibrotic or desmoplastic tumor, abnormal tumor vasculature, high fluid pressure, and the absence of fluid lymphatics, limits the distribution of monoclonal antibodies mAbs to the tumor core. To investigate the optimal rationale for therapeutic mAbs administration and the microdistribution of mAbs, single and serial fractional dosage regimens of Cu-64-trastuzumab (TRZ) with paclitaxel were evaluated. Groups of nude mice were inoculated with gastric cancer cell line NCI-N87 tumor cells. When the tumor size reached 200 ± 20 mm3, the mice were divided into two groups for injection of Alexa-647-TRZ. One group (n = 5) was injected with 15 mg/kg in a single dose (SD), and the other group (n = 5) with two doses of 7.5 mg/kg (fractionated dose (FD)). In both cases, the injections were done intravenously in combination with intraperitoneal paclitaxel either as a SD of 70 mg/kg or fractionated into two doses of 40 and 30 mg/kg. Tumors were harvested, flash frozen, and sectioned (8 µm) five days after Alexa-647-TRZ injection. Rhodamine lectin (rhodamine-labeled Ricinus communis agglutinin I, 1 mg in 0.2 mL of phosphate-buffered saline (PBS)) was intravenously injected to delineate the functional vessel for a wait time of 5 min before animal euthanization. Microscopic images were acquired with an IN Cell Analyzer. The amount of TRZ that penetrated the tumor surface and the tumor vessel was calculated by area under the curve (AUC) analysis. For RIT efficacy (n = 21), Cu-64-TRZ was injected following the same dose schedule to observe tumor volume and survival ratio for 30 days. The SD and FD regimens of Alexa-647-TRZ were observed to have no significant difference in penetration of mAbs from the tumor edge and vessel, nor was the total accumulation across the whole tumor tissue significantly different. Additionally, the SD and FD regimens of Cu-64-TRZ were not proven to be significantly efficacious. Our study reveals that SD and FD in a treatment design with Cu-64-TRZ and paclitaxel shows no significant difference in therapeutic efficacy on tumor growth inhibition in vivo in mice bearing human gastric cancer xenografts overexpressing HER2 antigen.
Keywords: Herceptin; fractional dose (FD); gastric cancer; penetration; radioimmunotherapy; single dose (SD); therapeutics; trastuzumab.
Conflict of interest statement
The authors declare that there are no conflicts of interest regarding the publication of this paper.
Figures
Similar articles
-
Tumor microenvironment modulation by SERPINE1 increases radioimmunotherapy in murine model of gastric cancer.Sci Rep. 2025 May 12;15(1):16449. doi: 10.1038/s41598-025-97983-4. Sci Rep. 2025. PMID: 40355586 Free PMC article.
-
Locoregional therapy with α-emitting trastuzumab against peritoneal metastasis of human epidermal growth factor receptor 2-positive gastric cancer in mice.Cancer Sci. 2017 Aug;108(8):1648-1656. doi: 10.1111/cas.13282. Epub 2017 Jun 27. Cancer Sci. 2017. PMID: 28514062 Free PMC article.
-
Utility of 211At-Trastuzumab for the Treatment of Metastatic Gastric Cancer in the Liver: Evaluation of a Preclinical α-Radioimmunotherapy Approach in a Clinically Relevant Mouse Model.J Nucl Med. 2021 Oct;62(10):1468-1474. doi: 10.2967/jnumed.120.249300. Epub 2021 Feb 5. J Nucl Med. 2021. PMID: 33547212 Free PMC article.
-
Therapeutic efficacy and tumor dose estimations in radioimmunotherapy of intraperitoneally growing OVCAR-3 cells in nude mice with (211)At-labeled monoclonal antibody MX35.J Nucl Med. 2005 Nov;46(11):1907-15. J Nucl Med. 2005. PMID: 16269606
-
An FGFR3 Autocrine Loop Sustains Acquired Resistance to Trastuzumab in Gastric Cancer Patients.Clin Cancer Res. 2016 Dec 15;22(24):6164-6175. doi: 10.1158/1078-0432.CCR-16-0178. Epub 2016 Jun 7. Clin Cancer Res. 2016. PMID: 27267856
Cited by
-
Tumor microenvironment modulation by SERPINE1 increases radioimmunotherapy in murine model of gastric cancer.Sci Rep. 2025 May 12;15(1):16449. doi: 10.1038/s41598-025-97983-4. Sci Rep. 2025. PMID: 40355586 Free PMC article.
-
Perspectives on metals-based radioimmunotherapy (RIT): moving forward.Theranostics. 2021 Apr 15;11(13):6293-6314. doi: 10.7150/thno.57177. eCollection 2021. Theranostics. 2021. PMID: 33995659 Free PMC article. Review.
References
-
- Jhanwar Y.S., Divgi C. Current status of therapy of solid tumors. J. Nucl. Med. 2005;46(Suppl. 1):141S–150S. - PubMed
Publication types
MeSH terms
Substances
Grants and funding
LinkOut - more resources
Full Text Sources
Medical
Research Materials
Miscellaneous
