Review
. 2019 Oct:31:30-40.
doi: 10.1016/j.spen.2019.05.006. Epub 2019 May 11.

The Assessment of Visual Function and Functional Vision

Affiliations
Review

The Assessment of Visual Function and Functional Vision

Christopher R Bennett et al. Semin Pediatr Neurol. 2019 Oct.

Abstract

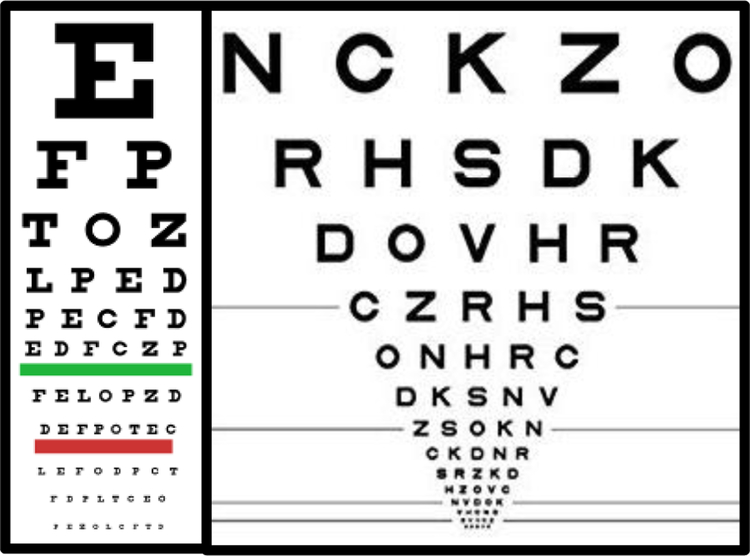
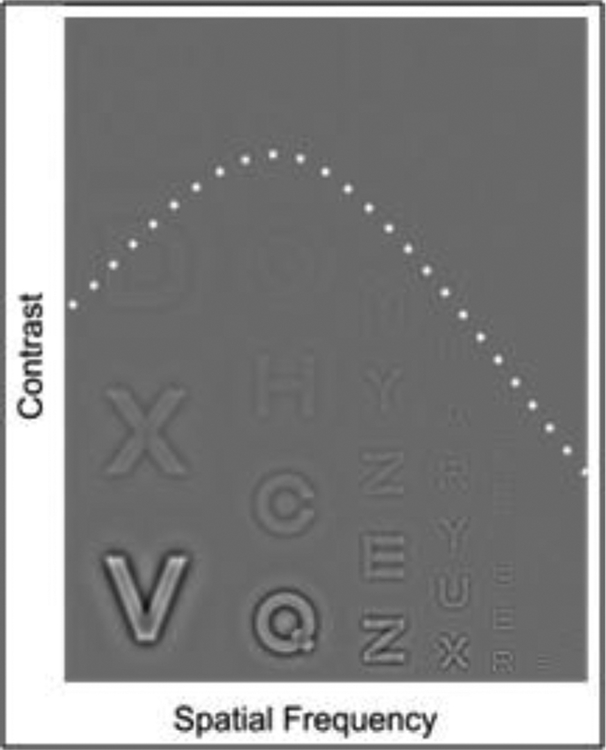
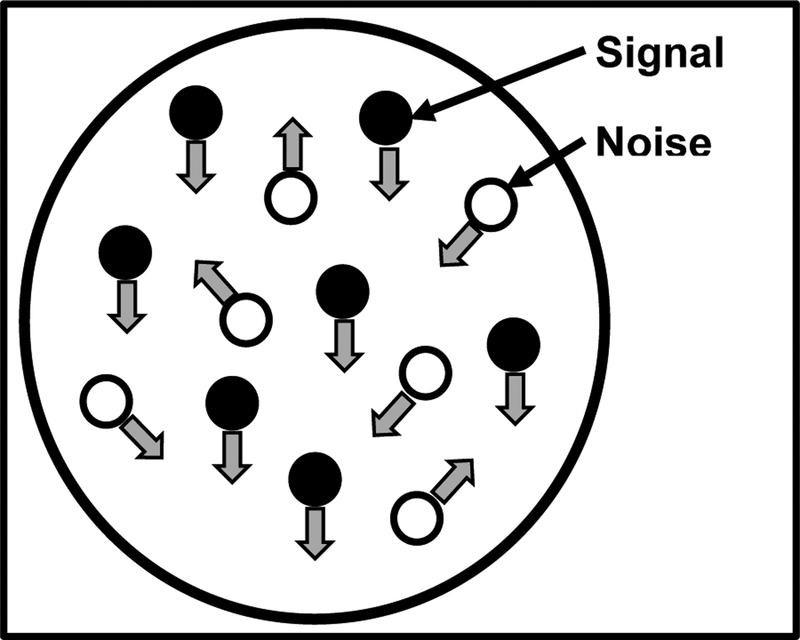
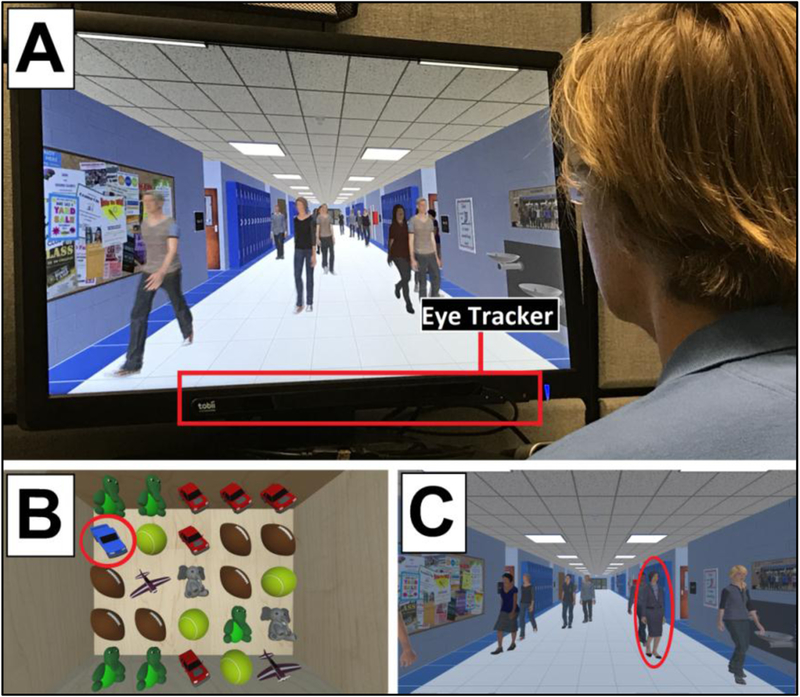
The complete assessment of vision-related abilities should consider visual function (the performance of components of the visual system) and functional vision (visual task-related ability). Assessment methods are highly dependent upon individual characteristics (eg, the presence and type of visual impairment). Typical visual function tests assess factors such as visual acuity, contrast sensitivity, color, depth, and motion perception. These properties each represent an aspect of visual function and may impact an individual's level of functional vision. The goal of any functional vision assessment should be to measure the visual task-related ability under real-world scenarios. Recent technological advancements such as virtual reality can provide new opportunities to improve traditional vision assessments by providing novel objective and ecologically valid measurements of performance, and allowing for the investigation of their neural basis. In this review, visual function and functional vision evaluation approaches are discussed in the context of traditional and novel acquisition methods.


Figures

Figure 1.
Figure 1.
Example charts and approaches used in measuring visual acuity. (Left) Classic Snellen letter chart. (Right) Early Treatment of Diabetic Retinopathy Study (ETDRS) chart. Note how this chart uses 5 letters per line with decreasing size and with equal logarithmic spacing of the rows and letters.
Figure 2:
Figure 2:
Example Contrast Sensitivity Function. Contrast increases from top to bottom and spatial frequency increases from left to right most observers perceive an inverted U shape that separates visible from non-visible letters, illustrated by the dashed line. Adapted from).
Figure 3.
Figure 3.
Illustration of a random dot kinetogram (RDK). In this pattern, two different types of dot motion are used. Signal dots move coherently in a given direction while noise dots move randomly.
Figure 4.
Figure 4.
Photo and screenshots from VR Simulations. (A) photo of participant viewing the Virtual Hallway task. The eye-tracking unit (mounted to monitor display) is highlighted. (B) screenshot of the Virtual Toy Box task. In this example, the participant must find the target toy (blue truck, circle) amongst the high number of surrounding distractor elements. (C) screenshot of the Virtual Hallway. In this task, the participant must find the target (principal, circle) walking amongst a high number of distractors (other individuals).
Figure 5.
Figure 5.
Heat map displays of eye search patterns for the Virtual Hallway. Data from a control, OVI, and CVI participant are shown for both the low and high number of distractor conditions. Note how the search pattern in the CVI participant is markedly more diffuse in response to the high distractor condition. Adapted from.
Figure 6.
Figure 6.
Heat map displays of eye search patterns for the Virtual Toy Box. Data from a control, OVI, and CVI participant are shown for both the low and high number of unique distractor conditions. Note that the search pattern of the CVI participant shows greater spread in response to the high unique distractor condition. Adapted from.
Figure 7.
Figure 7.
fMRI activation patterns resulting from viewing the Virtual Hallway task in a control participant (left) and individual with CVI (right) (left hemisphere and lateral view is shown). Robust activation is seen within a confluence of occipital visual areas (arrow) and intra parietal sulcus (IPS) in the control. Overall occipital area (arrow) and IPS activation is less robust for the individual with CVI as compared to the control.
Figure 8.
Figure 8.
Scalp map plots of 20 channel EEG data obtained from viewing the Virtual Toy Box task in a control and individual with CVI (posterior view, right side). Scalp maps are displayed in 25 ms intervals from 300 ms to 400 ms. The occipital-parietal signal observed in the control (top) appears robust and peaks between 350 and 375 ms. The individual with CVI (bottom) shows an overall reduction in signal with the peak being at a similar time to the control. Note further how the occipital signal does not appear as robustly sustained as it is in the control participant (at 400 ms).

Comment in

References

    1. Colenbrander A Visual functions and functional vision, International Congress Series 1282:482–486; 2005.
    1. Hyvärinen L Considerations in Evaluation and Treatment of the Child With Low Vision, American Journal of Occupational Therapy 49:891–897; 1995. - PubMed
    1. Colenbrander A Aspects of vision loss – visual functions and functional vision, Visual Impairment Research 5:115–136; 2003.
    1. Kran BS, Mayer DL. Vision Impairment and Brain Damage.In: Bartuccio M, Maino DM, eds Visual diagnosis and care of the patient with special needs: Lippincott Williams & Wilkins; 2012:135–146.
    1. Katzner S, Weigelt S. Visual cortical networks: of mice and men, Current Opinion in Neurobiology 23:202–206; 2013. - PubMed

Publication types