. 2019 Nov 1;203(9):2508-2519.
doi: 10.4049/jimmunol.1900165. Epub 2019 Sep 23.

Rhinovirus-Induced SIRT-1 via TLR2 Regulates Subsequent Type I and Type III IFN Responses in Airway Epithelial Cells

Affiliations

Rhinovirus-Induced SIRT-1 via TLR2 Regulates Subsequent Type I and Type III IFN Responses in Airway Epithelial Cells

Nathaniel Xander et al. J Immunol. .

Abstract

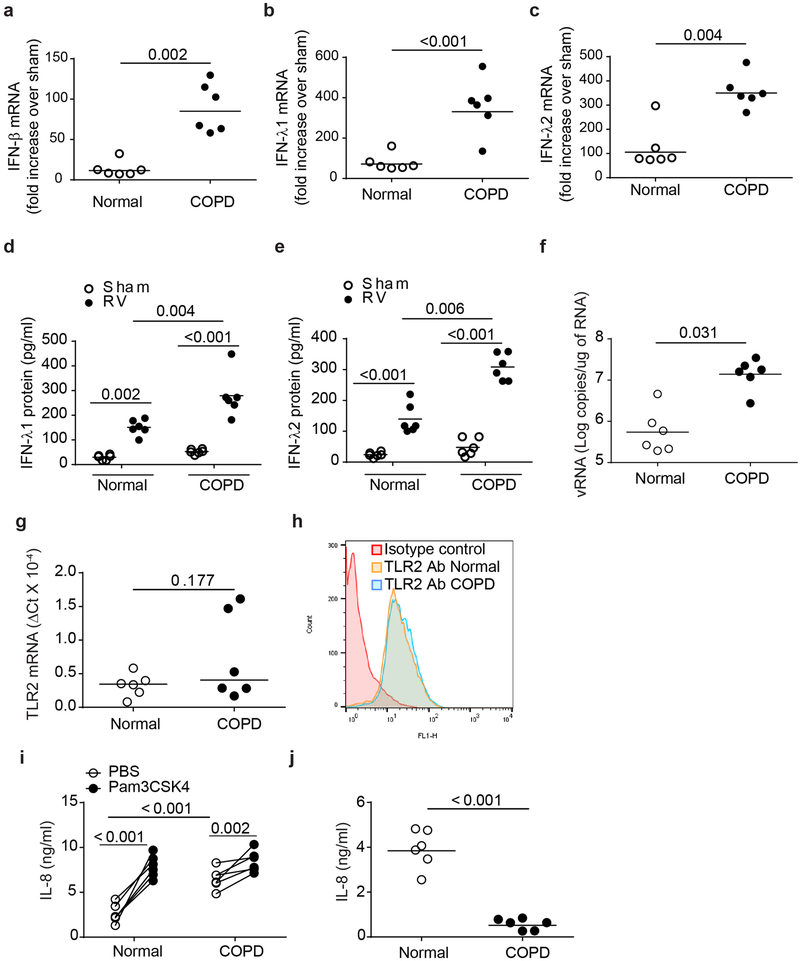
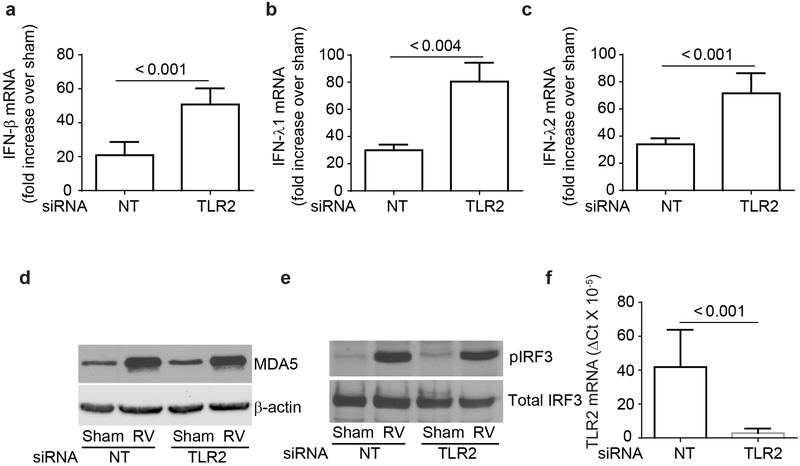
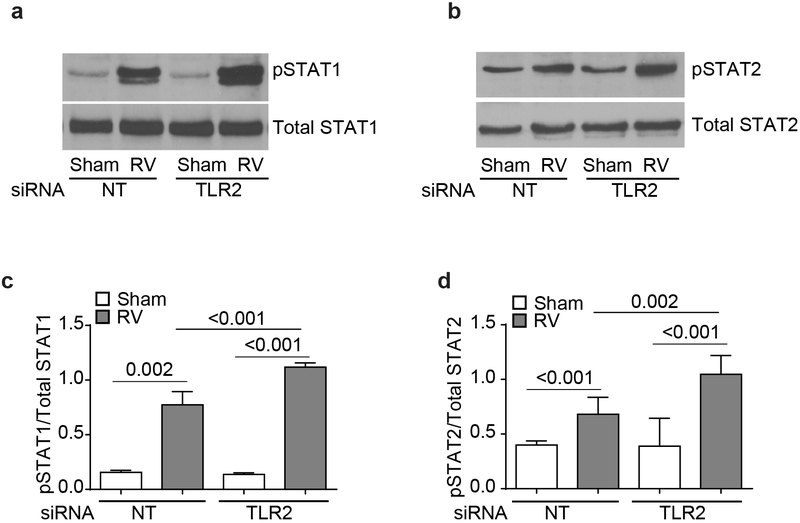
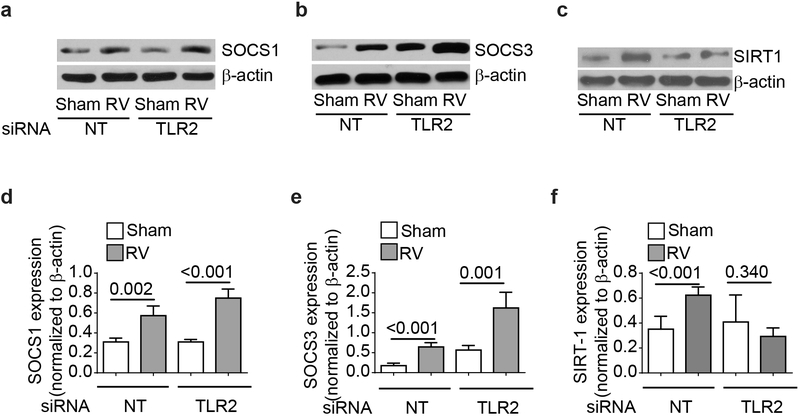
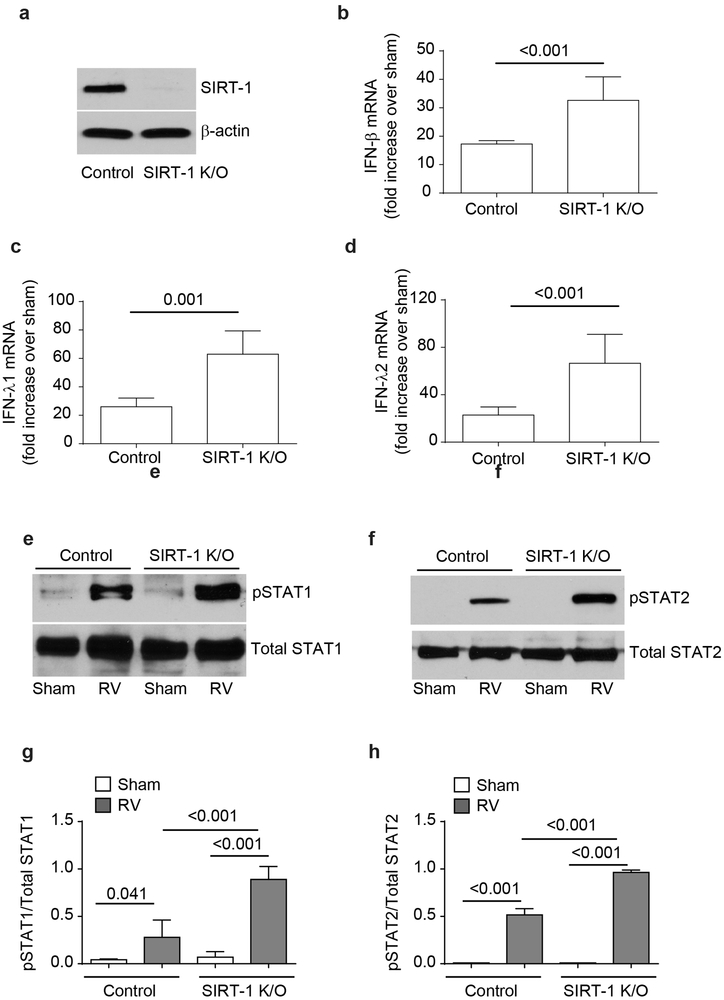
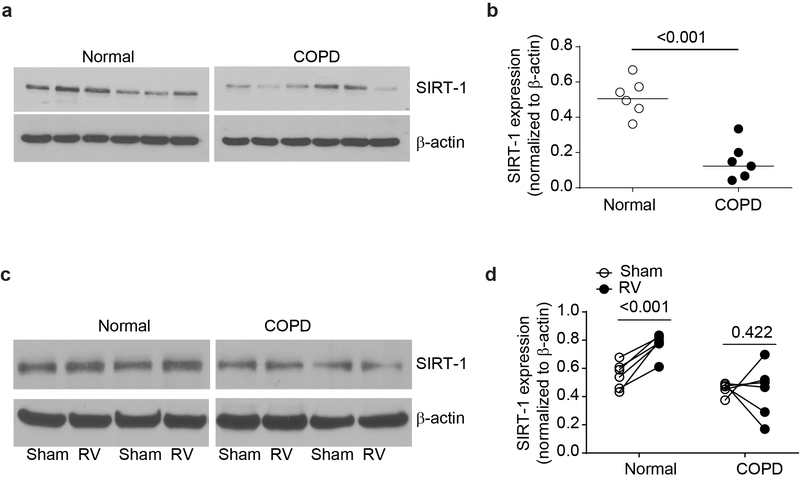
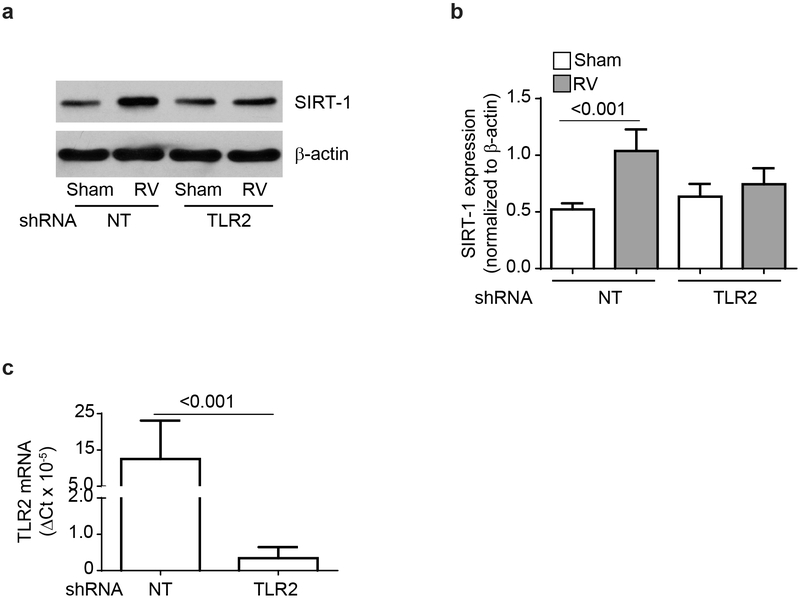
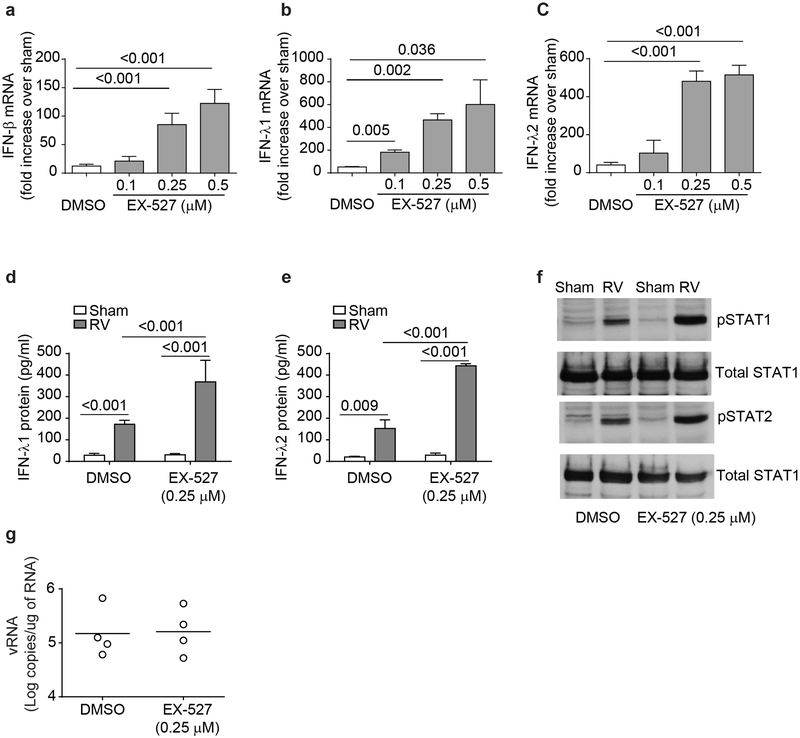
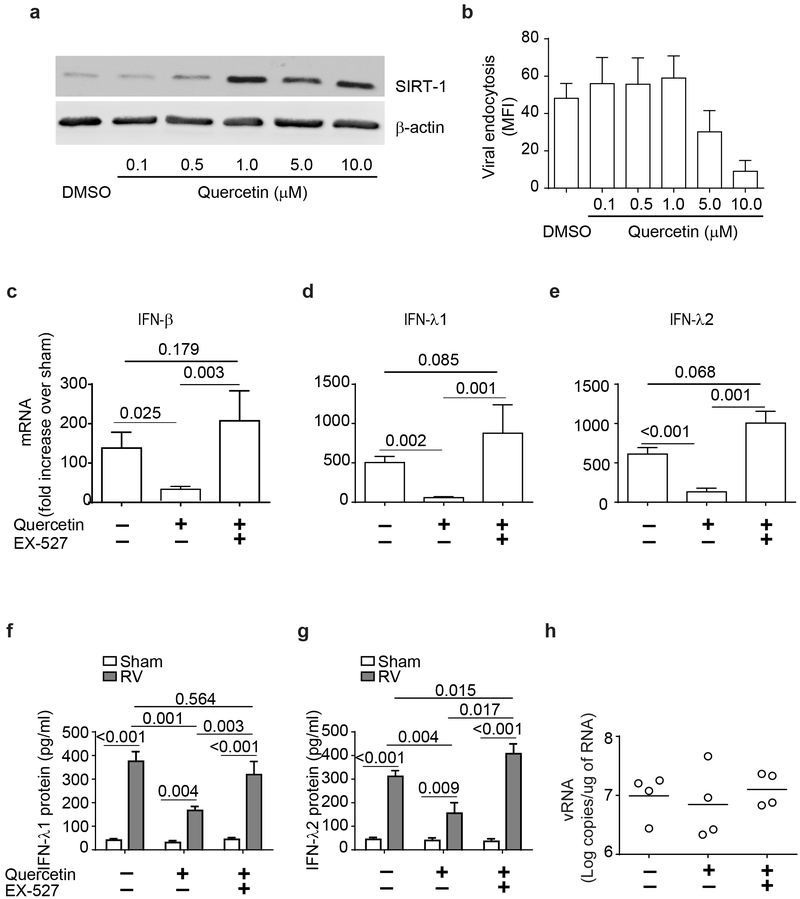
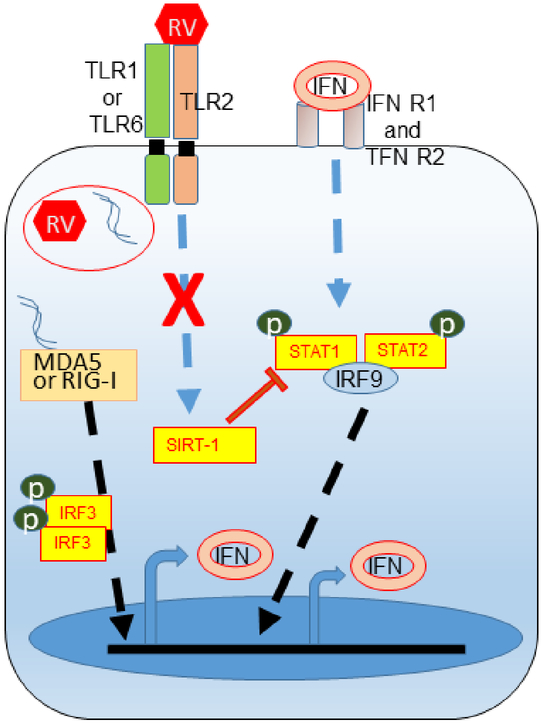
IFN responses to viral infection are necessary to establish intrinsic antiviral state, but if unchecked can lead to heightened inflammation. Recently, we showed that TLR2 activation contributes to limitation of rhinovirus (RV)-induced IFN response in the airway epithelial cells. We also demonstrated that compared with normal airway epithelial cells, those from patients with chronic obstructive pulmonary disease (COPD) show higher IFN responses to RV, but the underlying mechanisms are not known. Initially, RV-induced IFN responses depend on dsRNA receptor activation and then are amplified via IFN-stimulated activation of JAK/STAT signaling. In this study, we show that in normal cells, TLR2 limits RV-induced IFN responses by attenuating STAT1 and STAT2 phosphorylation and this was associated with TLR2-dependent SIRT-1 expression. Further, inhibition of SIRT-1 enhanced RV-induced IFN responses, and this was accompanied by increased STAT1/STAT2 phosphorylation, indicating that TLR2 may limit RV-induced IFN responses via SIRT-1. COPD airway epithelial cells showed attenuated IL-8 responses to TLR2 agonist despite expressing TLR2 similar to normal, indicating dysregulation in TLR2 signaling pathway. Unlike normal, COPD cells failed to show RV-induced TLR2-dependent SIRT-1 expression. Pretreatment with quercetin, which increases SIRT-1 expression, normalized RV-induced IFN levels in COPD airway epithelial cells. Inhibition of SIRT-1 in quercetin-pretreated COPD cells abolished the normalizing effects of quercetin on RV-induced IFN expression in these cells, confirming that quercetin exerts its effect via SIRT-1. In summary, we show that TLR2 is required for limiting RV-induced IFNs, and this pathway is dysregulated in COPD airway epithelial cells, leading to exaggerated IFN production.


Figures

Figure 1.
Figure 1.
COPD airway epithelial cells show attenuated IL-8 response to Pam3CSK4. Normal and COPD mucociliary-differentiated airway epithelial cell cultures established from airway basal cells isolated from 6 normal and 6 COPD donors were infected with sham or RV and after 24 h, IFN expression was determined by qPCR (a – c). Data was normalized to house-keeping gene, G3PDH, and expressed as fold increase over respective sham controls. Protein levels of IFNs was determined in the basolateral medium by ELISA (d and e). Viral load was determined by quantitative PCR using total RNA (f). In a parallel experiment, untreated normal and COPD airway epithelial cell cultures were used for determination of TLR2 expression at mRNA level by qPCR (g) or at protein level by flow cytometry (h). mRNA expression of TLR2 was normalized to G3PDH. Histograms in (h) are representative of 6 normal and 6 COPD cell cultures. Normal and COPD cell cultures were treated with Pam3CSK4 both apically and basolaterally, incubated for 24 hours and IL-8 was measured in the basolateral medium by ELISA (i). IL-8 protein was also determined by intracomparison to detect the attenuated responses to Pam3CSK4 in COPD cells (j). Data in a – g, i and j represent median with range and statistical significance was determined by using either Wilcoxon rank-sum test, (a, b, c, f, g, j), ANOVA on ranks (d and e) or sign rank test, paired comparison (i).
Figure 2.
Figure 2.
TLR2-regulated RV-induced IFNs is not due to dysregulation in MDA5 signaling pathway. BEAS-2B cells were either transfected with TLR2 or non-targeting (NT) siRNA, infected with sham or RV and incubated for 24 h and mRNA expression of IFNs was assessed by RT-qPCR (a – c). Data was normalized to G3PDH and expressed as fold change over sham-infected cells. Similarly infected cultures were lysed in RIPA buffer after 4h incubation, and cell lysates containing equal amounts of total protein were subjected to Western blot analysis with antibodies to MDA5 and β-actin (d) or phospho- and total IRF3 (e). Images are representative of 3 independent experiments. Total RNA from NT or TLR2 siRNA-transfected cells was subjected to RT-qPCR to determine the expression of TLR2 and the data normalized to G3PDH (f). Data in a – c, and f represent average ± SEM calculated from three independent experiments (t test).
Figure 3.
Figure 3.
TLR2 reduces RV-induced STAT phosphorylation. NT- or TLR2 siRNA-transfected cells were infected with RV or sham, and incubated for 24 h. Cell lysates containing equal amount of protein were subjected to Western blot analysis with antibodies to total or phospho-STAT1 or STAT2 antibodies. Images are representative of 3 to 4 independent experiments (a and b). Band intensities of total and phospho-STAT1 and STAT2 were determined by using NIH imageJ and expressed as ratio of phospho-STAT/total STAT (c and d). Data represents average ± SEM calculated from 3 to 4 independent experiments (ANOVA).
Figure 4.
Figure 4.
TLR2 contributes to expression of RV-induced SIRT-1 but not SOCS protein. NT- or TLR2 siRNA-transfected cells were infected with RV or sham, incubated for 24 h and cells were lysed in RIPA buffer. Cell lysates containing equal amounts of protein were subjected to Western blot analysis with antibodies to SOCS1, SOCS3, SIRT-1 and β-actin (a – c). Images are representative of 3 to 4 independent experiments. Intensity of the bands was determined by using imageJ and normalized to β-actin (d - f). Data represents average ± SEM calculated from 3 to 4 independent experiments (T test).
Figure 5.
Figure 5.
SIRT-1 knockout cells show exaggerated IFN responses to RV infection. Cell lysates from control or SIRT-1 knockout cells were subjected to Western blot analysis with SIRT-1 to confirm knockdown of SIRT-1 (a). SIRT-1 knockout or control cells were infected with RV and after 24h, mRNA expression of IFN-β, IFN-λ1 and IFN-λ2 was assessed by qPCR, IFN expression was normalized to G3PDH and then expressed as fold increase over sham (b – d). In some experiments, total proteins from Sham or RV-infected control and SIRT-1 knockout cells was subjected to Western blot analysis with total and phopho-STAT1 and STAT2 antibodies (e and f) and band intensities were quantified and expressed as ratio of phopho-STAT/total STAT (g and h). Images are representative of 4 independent experiments. Data represents average ± SEM calculated from 4 independent experiments (b – d, g and h). Data was analyzed by unpaired T test (b – d) or by ANOVA (g and h).
Figure 6.
Figure 6.
COPD airway epithelial cell cultures show defect in the expression of SIRT-1. Total protein was isolated from COPD or normal mucociliary-differentiated airway epithelial cell cultures and subjected to Western blot analysis with SIRT-1 antibody (a). Density of the SIRT-1 band was normalized to β-actin and presented as range with median (b). In some experiments, COPD and normal airway epithelial cell cultures were infected with sham or RV and incubated at 33°C for 24 h and the SIRT-1 protein expression was determined by Western blot analysis (c and d). Density of the SIRT-1 bands was normalized to β-actin and data represent intracomparison of SIRT-1 expression between sham and RV-infected cells for each culture (d). Images in a is representative of cultures established from 6 independent donors from each group. The data in b represent range with median and statistical significance was determined by using Wilcoxon rank-sum test. Data in d was analyzed by paired analysis using sign rank test.
Figure 7.
Figure 7.
TLR2 is required for RV-induced SIRT-1 expression in primary airway epithelial cell cultures. Normal basal airway epithelial cells were transduced with non-targeting (NT) or TLR2 shRNA expressing lentivector and cultured at air/liquid interface to promote mucociliary differentiation. Cell cultures were then apically infected with RV or sham and SIRT-1 expression was determined at 24 h post infection by Western blot analysis (a). Image is representative of 3 independent experiments). Data was normalized to β-actin and data presented represent mean ± SEM calculated from 3 independent experiments and statistical significance was determined by T test within each group (b). From a parallel experiments, total RNA was isolated and subjected to qPCR to determine the expression of TLR2 (c). Data represent mean ± SEM calculated from 3 independent experiments and data was analyzed by T test.
Figure 8.
Figure 8.
Inhibition of SIRT-1 enhances RV-induced IFN responses in normal airway epithelial cells. Normal mucociliary-differentiated cell cultures were pretreated with EX-527 for 24 h, infected with sham or RV and then incubated in the presence or absence of EX-527 for another 24 h. Total RNA was isolated and subjected to qPCR to determine mRNA expression of IFNs (a - c). Protein levels of IFNs in the basolateral medium was assessed by ELISA (d and e). From some experiments, total protein was isolated and subjected to Western blot analysis with total and phospho-STAT1 and STAT2 antibodies (f). Image is representative of 4 independent experiments. Viral load was determined by quantitative RT-qPCR and data represent range with median from 4 experiments (g). Data in a - e represent mean ± SEM calculated from 4 independent experiments and statistical significance was determined by ANOVA.
Figure 9.
Figure 9.
Quercetin treatment reduces RV-induced IFN expression via SIRT-1. Mucociliary-differentiated COPD airway epithelial cell cultures were treated with varying concentrations of quercetin for 24 h and SIRT-1 expression and viral endocytosis was determined by Western blot analysis and Flow cytometry respectively (a and b). COPD airway epithelial cell cultures were pretreated with 1 μM quercetin for 24 h, infected with sham or RV, incubated for 24 h in the presence or absence of EX-527and mRNA expression of IFNs was determined. Data was normalized to G3PDH and then expressed as fold increase over sham (c - e). Basolateral medium was analyzed by ELISA to determine the protein levels of IFNs (f and g). Viral load was determined by quantitative RT-qPCR and data represent range with median (h). Data represents mean ± SEM calculated from 4 independent experiments (a – e) and statistical significance analyzed by ANOVA.
Figure 10.
Figure 10.
Illustration showing defective mechanisms in COPD airway epithelial cells that leads to exaggerated IFN responses to RV infection In normal cells RV-induced TLR2 signaling induces SIRT-1 activation, which in turn limits amplification of RV-stimulated IFN expression by inhibiting JAK/STAT pathway. COPD cells are defective in both TLR2 signaling and expression of SIRT-1 which leads to excessive amplification of RV-induced IFN expression.

References

    1. Wilkinson TMA, Aris E, Bourne S, Clarke SC, Peeters M, Pascal TG, Schoonbroodt S, Tuck AC, Kim V, Ostridge K, Staples KJ, Williams N, Williams A, Wootton S, Devaster JM, and Group AS. 2017. A prospective, observational cohort study of the seasonal dynamics of airway pathogens in the aetiology of exacerbations in COPD. Thorax 72: 919–927. - PMC - PubMed
    1. Mallia P, Message SD, Gielen V, Contoli M, Gray K, Kebadze T, Aniscenko J, Laza-Stanca V, Edwards MR, Slater L, Papi A, Stanciu LA, Kon OM, Johnson M, and Johnston SL. 2011. Experimental rhinovirus infection as a human model of chronic obstructive pulmonary disease exacerbation. Am J Respir Crit Care Med 183: 734–742. - PMC - PubMed
    1. Schneider D, Ganesan S, Comstock AT, Meldrum CA, Mahidhara R, Goldsmith AM, Curtis JL, Martinez FJ, Hershenson MB, and Sajjan U. 2010. Increased cytokine response of rhinovirus-infected airway epithelial cells in chronic obstructive pulmonary disease. Am J Respir Crit Care Med 182: 332–340. - PMC - PubMed
    1. Wang Q, Nagarkar DR, Bowman ER, Schneider D, Gosangi B, Lei J, Zhao Y, McHenry CL, Burgens RV, Miller DJ, Sajjan U, and Hershenson MB. 2009. Role of double-stranded RNA pattern recognition receptors in rhinovirus-induced airway epithelial cell responses. J Immunol 183: 6989–6997. - PMC - PubMed
    1. Farazuddin M, Mishra R, Jing Y, Srivastava V, Comstock AT, and Sajjan US. 2018. Quercetin prevents rhinovirus-induced progression of lung disease in mice with COPD phenotype. PLoS One 13: e0199612. - PMC - PubMed

Publication types

MeSH terms