

Regional epigenetic differentiation of the Z Chromosome between sexes in a female heterogametic system
- PMID: 31548356
- PMCID: PMC6771406
- DOI: 10.1101/gr.248641.119
Regional epigenetic differentiation of the Z Chromosome between sexes in a female heterogametic system
Abstract
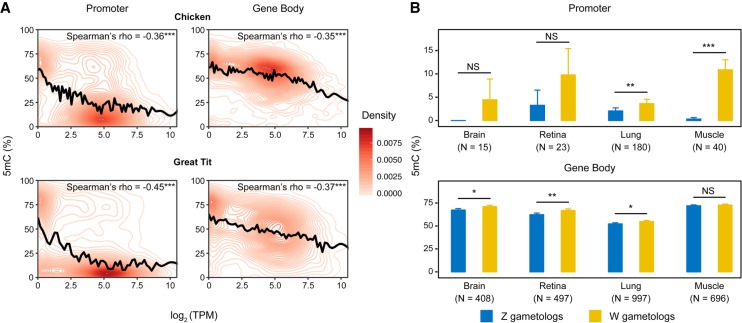
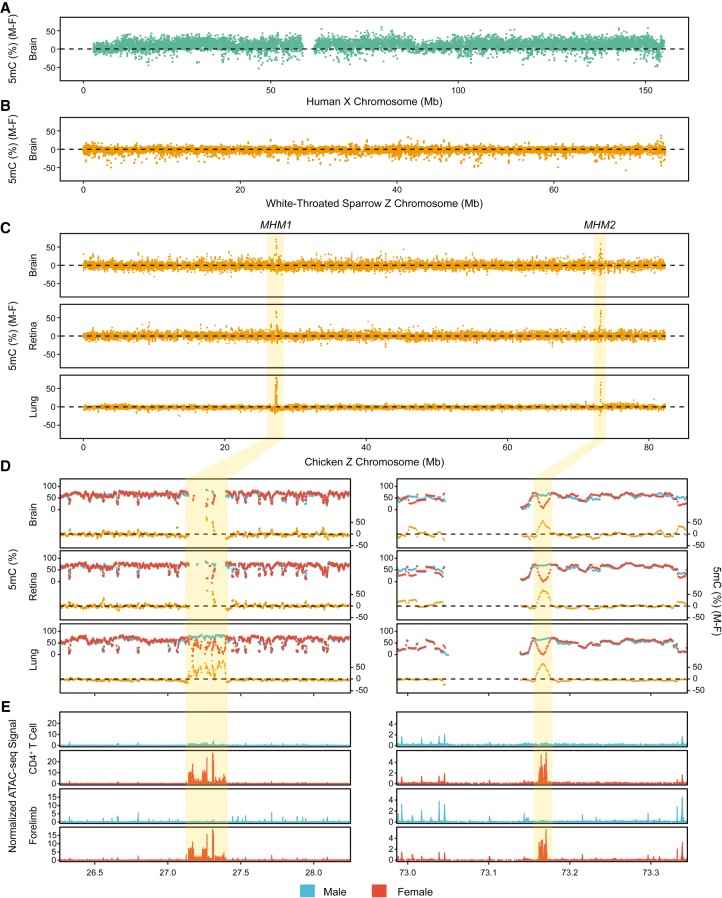
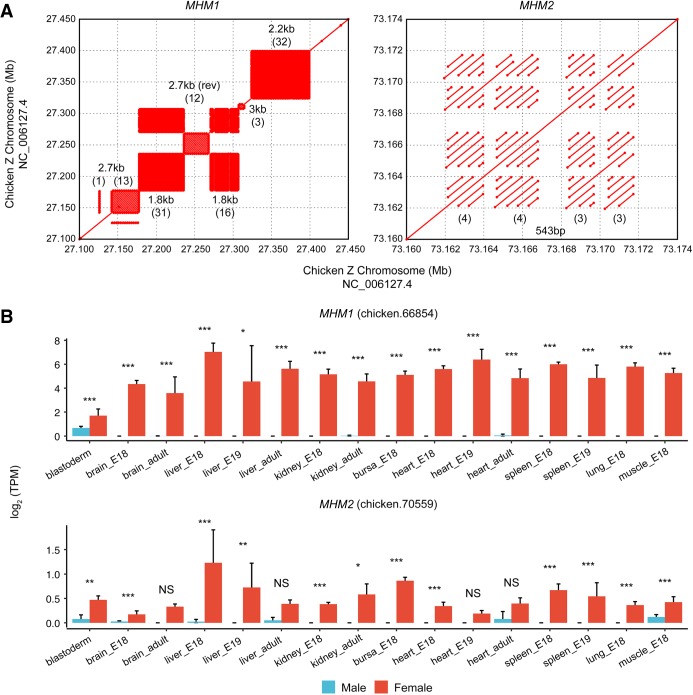
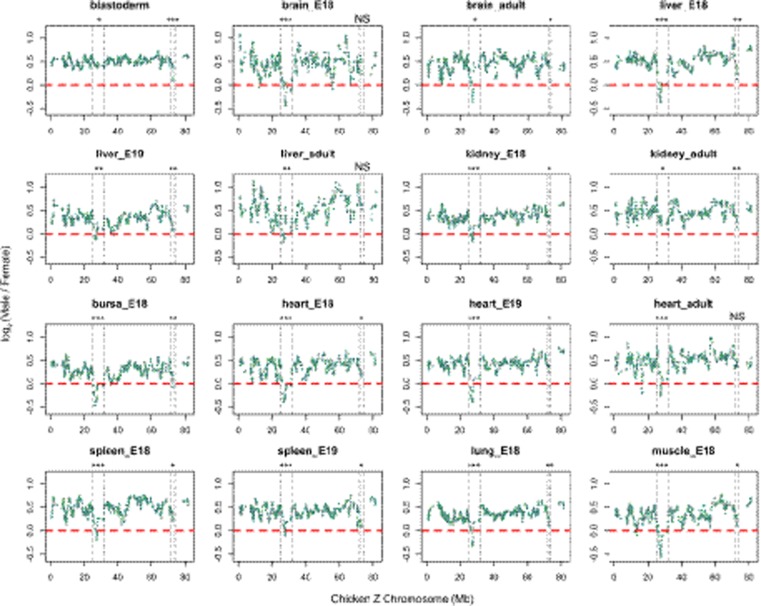
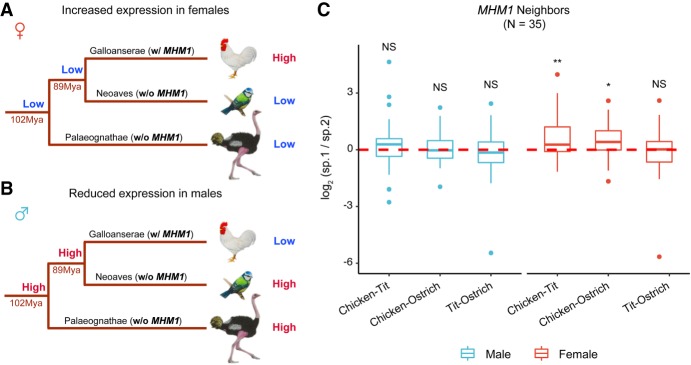
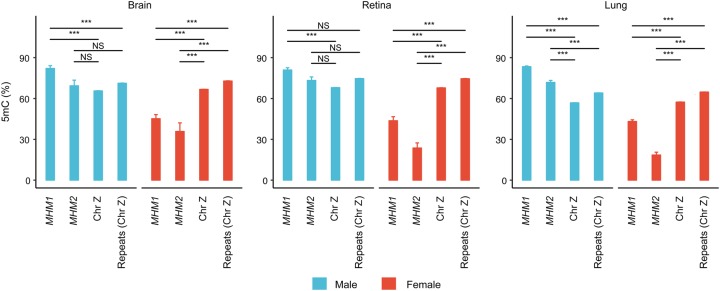
In male heterogametic systems, the X Chromosome is epigenetically differentiated between males and females, to facilitate dosage compensation. For example, the X Chromosome in female mammals is largely inactivated. Relative to well-studied male heterogametic systems, the extent of epigenetic differentiation between male and female Z Chromosomes in female heterogametic species, which often lack complete dosage compensation, is poorly understood. Here, we examined the chromosomal DNA methylation landscapes of male and female Z Chromosomes in two distantly related avian species, namely chicken and white-throated sparrow. We show that, in contrast to the pattern in mammals, male and female Z Chromosomes in these species exhibit highly similar patterns of DNA methylation, which is consistent with weak or absent dosage compensation. We further demonstrate that the epigenetic differences between male and female chicken Z Chromosomes are localized to a few regions, including a previously identified male hypermethylated region 1 (MHM1; CGNC: 80601). We discovered a novel region with elevated male-to-female methylation ratios on the chicken Z Chromosome (male hypermethylated region 2 [MHM2]; CGNC: 80602). The MHM1 and MHM2, despite little sequence similarity between them, bear similar molecular features that are likely associated with their functions. We present evidence consistent with female hypomethylation of MHMs and up-regulation of nearby genes. Therefore, despite little methylation differentiation between sexes, extremely localized DNA methylation differences between male and female chicken Z Chromosomes have evolved and affect expression of nearby regions. Our findings offer new insights into epigenetic regulation of gene expression between sexes in female heterogametic systems.
© 2019 Sun et al.; Published by Cold Spring Harbor Laboratory Press.
Figures
Similar articles
-
Allele-Specific Expression Analysis Does Not Support Sex Chromosome Inactivation on the Chicken Z Chromosome.Genome Biol Evol. 2017 Mar 1;9(3):619-626. doi: 10.1093/gbe/evx031. Genome Biol Evol. 2017. PMID: 28391319 Free PMC article.
-
Evolution of dosage compensation under sexual selection differs between X and Z chromosomes.Nat Commun. 2015 Jul 27;6:7720. doi: 10.1038/ncomms8720. Nat Commun. 2015. PMID: 26212613 Free PMC article.
-
Sex bias and dosage compensation in the zebra finch versus chicken genomes: general and specialized patterns among birds.Genome Res. 2010 Apr;20(4):512-8. doi: 10.1101/gr.102343.109. Epub 2010 Mar 31. Genome Res. 2010. PMID: 20357053 Free PMC article.
-
The W, X, Y and Z of sex-chromosome dosage compensation.Trends Genet. 2009 May;25(5):226-33. doi: 10.1016/j.tig.2009.03.005. Epub 2009 Apr 8. Trends Genet. 2009. PMID: 19359064 Free PMC article. Review.
-
Dosage compensation in mammals.Cold Spring Harb Perspect Biol. 2015 Mar 2;7(3):a019406. doi: 10.1101/cshperspect.a019406. Cold Spring Harb Perspect Biol. 2015. PMID: 25731764 Free PMC article. Review.
Cited by
-
Whole-genome DNA methylomes of Tree shrew brains reveal conserved and divergent roles of DNA methylation on sex chromosome regulation.bioRxiv [Preprint]. 2024 Jun 6:2024.06.05.597676. doi: 10.1101/2024.06.05.597676. bioRxiv. 2024. Update in: BMC Biol. 2024 Nov 28;22(1):277. doi: 10.1186/s12915-024-02071-0. PMID: 38895372 Free PMC article. Updated. Preprint.
-
The Female-Specific W Chromosomes of Birds Have Conserved Gene Contents but Are Not Feminized.Genes (Basel). 2020 Sep 25;11(10):1126. doi: 10.3390/genes11101126. Genes (Basel). 2020. PMID: 32992746 Free PMC article.
-
Assembly of female and male hihi genomes (stitchbird; Notiomystis cincta) enables characterization of the W chromosome and resources for conservation genomics.Mol Ecol Resour. 2025 Jul;25(5):e13823. doi: 10.1111/1755-0998.13823. Epub 2023 Jun 18. Mol Ecol Resour. 2025. PMID: 37332137 Free PMC article.
-
Koala methylomes reveal divergent and conserved DNA methylation signatures of X chromosome regulation.Proc Biol Sci. 2021 Feb 24;288(1945):20202244. doi: 10.1098/rspb.2020.2244. Epub 2021 Feb 24. Proc Biol Sci. 2021. PMID: 33622136 Free PMC article.
-
Dosage compensation of Z sex chromosome genes in avian fibroblast cells.Genome Biol. 2023 Sep 20;24(1):213. doi: 10.1186/s13059-023-03055-z. Genome Biol. 2023. PMID: 37730643 Free PMC article.
References
-
- Ayers KL, Davidson NM, Demiyah D, Roeszler KN, Grützner F, Sinclair AH, Oshlack A, Smith CA. 2013. RNA sequencing reveals sexually dimorphic gene expression before gonadal differentiation in chicken and allows comprehensive annotation of the W-chromosome. Genome Biol 14: R26 10.1186/gb-2013-14-3-r26 - DOI - PMC - PubMed
Publication types
MeSH terms
Associated data
Grants and funding
LinkOut - more resources
Full Text Sources