. 2019 Oct 8;116(41):20411-20417.
doi: 10.1073/pnas.1909021116. Epub 2019 Sep 23.

Intragenomic variability and extended sequence patterns in the mutational signature of ultraviolet light

Affiliations

Intragenomic variability and extended sequence patterns in the mutational signature of ultraviolet light

Markus Lindberg et al. Proc Natl Acad Sci U S A. .

Abstract

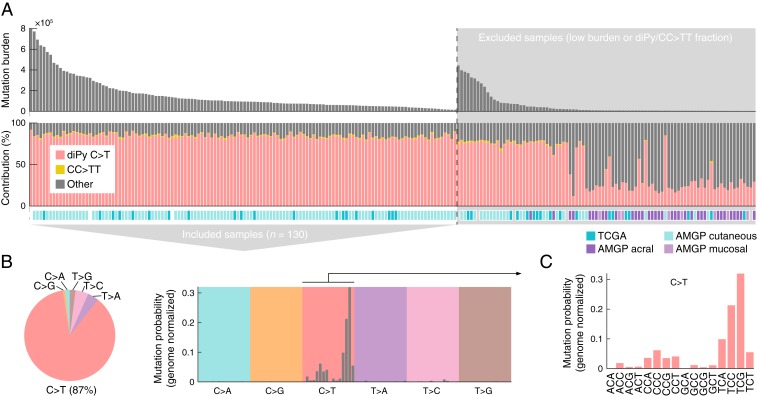
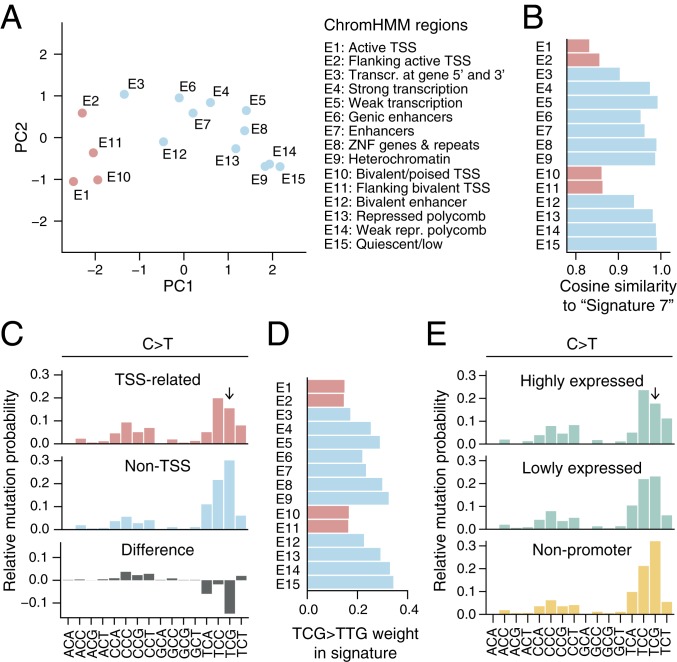
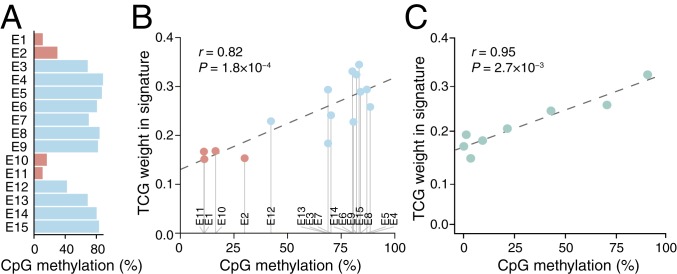
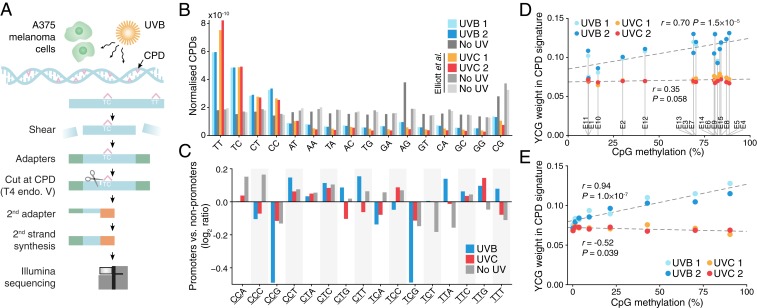
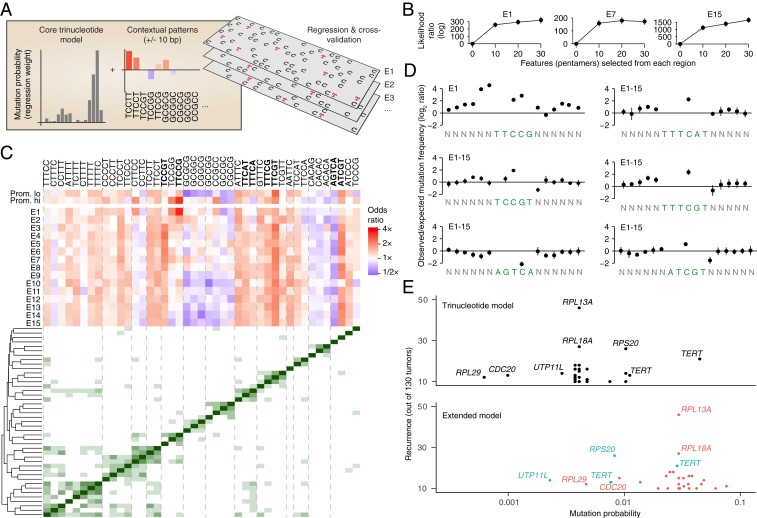
Mutational signatures can reveal properties of underlying mutational processes and are important when assessing signals of selection in cancer. Here, we describe the sequence characteristics of mutations induced by ultraviolet (UV) light, a major mutagen in several human cancers, in terms of extended (longer than trinucleotide) patterns as well as variability of the signature across chromatin states. Promoter regions display a distinct UV signature with reduced TCG > TTG transitions, and genome-wide mapping of UVB-induced DNA photoproducts (pyrimidine dimers) showed that this may be explained by decreased damage formation at hypomethylated promoter CpG sites. Further, an extended signature model encompassing additional information from longer contextual patterns improves modeling of UV mutations, which may enhance discrimination between drivers and passenger events. Our study presents a refined picture of the UV signature and underscores that the characteristics of a single mutational process may vary across the genome.

Keywords: DNA damage; UV; cancer genomics; mutational signature; pyrimidine dimer.


Conflict of interest statement

The authors declare no conflict of interest.

Figures

Fig. 1.
Fig. 1.
A whole-genome compendium of somatic mutations predominantly induced by UV light. (A) Whole genome somatic mutation data from 221 melanomas was initially assembled from earlier studies (16, 17) and a subset of 130 samples with high burden (≥10.000 mutations) and with a high fraction (≥80%) of mutations having characteristics of UV photoproduct formation (C > T in a dipyrimidine context or CC > TT) were included for further study. AMPG, Australian Melanoma Genome Project. (B) SNVs (n = 19.7 × 10⁶) in the final dataset are predominantly C > T. (C) Trinucleotide signature (genome normalized) for included SNVs show mutations primarily at dipyrimidines, characteristic of mutations arising from UV photoproduct formation.
Fig. 2.
Fig. 2.
Variation in the UV trinucleotide signature across chromatin states. (A) PCA plot of trinucleotide signatures across 15 ChromHMM chromatin states (19). TSS-related regions are indicated in red. (B) Similarity (cosine) to the canonical UV signature, “Signature 7” (5), for each genomic region. (C) Pooled C > T trinucleotide signature (local genome normalized) for the TSS-related regions (E1, E2, E10, and E11; red) and remaining non-TSS regions (blue), revealing a reduced mutation rate at TCG (arrow) in the former. The difference between the two is shown in gray. Frequencies are normalized to sum to 1. (D) The C > T substitution frequency at TCG (weight in normalized signature) varies across ChromHMM regions and is reduced in TSS-related states. (E) Trinucleotide signature in promoters (500 bp upstream regions) of highly (upper 25%) compared to lowly (lower 25%) expressed genes, with TCG > TTG substitution rate (arrow) being more reduced in the former category. The promoter sets were selected from 20,017 annotated coding genes.
Fig. 3.
Fig. 3.
UV trinucleotide signature in promoters vary with methylation. (A) Extensive variability in CpG methylation across ChromHMM chromatin states. (B) Positive correlation between methylation level and the weight of TCG > TTG substitutions in the trinucleotide signature (local genome normalized) across chromatin states. (C) The weight of TCG > TTG substitutions in the trinucleotide signature of promoters varies positively with methylation level. Annotated coding gene promoters with sufficient bisulfite coverage (n = 12,239) were divided into 10 methylation level bins (the first three, all representing 0%, were merged into one; x axis indicates average methylation). Pearson’s correlation coefficients across regions/bins are indicated in B and C.
Fig. 4.
Fig. 4.
Genome-wide mapping of UVB-induced pyrimidine dimers reveals reduced DNA damage in promoters with reduced CpG methylation. (A) Simplified protocol overview for genome-wide mapping of CPDs induced by UVB in A375 human melanoma cells. Cells were treated with 10,000 J/m2 UVB (310 nm), and DNA was harvested immediately for analysis. (B) Genome-wide CPDs counts for all dinucleotides, normalized with respect to genomic dinucleotide counts and library size, showing preferable detection at dipyrimidines as expected. UVC results from Elliott et al. (15) were included for comparison. (C) Reduced UVB-induced DNA damage at YCG sites in promoters. Comparison of the CPD trinucleotide signature (relative formation frequency per genomic site) in highly expressed promoters compared to nonpromoter regions, expressed as a log2 ratio. Examined patterns include one additional 3ʹ base following the CPD-forming dipyrimidine (underscored) in all possible combinations, to enable comparison between CpG- and non-CpG–adjacent sites. Results are shown for UVB, UVC, and no-UV controls. (D) CPD frequency at YCG (weight in CPD trinucleotide signature) increases with increasing CpG methylation across ChromHMM regions, specifically for UVB. (E) CPD frequency at YCG increases with increasing CpG methylation across annotated promoters, specifically for UVB. Bins were defined as in Fig. 3C. Pearson’s correlation coefficients across regions/bins are indicated in D and E.
Fig. 5.
Fig. 5.
A regression-based signature model reveals extended patterns that are informative of UV mutagenesis in addition to trinucleotides. (A) UV mutations (C > T subset) were modeled using logistic regression, taking into account standard trinucleotide patterns as well as presence/absence of longer pentamer patterns occurring anywhere within ±10 bp of a given position. Signature models were built repeatedly for each the 15 ChromHMM regions as well promoters (high/low expression), based on 0.5 Mb randomly sampled positions from each region and using a common set of pentamer features (Materials and Methods). (B) Modeling of observed mutations is improved when long features are considered (all regions shown in SI Appendix, Fig. S4). Ten 0.5-Mb random subsets were evaluated for each region. Log likelihood ratios relative a standard trinucleotide model (zero long features) are shown (bars indicate SD). (C, Upper) Heatmap: influence (odds ratio) of different pentamer patterns on mutation probability (blue, stimulatory; red, attenuating) across interrogated regions. Pentamers with low regression weights were excluded for visualization, leaving 43/61 patterns included during feature selection (union of top 20 patterns from each ChromHMM region; Materials and Methods). (C, Lower) Distance matrix and clustering dendrogram: co-occurrence patterns linking pentamers together into longer motifs. Dashed lines delineate notable clusters. Bold mark patterns highlighted in D. (D) Positional distribution of mutations across select patterns from A (either individual pentamers or aggregated from multiple pentamers forming a longer consensus motif, as indicated by clustering). Frequencies were normalized to trinucleotide-based expectations given by the underlying sequences. (E) Probability of mutagenesis at promoter mutation hotspots (recurrent bases within 500 bp upstream of a TSS) in melanoma, as given by a simple trinucleotide model (Upper) or the extended model (trinucleotide core model plus longer patterns; Lower). Locally derived models from corresponding ChromHMM regions were used for all mutations. Recurrence is indicated on the y axis (n ≥ 10). Colors indicate whether probabilities are up (red) or down (blue) in the extended compared to the trinucleotide model.

References

    1. Alexandrov L. B., Stratton M. R., Mutational signatures: The patterns of somatic mutations hidden in cancer genomes. Curr. Opin. Genet. Dev. 24, 52–60 (2014). - PMC - PubMed
    1. Secrier M., et al. ; Oesophageal Cancer Clinical and Molecular Stratification (OCCAMS) Consortium , Mutational signatures in esophageal adenocarcinoma define etiologically distinct subgroups with therapeutic relevance. Nat. Genet. 48, 1131–1141 (2016). - PMC - PubMed
    1. Ma J., Setton J., Lee N. Y., Riaz N., Powell S. N., The therapeutic significance of mutational signatures from DNA repair deficiency in cancer. Nat. Commun. 9, 3292 (2018). - PMC - PubMed
    1. Ding L., Wendl M. C., McMichael J. F., Raphael B. J., Expanding the computational toolbox for mining cancer genomes. Nat. Rev. Genet. 15, 556–570 (2014). - PMC - PubMed
    1. Alexandrov L. B., et al. ; Australian Pancreatic Cancer Genome Initiative; ICGC Breast Cancer Consortium; ICGC MMML-Seq Consortium; ICGC PedBrain , Signatures of mutational processes in human cancer. Nature 500, 415–421 (2013). - PMC - PubMed

Publication types

Substances