. 2019 Oct 8;116(41):20743-20749.
doi: 10.1073/pnas.1908058116. Epub 2019 Sep 23.

A Tmc1 mutation reduces calcium permeability and expression of mechanoelectrical transduction channels in cochlear hair cells

Affiliations

A Tmc1 mutation reduces calcium permeability and expression of mechanoelectrical transduction channels in cochlear hair cells

Maryline Beurg et al. Proc Natl Acad Sci U S A. .

Abstract

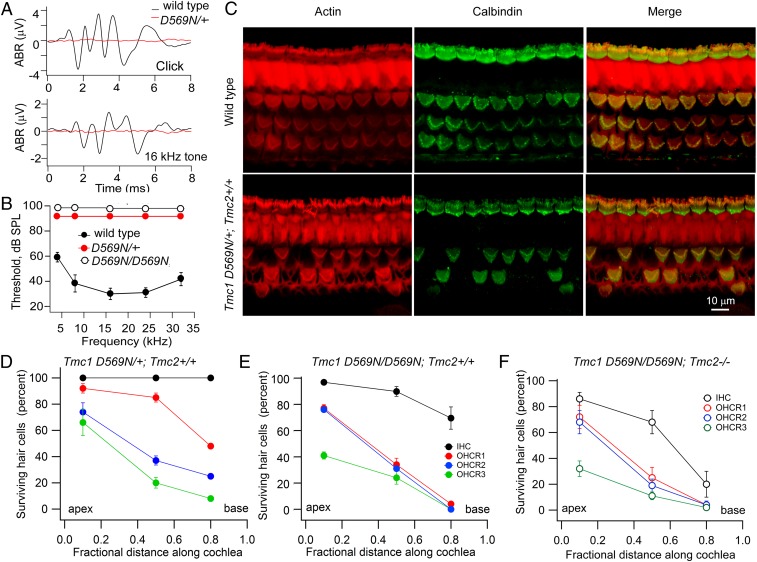
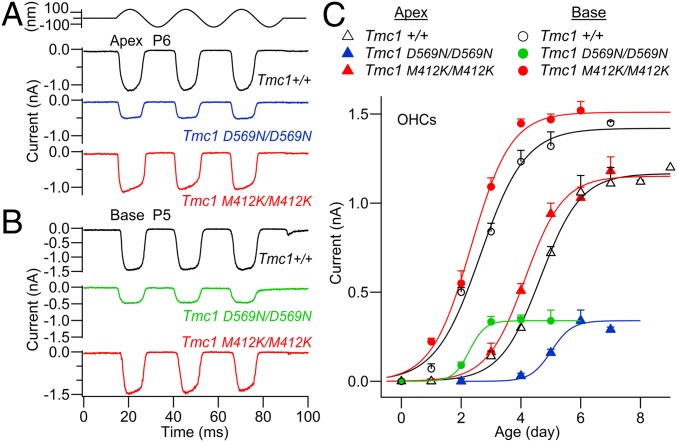
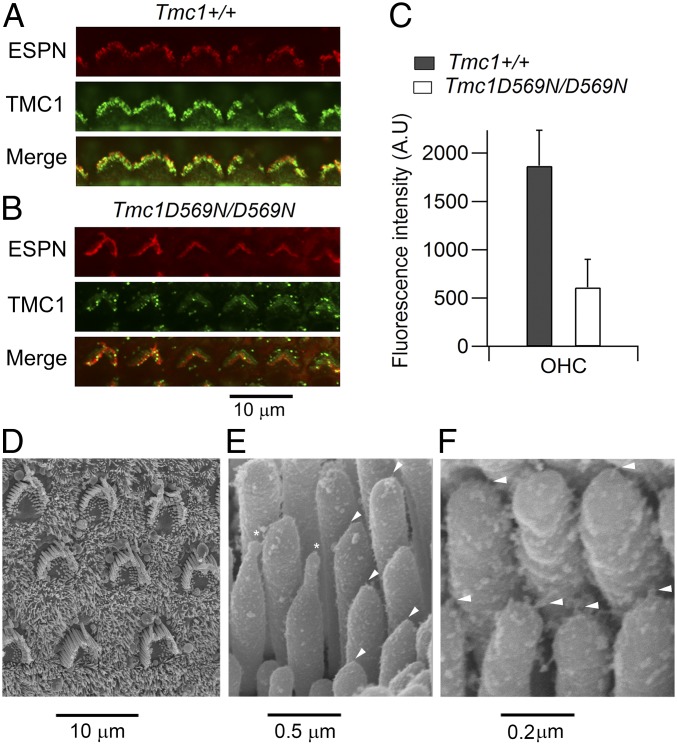
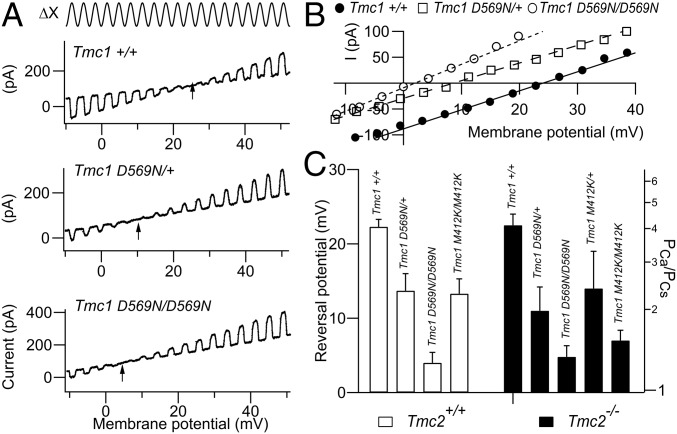
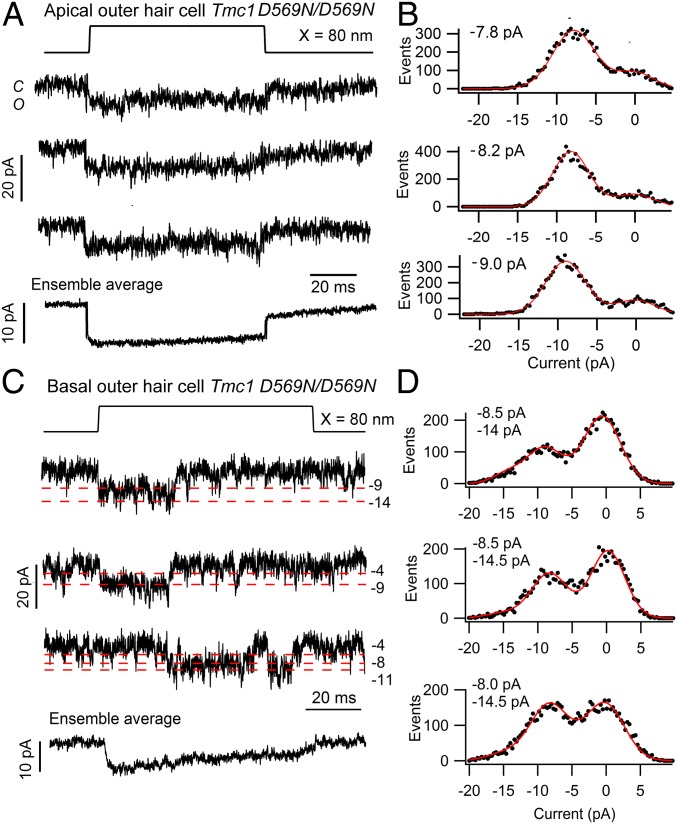
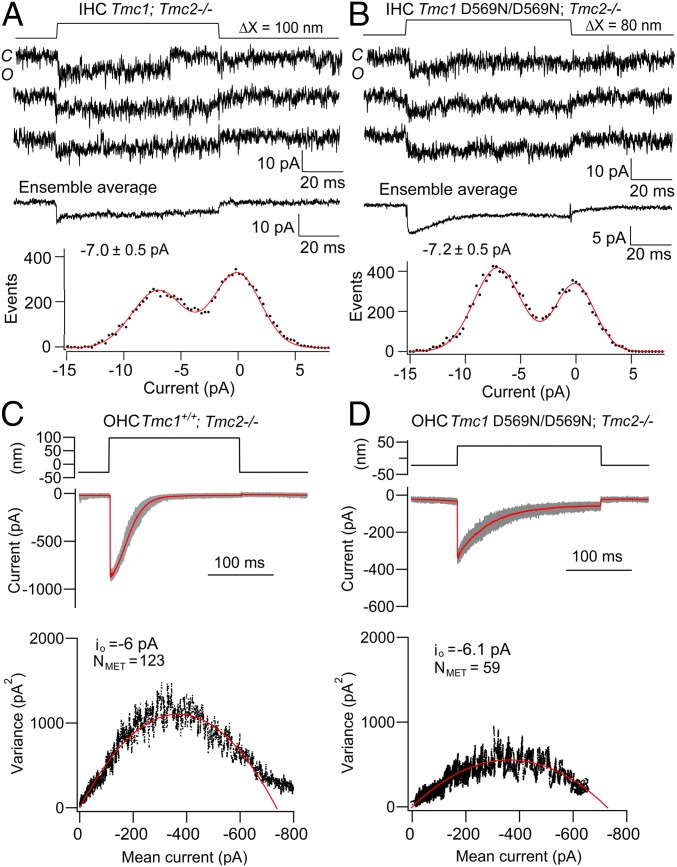
Mechanoelectrical transducer (MET) currents were recorded from cochlear hair cells in mice with mutations of transmembrane channel-like protein TMC1 to study the effects on MET channel properties. We characterized a Tmc1 mouse with a single-amino-acid mutation (D569N), homologous to a dominant human deafness mutation. Measurements were made in both Tmc2 wild-type and Tmc2 knockout mice. By 30 d, Tmc1 pD569N heterozygote mice were profoundly deaf, and there was substantial loss of outer hair cells (OHCs). MET current in OHCs of Tmc1 pD569N mutants developed over the first neonatal week to attain a maximum amplitude one-third the size of that in Tmc1 wild-type mice, similar at apex and base, and lacking the tonotopic size gradient seen in wild type. The MET-channel Ca2+ permeability was reduced 3-fold in Tmc1 pD569N homozygotes, intermediate deficits being seen in heterozygotes. Reduced Ca2+ permeability resembled that of the Tmc1 pM412K Beethoven mutant, a previously studied semidominant mouse mutation. The MET channel unitary conductance, assayed by single-channel recordings and by measurements of current noise, was unaffected in mutant apical OHCs. We show that, in contrast to the Tmc1 M412K mutant, there was reduced expression of the TMC1 D569N channel at the transduction site assessed by immunolabeling, despite the persistence of tip links. The reduction in MET channel Ca2+ permeability seen in both mutants may be the proximate cause of hair-cell apoptosis, but changes in bundle shape and protein expression in Tmc1 D569N suggest another role for TMC1 apart from forming the channel.

Keywords: cochlea; deafness; hair cell; mechanotransducer channel; transmembrane channel-like protein.


Conflict of interest statement

The authors declare no conflict of interest.

Figures

Fig. 1.
Fig. 1.
Deafness and hair-cell loss in Tmc1 p.D569N mutants. (A) Acoustic brainstem responses (ABRs) in P30 Tmc1 wild-type and P30 Tmc1 D569N/+; Tmc2+/+ mice for 80-dB clicks and 80-dB 16-kHz tones. (B) Mean threshold for tone stimuli versus frequency in 5 wild-type mice, 4 Tmc1 D569N/+; Tmc2+/+ mice, and 3 Tmc1 D569N/D569N; Tmc2+/+ mice. For both p.D569N mutants no response was evident at 95 dB sound pressure level. (C) Middle turn cochleas labeled with phalloidin (red) and calbindinD-28k antibody (green) for P30 Tmc1 wild-type (Top) and Tmc1 pD569N/+; Tmc2+/+ mice (Bottom) showing OHC loss in a heterozygote. (D) Surviving hair cells (percent) at 3 cochlear locations for IHC (black), and OHC stereociliary row 1 (R1, red), stereociliary row 2 (R2, blue), and stereociliary row 3 (R3, green) of P30 Tmc1 D569N/+; Tmc2+/+. (E) Percentage of survival at 3 cochlear locations for IHC (black), row 1 (red), row 2 (blue), and row 3 (green) OHCs of P30 Tmc1 D569N/D569N; Tmc2+/+. (F) Percentage of survival at 3 cochlear locations for IHC (black), and OHC stereociliary row 1 (R1, red), stereociliary row 2 (R2, blue), and stereociliary row 3 (R3, green) of P30 Tmc1 D569N/D569N; Tmc2-/-. In DF, mean ± SD of 300 cells in 3 mice.
Fig. 2.
Fig. 2.
MET currents in OHCs of Tmc1 D569N; Tmc2−/− and Tmc1 M412K; Tmc2−/− mice. (A) Examples of maximal MET currents in apical OHCs of Tmc1+/+, Tmc1 D569N/D569N, and Tmc1 M412K/M412K at P6. (B) Maximal MET currents in basal OHCs of Tmc1+/+ and Tmc1 D569N/D569N and Tmc1 M412K/M412K at P5. At both cochlear locations, the maximal MET current is smaller in D569N. (C) Development of MET current (mean ± SEM) with postnatal age. Number of OHCs with points of increasing age—Tmc1+/+Tmc2−/−: base, open circles, 4, 5, 5, 4, 4, 3; Tmc1+/+Tmc2−/−: apex, open triangles, 3, 3, 3, 5, 7, 5, 6, 3; Tmc1 M412K/M412K; Tmc2−/−: base, red circles, 3, 3, 4, 4, 5, 2; Tmc1 M412K/M412K; Tmc2−/−: apex, red triangles, 2, 5, 11, 9, 10, 6; Tmc1 D569N/D569N; Tmc2−/−: base, green circles, 2, 4, 5, 7, 4; and Tmc1 D569N/D569N; Tmc2−/−: apex, blue triangles, 3, 3, 6, 9, 5.
Fig. 3.
Fig. 3.
TMC1 expression and OHC bundle shape in the D569N mutant. (A) Immunolabeling for TMC1 in the apical region of a P7 Tmc1+/+; Tmc2−/− mouse cochlea. One row of OHCs is shown, the bundle structure (red fluorescence) revealed by an antibody against the actin cross-linker ESPN. (B) Immunolabeling in the apical region of a P7 Tmc1 p.D569N/D569N; Tmc2−/− mouse cochlea, showing reduced TMC1 expression. (C) Quantification of fluorescence (mean ± SD) evaluated form 24 OHCs in each of 2 mice of each strain. TMC1 label is reduced 3.1-fold from 1,870 to 611 counts (t test, P < 0.0001). (D) Scanning electron micrograph of apical OHC bundles in a P7 Tmc1 p.D569N/D569N; Tmc2−/− mouse cochlea. (E) Scanning electron micrograph of OHC stereocilia from P7 Tmc1 p.D569N/D569N; Tmc2−/− mouse cochlear apex; arrowheads indicate tip links, and asterisks denote 2 distorted stereocilia with unusual elongated tips. (F) Higher power of OHC stereocilia in Tmc1 p.D569N/D569N; Tmc2−/− mutant showing persistence of tip links (arrowheads).
Fig. 4.
Fig. 4.
MET channel Ca2+ permeability of apical OHCs in Tmc1 mutants. (A) Ca2+ permeability determined from reversal potential (arrow) for continuous sinusoidal hair bundle stimulation (Top) during membrane potential sweeps from −50 to +50 mV: Tmc1+/+; Tmc2−/−; Tmc1 pD569N/+; Tmc2−/−; and Tmc1 p.D569N/D569N; Tmc2−/− mice. Note the negative shift in reversal potential (arrows) in the mutants. (B) Current–voltage relationships for 3 TMC1 variants from A. (C) Collected results of reversal potential and calculated PCa/PCs (mean ± SEM) for Tmc1+/+, Tmc1 p.D569N, and Tmc1 p.M412K in a Tmc2+/+ background (open bars) and Tmc2−/− background (filled bars). Numbers of OHCs measured, from left to right—Tmc2+/+: 5, 3, 6, 12 and Tmc2−/−: 10, 4, 7, 10, 10. Note reduced Ca2+ permeability in homozygotes and intermediate reduction in heterozygotes in both mutants. All measurements on P7 mice.
Fig. 5.
Fig. 5.
Single MET channel currents in apical and basal OHCs of Tmc1 pD569N/D569N; Tmc2−/− mice. (A) Three examples of single-channel records. (Bottom) The ensemble average current of 100 stimuli for a P5 apical OHC. (B) Amplitude histograms for each trace shown in A were fit with single Gaussians, giving channel amplitudes of −7.8, −8.2, and −9.0 pA. (C) Single-channel records and ensemble average of 30 presentations for a P4 basal OHC; red dashed lines indicate multiple current levels (pA). (D) Amplitude histograms for each trace shown in C were fit with single Gaussians, giving channel amplitudes of −8.5 and −14 pA; −8.5 and −14.5 pA; and −7.7 and −14.5 pA. The components at −14 or −14.5 pA were included in the fitting, but the other levels were too small to appear in the histograms. In both apical and basal hair cells, the extracellular Ca2+ around the bundle was 0.04 mM, and the holding potential was −84 mV.
Fig. 6.
Fig. 6.
Single MET channel current amplitudes are unaltered in hair cells of Tmc1 p.D569N/D569N mice. (A) Single-channel records in the Tmc1+/+; Tmc2−/− mouse, ensemble average of 40 stimuli, and amplitude histogram with channel of −6.9 pA. (B) Single-channel records, ensemble average of 100 presentations, and amplitude histogram of Tmc1 p.D569N/D569N; Tmc2−/− with channel of −7.1 pA. A and B are for P6 mouse apical IHCs. (C) OHC MET currents in the Tmc1+/+; Tmc2−/− mouse with mean current (red) with individual responses (gray) for 50 stimuli superimposed. (Bottom) Plot of current variance σI2 versus current amplitude I, fit with parabolic equation (Materials and Methods) giving single-channel current io = −6.0 pA and number of channels NMET = 123. (D) OHC MET currents in Tmc1 p.D569N/D569N; Tmc2−/− mouse with mean current (red) with individual responses (gray) for 40 stimuli superimposed. (Bottom) Plot of current variance σI2 versus current I, gives io = −6.1 pA) and NMET = 59. C and D are for P6 mouse apical OHCs; extracellular Ca2+ was 0.04 mM (A and B) and 1.5 mM (C and D).

References

    1. Assad J. A., Shepherd G. M., Corey D. P., Tip-link integrity and mechanical transduction in vertebrate hair cells. Neuron 7, 985–994 (1991). - PubMed
    1. Beurg M., Fettiplace R., Nam J. H., Ricci A. J., Localization of inner hair cell mechanotransducer channels using high-speed calcium imaging. Nat. Neurosci. 12, 553–558 (2009). - PMC - PubMed
    1. Mahendrasingam S., Furness D. N., Ultrastructural localization of the likely mechanoelectrical transduction channel protein, transmembrane-like channel 1 (TMC1) during development of cochlear hair cells. Sci. Rep. 9, 1274 (2019). - PMC - PubMed
    1. Ohmori H., Mechano-electrical transduction currents in isolated vestibular hair cells of the chick. J. Physiol. 359, 189–217 (1985). - PMC - PubMed
    1. Beurg M., Evans M. G., Hackney C. M., Fettiplace R., A large-conductance calcium-selective mechanotransducer channel in mammalian cochlear hair cells. J. Neurosci. 26, 10992–11000 (2006). - PMC - PubMed

Publication types