. 2020 Jan;39(4):767-785.
doi: 10.1038/s41388-019-1023-z. Epub 2019 Sep 23.

Active PLK1-driven metastasis is amplified by TGF-β signaling that forms a positive feedback loop in non-small cell lung cancer

Affiliations

Active PLK1-driven metastasis is amplified by TGF-β signaling that forms a positive feedback loop in non-small cell lung cancer

Sol-Bi Shin et al. Oncogene. 2020 Jan.

Erratum in

Abstract

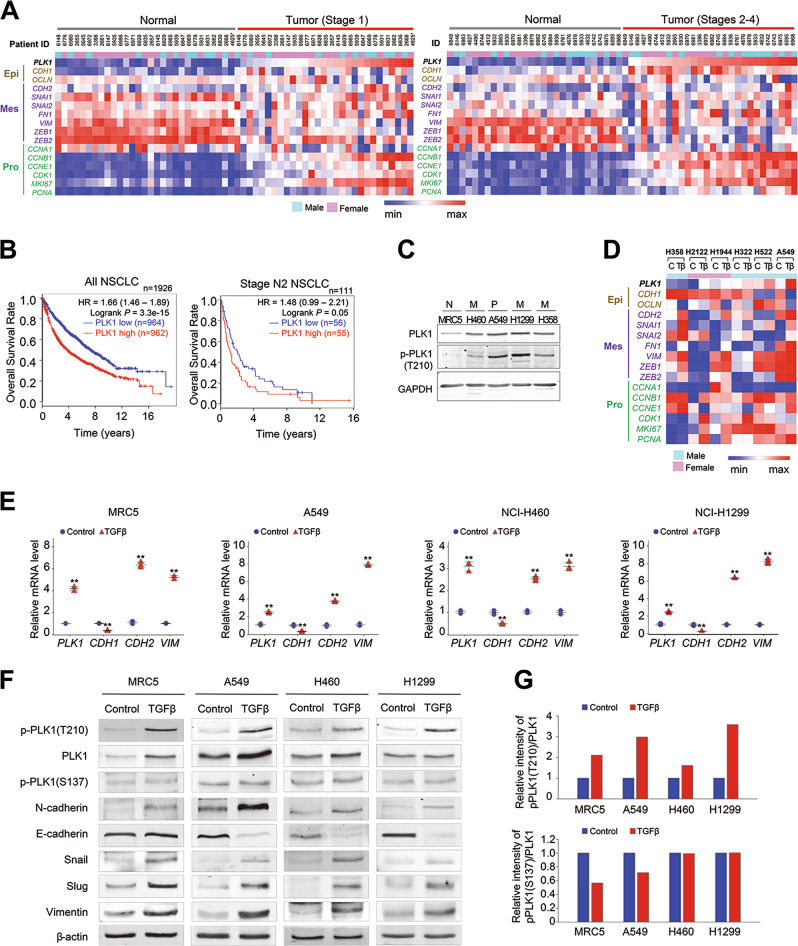
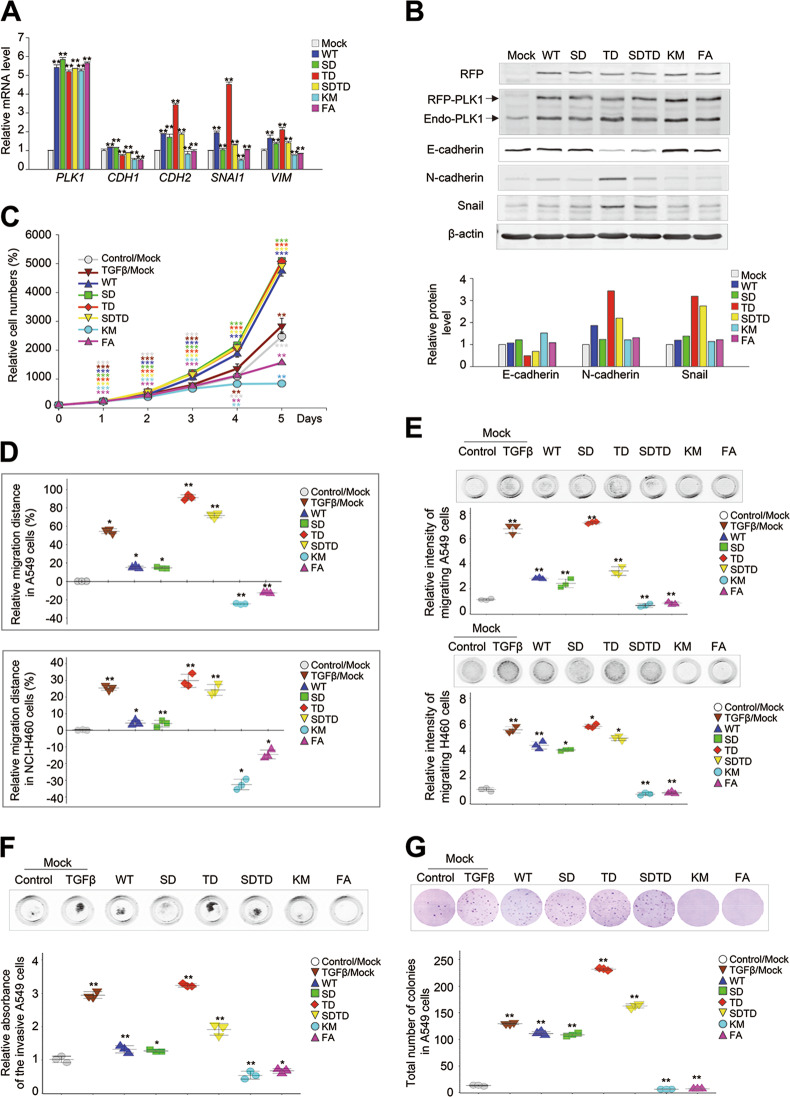
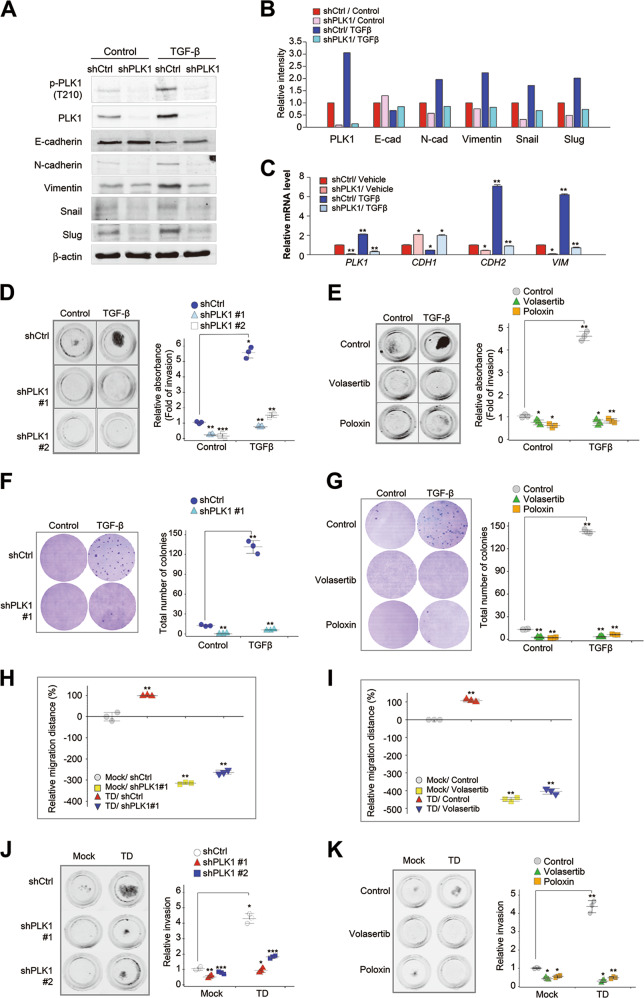
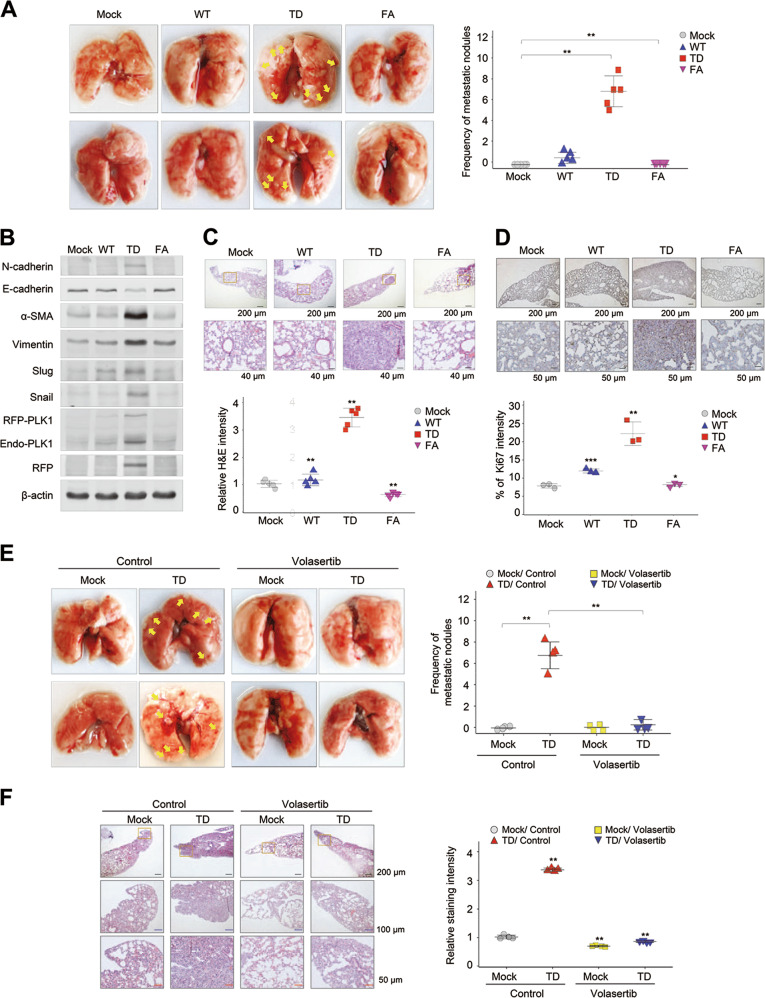
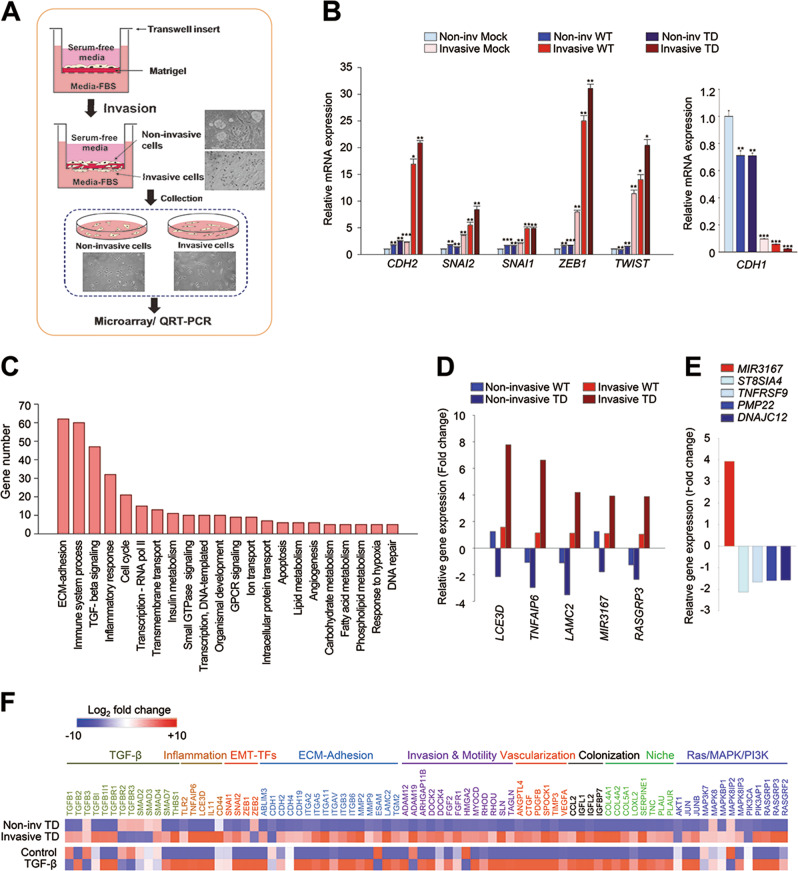
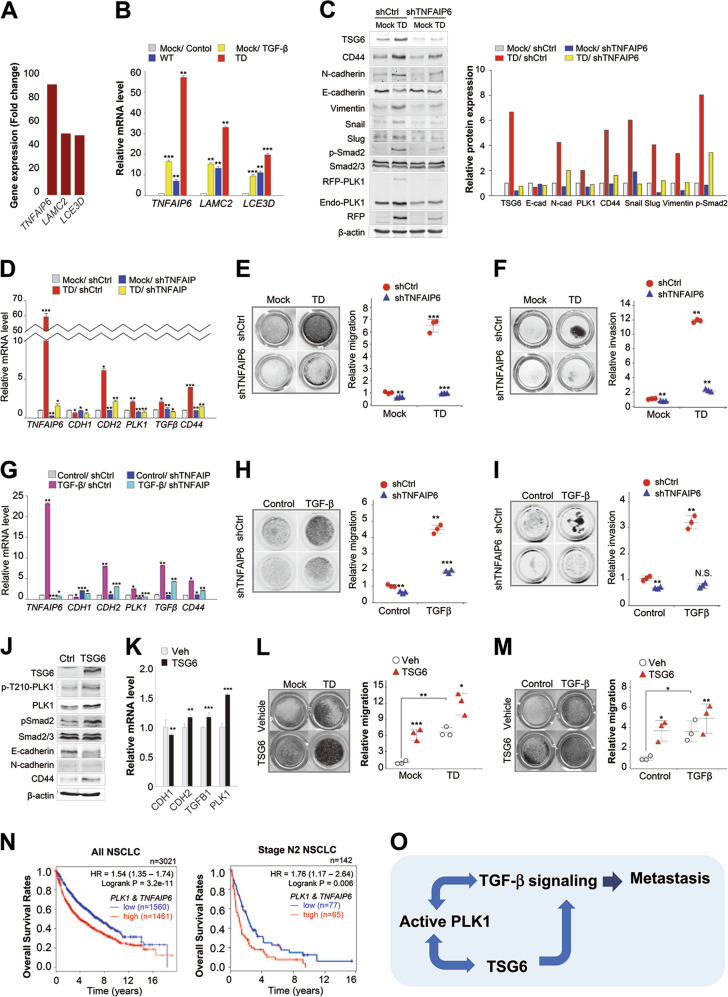
Early findings that PLK1 is highly expressed in cancer have driven an exploration of its functions in metastasis. However, whether PLK1 induces metastasis in vivo and its underlying mechanisms in NSCLC have not yet been determined. Here, we show that the expression of active PLK1 phosphorylated at T210, abundant in TGF-β-treated lung cells, potently induced metastasis in a tail-vein injection model. Active PLK1 with intact polo-box and ATP-binding domains accelerated cell motility and invasiveness by triggering EMT reprogramming, whereas a phosphomimetic version of p-S137-PLK1 did not, indicating that the phosphorylation status of PLK1 may determine the cell traits. Active PLK1-driven invasiveness upregulated TGF-β signaling and TSG6 encoded by TNFAIP6. Loss of TNFAIP6 disturbed the metastatic activity induced by active PLK1 or TGF-β. Clinical relevance shows that PLK1 and TNFAIP6 are strong predictors of poor survival rates in metastatic NSCLC patients. Therefore, we suggest that active PLK1 promotes metastasis by upregulating TGF-β signaling, which amplifies its metastatic properties by forming a positive feedback loop and that the PLK1/TGF-β-driven metastasis is effectively blocked by targeting PLK1 and TSG6, providing PLK1 and TSG6 as negative markers for prognostics and therapeutic targets in metastatic NSCLC.


Conflict of interest statement

The authors declare that they have no conflict of interest.

Figures

Fig. 1
Fig. 1
T210 of PLK1 is highly phosphorylated, but S137 is not in TGF-β-induced epithelial mesenchymal transition (EMT). a Heat maps were generated from TCGA lung adenocarcinoma patients’ dataset. Heat map showed the expression profile of genes, including PLK1, epithelial markers (Epi), mesenchymal markers (Mes), and proliferation markers (Pro) in paired normal and tumor tissues with stage 1 (right) or stages 2–4 (left). *4625 has missense mutation (S335C). b Cumulative overall survival of all NSCLC patients (left) and TMN stage N2 patients (right) according to PLK1 expression. Kaplan–Meier plot of overall survival rates for NSCLC patients was generated by splitting patients by their PLK1 expression levels (defined using median values), and the data were analyzed based on the log-rank test (left, n = 1926, HR = 1.66, log rank p = 3.3e-15; right, n = 111, HR = 1.48, log rank p = 0.05). c Expression and phosphorylation of PLK1 was measured using PLK1 and p-PLK1 (T210) antibodies in normal MRC5 lung cells, primary NSCLC A549, and metastatic NSCLC NCI-H460, NCI-H1299, and NCI-H358 cells. d A heat map analysis was performed for PLK1, epithelial marker CDH1 or OCLN, and several mesenchymal markers, including CDH2, using a published transcriptome of TGF-β-treated NSCLC (GSE 114761). eg MRC5, A549, NCI-H460, and NCI-H1299 cells were treated with 2.5 ng/ml of TGF-β for 48 h. e qRT-PCR was performed for PLK1, CDH1, CDH2, and VIM expression using TGF-β-treated MRC5, A549, NCI-H460, and NCI-H1299 cells. *p < 0.05; **p < 0.01; ***p < 0.001. (n = 3). Data presented as mean ± SD. f Immunoblot analyses were performed for PLK1, p-T210-PLK1, p-S137-PLK1, N-cadherin, E-cadherin, vimentin, snail, slug, and β-actin using specific antibodies with lysates from MRC5, A549, NCI-H460, and NCI-H1299 cells treated with TGF-β. g The band intensity values of p-T210-PLK1, p-S137-PLK1, and PLK1 were quantified using LI-COR Odyssey software (Li-COR Biosciences). The band intensity values of p-T210-PLK1 and p-S137-PLK1 were normalized to those of PLK1 and plotted
Fig. 2
Fig. 2
Expression of a catalytically active p-T210-PLK1 mutant induces tumorigenic and metastatic properties, including migration and invasiveness. Enhanced RFP (eRFP)-tagged wild-type (WT) PLK1 and S137D (SD), T210D (TD), S137D/T210D (SDTD), K82M (KM), and W414F/V415A (FA) mutants were expressed in NSCLC A549 and NCI-H460 cells. a A549 cells were selected with puromycin for 2 days and treated with doxycycline for 48 h. qRT-PCR was performed for PLK1, CDH1, CDH2, VIM, and SNAI1 in A549 cells expressing various versions of PLK1. *p < 0.05; **p < 0.01; ***p < 0.001. (n = 3). Data presented as mean ± SD. b Immunoblot analyses were performed using anti-RFP, anti-PLK1, anti-E-cadherin, anti-N-cadherin, anti-snail, and anti-β-actin (upper panel). The band intensity values were quantified using LI-COR Odyssey software (Li-COR Biosciences), normalized, and plotted (lower panel). (n = 3). c Cell proliferation assay was performed. (n = 3). d A549 (upper panel) and NCI-H460 (lower panel) cells expressing various versions of PLK1 were subjected to a wound-healing assay, as shown in Supplementary Fig. S2. TGF-β was used as a positive control. The scratch recovery efficiency after 72 h was analyzed using NIS-Elements Imaging software (Nikon, Japan), and the relative migration distance compared with the control was plotted. *p < 0.05; **p < 0.01; ***p < 0.001. (n = 3). Data presented as mean ± SD. e A549 (upper panel) and NCI-H460 (lower panel) cells expressing various versions of PLK1 were subjected to a transwell migration assay. Three days after seeding, the cells on the bottom layer surface were stained with 0.05% crystal violet dye, and the intensity values were measured using an Odyssey infrared imaging system (LI-COR Biosciences) and plotted. *p < 0.05; **p < 0.01; ***p < 0.001. (n = 3). Data presented as mean ± SD. f A549 cells expressing various versions of PLK1 were subjected to an invasion assay. Seven days after seeding, the cells that had been invaded on the bottom layer surface were stained with 0.05% crystal violet dye, and the relative absorbance was plotted. (n = 3) Data presented as mean ± SD. g A colony formation assay was performed with A549 cells expressing various versions of PLK1, as described in the Materials and Methods. After 4 weeks, the colonies formed in agar were counted after 0.05% crystal violet staining. *p < 0.05; **p < 0.01; ***p < 0.001. (n = 3). Data presented as mean ± SD
Fig. 3
Fig. 3
Loss of PLK1 activity blocks pro-tumorigenic and pro-metastatic activity induced by active PLK1 or TGF-β. ac A549 cells were infected by lentiviral PLK1 shRNA #1 and then treated with TGF-β for 48 h. a Immunoblot analyses were performed using anti-PLK1, anti-pT210-PLK1, anti-N-cadherin, anti-E-cadherin, anti-vimentin, anti-snail, anti-slug, and anti-β−actin. b The band intensity values were quantified using LI-COR Odyssey software (Li-COR Biosciences), normalized, and plotted. c qRT-PCR was performed for PLK1, CDH1, CDH2, and VIM in A549 cells with depleted PLK1. *p < 0.05; **p < 0.01; ***p < 0.001 (n = 3). Data presented as mean ± SD. d A549 cells were infected by lentiviral PLK1 shRNA #1 (shPLK1#1) and #2 (shPLK1#2) and then treated with TGF-β. The cells that had been invaded on the bottom layer surface were stained with 0.05% crystal violet dye, and the relative absorbance was plotted. (n = 3). e An invasion assay was performed in TGF-β-treated A549 cells after treatment with the PLK1 inhibitors volasertib and poloxin for 5 days. The absorbance was measured at a wavelength of 590 nm, and the relative absorbance was plotted. (n = 3). Data presented as mean ± SD. f A colony formation assay was performed with A549 cells depleted of PLK1, as described in the Materials and Methods. After 4 weeks, the colonies formed in agar were counted after 0.05% crystal violet staining. *p < 0.05; **p < 0.01; ***p < 0.001. (n = 3). Data presented as mean ± SD. g A colony formation assay was performed in TGF-β-treated A549 cells after treatment with the PLK1 inhibitors volasertib and poloxin. After 4 weeks, the colonies formed in agar were counted after 0.05% crystal violet staining. *p < 0.05; **p < 0.01; ***p < 0.001. (n = 3). Data presented as mean ± SD. hi A549 cells expressing eRFP-tagged TD were treated with h shRNA targeting human PLK1 or i volasertib, and an in vitro wound-healing assay was performed 72 h after treatment. The relative migration distance was measured and plotted. *p < 0.05; **p < 0.01; ***p < 0.001. (n = 3). jk An invasion assay was performed using A549 cells expressing eRFP-tagged TD after treatment with j shRNA for PLK1 #1 or #2 k volasertib and poloxin. The relative absorbance was measured and plotted. *p < 0.05; **p < 0.01; ***p < 0.001. (n = 3)
Fig. 4
Fig. 4
Expression of active PLK1 promotes tumor growth and metastasis in mouse model, which is blocked by the treatment of volasertib. ad A549 cells expressing phosphomimetic active T210D (TD) or inactive PBD mutant W414F/V415A (FA) PLK1 were injected intravenously into the tail-veins of 4-week-old BALB/c nude mice, and the tumorigenic and metastatic properties were evaluated after 10 weeks. a Representative lung tumors from the mouse model (left panel). The number of metastatic lung tumors was counted and plotted (right panel) (n= 5). Data presented as mean ± SD. b Immunoblotting was performed using lung tissue lysates from each mouse model. N-cadherin, E-cadherin, α-SMA, vimentin, slug, snail, PLK1, RFP, and β-actin were detected using specific antibodies. c H&E staining was performed using lung tissue from the mice. *p < 0.05; **p < 0.01; ***p < 0.001. (n = 3). Data presented as mean ± SD. d Ki-67 staining was performed using lung tissue from the mice. *p < 0.05; **p < 0.01; ***p < 0.001. (n = 3). Data presented as mean ± SD. ef Primary A549 cells expressing phosphomimetic active TD-PLK1 were injected intravenously into the tail veins of 4-week-old BALB/c nude mice. Two weeks later, the mice received 20 mg/kg of volasertib by injection every week for 3 weeks. After 5 weeks, the anti-tumorigenic and anti-metastatic properties of volasertib were evaluated. e Representative lung tumors from the mouse model (left panel). The number of metastatic lung tumors was counted and plotted (right panel) (n ≥ 4). f H&E staining was performed using lung tissue from the mice. The relative intensity of the H&E staining was plotted. *p < 0.05; **p < 0.01; ***p < 0.001. (n = 4). Data presented as mean ± SD
Fig. 5
Fig. 5
TGF-β signaling is upregulated in PLK1-driven invasive cells. a Three-dimensional culture scheme for invasive cells. b qRT-PCR was performed for CDH1, CDH2, SNAI1, SNAI2, ZEB1, and TWIST in invasive and non-invasive A549 cells expressing WT or TD-PLK1. *p < 0.05; **p < 0.01; ***p < 0.001. c Analysis of transcriptome data for gene probes with significant fold changes (>1.5) in the invasive cells expressing TD. The significant genes were categorized using the KEGG pathway. The top 20% of the 117 pathways are displayed. d Relative gene expression profile of the top five genes in invasive and non-invasive cells expressing WT and TD, respectively. e Relative gene expression profile of the targets of miRNA 3167 (ST8SIA4, TNFRSF9, PMP22, and DNAJC12) in invasive cells expressing TD. f Transcriptome comparison between the gene profiles of invasive and non-invasive A549 cells expressing TD and gene profiles of TGF-β-induced mesenchymal A549 cells (GSE 46024). The MORPHEUS program was used to visualize the expression levels of genes related to TGF-β signaling, Ras/MAPK/PI3K signaling, transcriptional factors of the EMT, ECM-adhesion, invasion, motility, vascularization, colonization, and niche in non-invasive and invasive A549 cells expressing active PLK1 (TD) and in the published transcriptome of TGF-β-treated A549 cells (GSE 46024)
Fig. 6
Fig. 6
Depletion of TNFAIP6 reduces the metastatic activity induced by active PLK1 or TGF-β in NSCLC. a Relative gene expression profile of top three genes in invasive cells expressing TD, compared with non-invasive cells expressing TD. b qRT-PCR was performed for TNFAIP6, LAMC2, or LCE3D of invasive A549 cells expressing mock, WT, or TD-PLK1. TGF-β was used as a positive control for the EMT. **p < 0.01; ***p < 0.001. (n = 3). Data presented as mean ± SD. c–f A549 cells expressing mock or TD-PLK1 (TD) were depleted with shRNA targeting TNFAIP6. c Immunoblotting was performed using specific antibodies for TSG6, CD44, N-cadherin, E-cadherin, vimentin, snail, slug, smad2/3, p-smad2, PLK1, RFP, and β-actin (left panel). The band intensity values were quantified with LI-COR Odyssey software, normalized, and plotted (right panel). d qRT-PCR was performed for TNFAIP6, CDH1, CDH2, TGFB1, or CD44 in A549 cells expressing mock or TD-PLK1 depleting with shRNA targeting for TNFAIP6. *p < 0.05; **p < 0.01; ***p < 0.001. (n = 3). Data presented as mean ± SD. e A549 cells were subjected to a transwell migration assay. Three days after seeding, the cells on the bottom layer surface were stained with 0.05% crystal violet dye, and the intensity values were measured using an Odyssey infrared imaging system (LI-COR Biosciences) and plotted. **p < 0.01; ***p < 0.001. (n = 3). f A549 cells expressing mock or TD-PLK1 were depleted with shRNA targeting TNFAIP6 and subjected to an invasion assay. Seven days after seeding, the cells that had been invaded on the bottom layer surface were stained with 0.05% crystal violet dye, and the relative invasion was plotted. *p < 0.05; **p < 0.01; ***p < 0.001. (n = 3). g–i A549 cells depleted of TNFAIP6 were treated with TGF-β for 48 h. g qRT-PCR was performed for TNFAIP6, CDH1, CDH2, TGFB1, or CD44. *p < 0.05; **p < 0.01; ***p < 0.001. (n = 3). h A549 cells depleting TNFAIP6 were treated with TGF-β and subjected to a transwell migration assay. Three days after seeding, the cells on the bottom layer surface were stained with 0.05% crystal violet dye, and the intensity values were measured using an Odyssey infrared imaging system (LI-COR Biosciences) and plotted. **p < 0.01; ***p < 0.001. (n = 3). i A549 cells depleted of TNFAIP6 were treated with TGF-β and subjected to an invasion assay. Five days after seeding, the cells that had been invaded on the bottom layer surface were stained with 0.05% crystal violet dye, and the relative invasion was plotted. *p < 0.05; **p < 0.01; ***p < 0.001. (n = 3) NS, not significant. j TSG6-treated A549 cells were subjected to immunoblot analysis using specific antibodies for TSG6, PLK1, p-T210-PLK1, N-cadherin, E-cadherin, smad2/3, p-smad2, and β-actin. (n = 3). k qRT-PCR was performed for PLK1, CDH1, CDH2, or TGFB1 in TSG6-treated A549 cells. **p < 0.01; ***p < 0.001. (n = 3). Data presented as mean ± SD. l A549 cells expressing TD-PLK1 were treated with TSG6 and subjected to a transwell migration assay. The cells were stained with 0.05% crystal violet dye, and the intensity values were measured and plotted. **p < 0.01; ***p < 0.001. (n = 3). m A549 cells treating TGF-β were treated with TSG6 and subjected to a transwell migration assay. *p < 0.05; **p < 0.01. (n = 3). n Clinical association between PLK1 and TNFAIP6 in patients with lung cancer. The survival rate of NSCLC patients was analyzed according to the PLK1 and TNFAIP6 expression levels using KM PLOTTER in all NSCLC patients (n = 3021) or stage N2 NSCLC patients (n = 142). o Plausible model of PLK1-driven metastasis

Similar articles

Cited by

References

    1. Ferlay J, Soerjomataram I, Dikshit R, Eser S, Mathers C, Rebelo M, et al. Cancer incidence and mortality worldwide: sources, methods and major patterns in GLOBOCAN 2012. Int J Cancer. 2015;136:E359–86. doi: 10.1002/ijc.29210. - DOI - PubMed
    1. Larsen JE, Minna JD. Molecular biology of lung cancer: clinical implications. Clin Chest Med. 2011;32:703–40. doi: 10.1016/j.ccm.2011.08.003. - DOI - PMC - PubMed
    1. Tamura T, Kurishima K, Nakazawa K, Kagohashi K, Ishikawa H, Satoh H, et al. Specific organ metastases and survival in metastatic non-small-cell lung cancer. Mol Clin Oncol. 2015;3:217–21. doi: 10.3892/mco.2014.410. - DOI - PMC - PubMed
    1. Ali A, Goffin JR, Arnold A, Ellis PM. Survival of patients with non-small-cell lung cancer after a diagnosis of brain metastases. Curr Oncol. 2013;20:e300–6. doi: 10.3747/co.20.1481. - DOI - PMC - PubMed
    1. Steeg PS. Targeting metastasis. Nat Rev Cancer. 2016;16:201–18. doi: 10.1038/nrc.2016.25. - DOI - PMC - PubMed

Publication types

MeSH terms

Substances