. 2019 Oct;14(10):2986-3012.
doi: 10.1038/s41596-019-0210-2. Epub 2019 Sep 23.

SHERLOCK: nucleic acid detection with CRISPR nucleases

Affiliations

SHERLOCK: nucleic acid detection with CRISPR nucleases

Max J Kellner et al. Nat Protoc. 2019 Oct.

Erratum in

Abstract

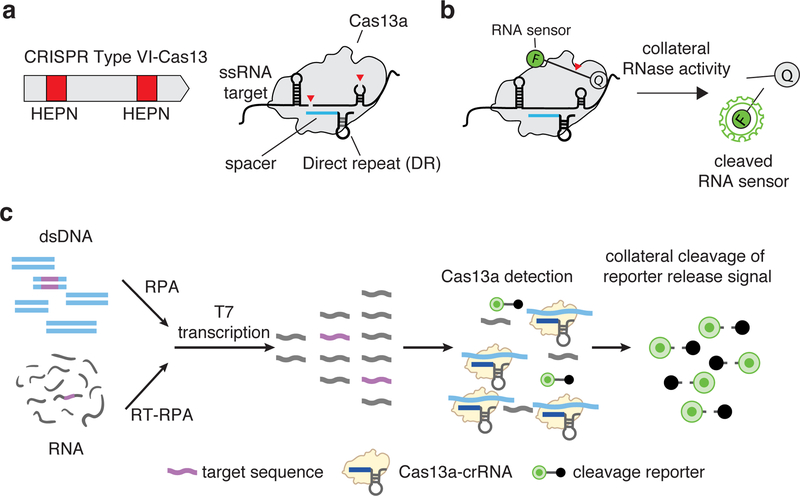
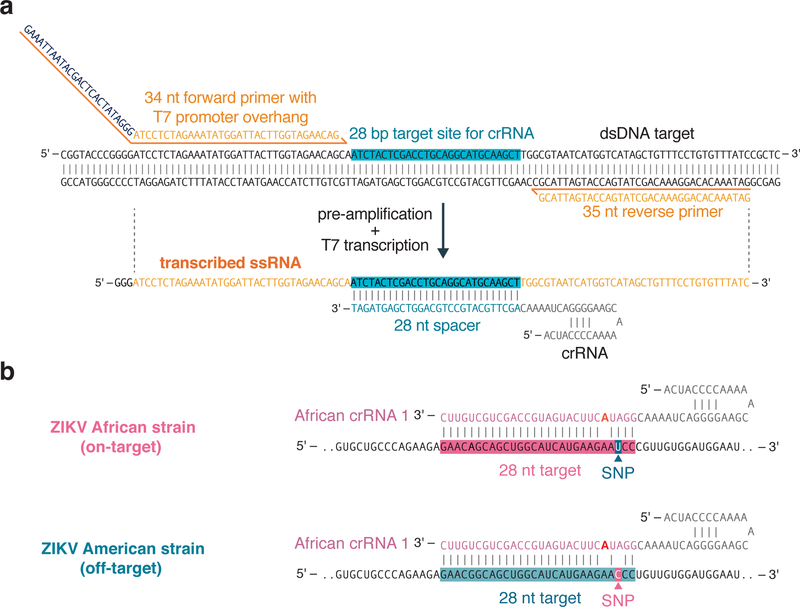
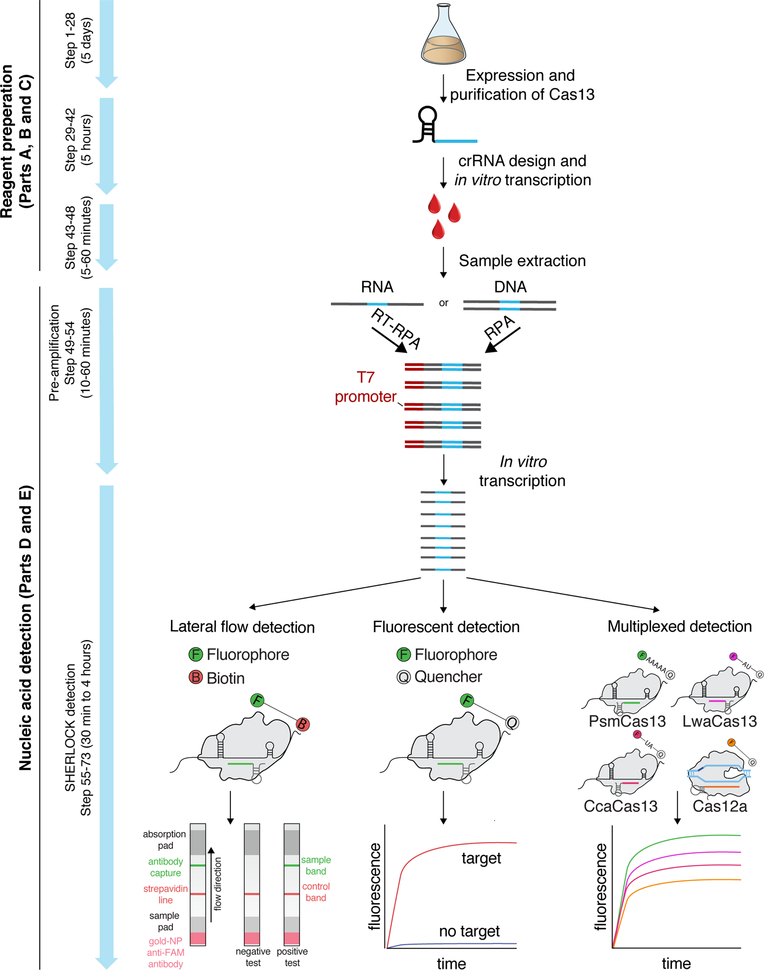
Rapid detection of nucleic acids is integral to applications in clinical diagnostics and biotechnology. We have recently established a CRISPR-based diagnostic platform that combines nucleic acid pre-amplification with CRISPR-Cas enzymology for specific recognition of desired DNA or RNA sequences. This platform, termed specific high-sensitivity enzymatic reporter unlocking (SHERLOCK), allows multiplexed, portable, and ultra-sensitive detection of RNA or DNA from clinically relevant samples. Here, we provide step-by-step instructions for setting up SHERLOCK assays with recombinase-mediated polymerase pre-amplification of DNA or RNA and subsequent Cas13- or Cas12-mediated detection via fluorescence and colorimetric readouts that provide results in <1 h with a setup time of less than 15 min. We also include guidelines for designing efficient CRISPR RNA (crRNA) and isothermal amplification primers, as well as discuss important considerations for multiplex and quantitative SHERLOCK detection assays.


Conflict of interest statement

Competing interests: M.J.K, J.S.G., O.O.A, and F.Z. are co-inventors on patent applications filed by the Broad Institute relating to work in this manuscript. J.S.G., O.O.A., and F.Z. are co-founders of Sherlock Biosciences. J.S.G. is a campus advisor of Benchling, Inc.

Figures

Figure 1:
Figure 1:. Cas13 complex and collateral activity
(a) CRISPR-Cas13 RNA targeting complex components. CRISPR-Cas13 enzymes are programmed by a crRNA, which is composed of a direct repeat sequence (DR) flanked by a target complementary spacer sequence (shown in blue). RNA cleavage is mediated by two Higher eukaryotic and prokaryotic nuclease domains (HEPN) domains (shown as red boxes) within a typical Type VI-A Cas13. (b) Reporter unlocking via CRISPR-Cas13 collateral RNase activity. The CRISPR-Cas13-RNA complex is activated by binding to a complementary target RNA. The activation triggers collateral cleavage of a nonspecific RNA sensor in trans. The fluorescently labeled sensor is quenched when intact and emits fluorescence when cleaved by activated CRISPR-Cas13 complex. (c) SHERLOCK detection assay Schematic of SHERLOCK assay steps, starting with pre-amplification of either a DNA or RNA target input. Amplified targets are converted to RNA via T7 transcription and are then detected by Cas13:crRNA complexes, which activate and cleave fluorescent RNA sensors. For Cas12 detection, the T7 transcription step is omitted, allowing for direct detection of amplified targets.
Figure 2:
Figure 2:. Complete SHERLOCK experimental workflow
First, LwaCas13a is recombinantly expressed and purified in E. coli (steps 1–28). After crRNA design and in vitro transcription (steps 29–41), sample extraction is performed to yield target nucleic acid (step 42). This sample is then used for RPA-based pre-amplification (steps 43–48) and detection by Cas13 (steps 49–52). Detection can be performed as a single-plex colorimetric lateral flow reaction (step 52 option A), or as fluorescence-based single or multiplex SHERLOCK reactions (step 52 option B). Multiple targets can be detected within the same reaction using CRISPR-Cas13 enzymes with orthogonal cleavage preferences or by combining Cas13 with Cas12 in the same assay.
Figure 3:
Figure 3:. Considerations for primer and crRNA design
(a) RPA primer and LwaCas13a crRNA design for target detection. Schematic of LwaCas13 crRNA detection of target RNA transcribed from an RNA amplicon. Sequences of the RPA primers and crRNA are shown to highlight how these should be designed relative to the target DNA and transcribed RNA. A T7 promoter should be added to the 5´ end of the forward RPA primer and the crRNA sequence should be the reverse complement of the target site in the transcribed RNA. The direct repeat of the LwaCas13a crRNA is on the 5énd of the spacer sequence. (b) Synthetic mismatch crRNA design for single-nucleotide specificity. Schematic of crRNA design for sensing a single-nucleotide mismatch difference between African and American strains of the Zika virus. The single-nucleotide polymorphism (SNP) site should be placed in the 3rd position of the spacer sequence and the synthetic mismatch (highlighted in red) should be placed in the 5th position of the spacer sequence.
Figure 4:
Figure 4:. Protein purification workflow and expected results
(a) LwaCas13a protein expression and purification workflow. The TwinStrep-SUMO-LwaCas13a protein expression plasmid is first transformed into competent Rosetta E. Coli cells. After antibiotic selection and initial growth, expression is induced by IPTG. Following growth, cells are harvested and lysed. The recombinant protein is subsequently enriched from the total cell protein by affinity Streptactin purification. The TwinStrep-SUMO tag is then cleaved by SUMO protease to obtain native LwaCas13 protein. The enzyme is further purified by ion-exchange and size exclusion chromatography on an FPLC system. (b) FPLC Chromatograms. The graph shows a representative chromatogram of ion-exchange (IEC, top image) and size-exclusion chromatogram (SEC, bottom image) for LwaCas13a. The UV-absorbance in mAU is plotted against the elution volume in mL. The NaCl gradient for ion-exchange chromatography is shown by the green line. The red boxes indicate the protein-containing fractions that were pooled and concentrated. (c) Coomassie stained SDS-PAGE gel of protein fraction The progress of protein purification is shown on a Coomassie stained SDS-PAGE gel. The fractions are L: Ladder, 1: Cell lysate, 2: Cleared cell lysate, 3: Cell pellet after clearing of lysate, 4: Flow-through following StrepTactin batch-binding, 5: StrepTactin resin before SUMO protease cleavage, 6: Eluted fraction post SUMO protease cleavage, 7: Concentrated sample post ion-exchange chromatography, 8: Final product after size-exclusion chromatography.
Figure 5:
Figure 5:. Anticipated fluorescence and lateral flow results
(a) LwaCas13 detection of ssRNA 1 is dependent on the formation of a protein-crRNA-target complex. Reactions contain LwaCas13a and crRNA, LwaCas13 or crRNA alone, or neither protein nor crRNA, in the presence or absence of a single ssRNA 1 target. Bar graphs indicate mean ± SEM of background-subtracted fluorescence measured from four technical replicates; each individual replicate is represented as a dot. (b) Fluorescence detection for a synthetic RNA version of Zika virus with decreasing input concentrations with a two-step SHERLOCK reaction. Each bar represents the detected collateral cleavage activity for a given input concentration. Bar graphs indicate mean ± SEM of background-subtracted fluorescence measured from either three or four technical replicates; each individual replicate is represented as a dot. (c) Lateral flow detection for a synthetic RNA version of Zika virus with decreasing input concentrations with a two-step SHERLOCK reaction. Samples were detected with a 30 minute RT-RPA incubation followed by a 1 hour LwaCas13 reaction prior to lateral flow strip detection. Adjusted band intensities (determined from lateral flow strips) are shown, as well as individual lateral flow strips, with positive and control sample lines indicated with arrows. (d) Fluorescence detection of synthetic DNA 1 target with decreasing input concentrations using a one-pot SHERLOCK reaction combining the RPA, T7, and LwaCas13 detection steps. Bar graphs indicate mean ± SEM of background-subtracted fluorescence measured from either three technical replicates; each individual replicate is represented as a dot.

Similar articles

Cited by

References

    1. Piepenburg O, Williams CH, Stemple DL & Armes NA DNA detection using recombination proteins. PLoS Biol 4, e204, doi:10.1371/journal.pbio.0040204 (2006). - DOI - PMC - PubMed
    1. Bhattacharyya RP, Thakku SG & Hung DT Harnessing CRISPR Effectors for Infectious Disease Diagnostics. ACS Infect Dis 4, 1278–1282, doi:10.1021/acsinfecdis.8b00170 (2018). - DOI - PubMed
    1. Batista AC & Pacheco LGC Detecting pathogens with Zinc-Finger, TALE and CRISPR- based programmable nucleic acid binding proteins. J Microbiol Methods 152, 98–104, doi:10.1016/j.mimet.2018.07.024 (2018). - DOI - PubMed
    1. Li Y, Li S, Wang J & Liu G CRISPR/Cas Systems towards Next-Generation Biosensing. Trends Biotechnol, doi:10.1016/j.tibtech.2018.12.005 (2019). - DOI - PubMed
    1. Shmakov S et al. Discovery and Functional Characterization of Diverse Class 2 CRISPR-Cas Systems. Mol Cell 60, 385–397, doi:10.1016/j.molcel.2015.10.008 (2015). - DOI - PMC - PubMed

Publication types

MeSH terms