. 2019 Oct;51(10):1475-1485.
doi: 10.1038/s41588-019-0497-5. Epub 2019 Sep 23.

Synergistic effects of common schizophrenia risk variants

Affiliations

Synergistic effects of common schizophrenia risk variants

Nadine Schrode et al. Nat Genet. 2019 Oct.

Abstract

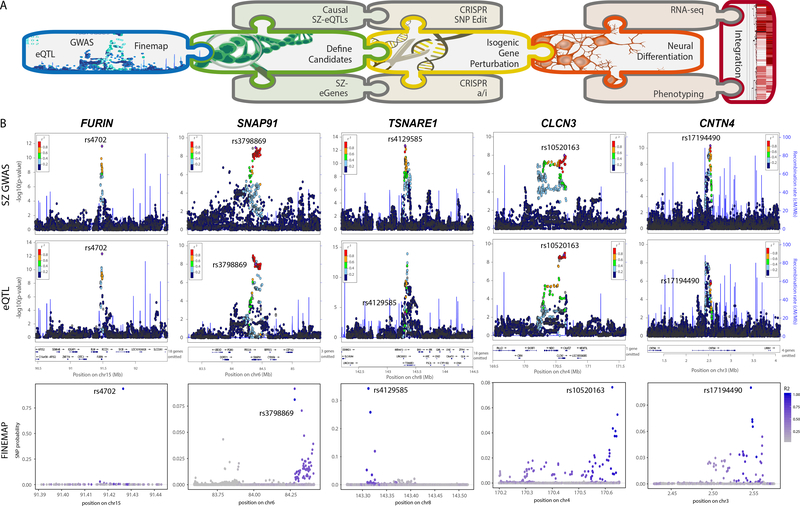
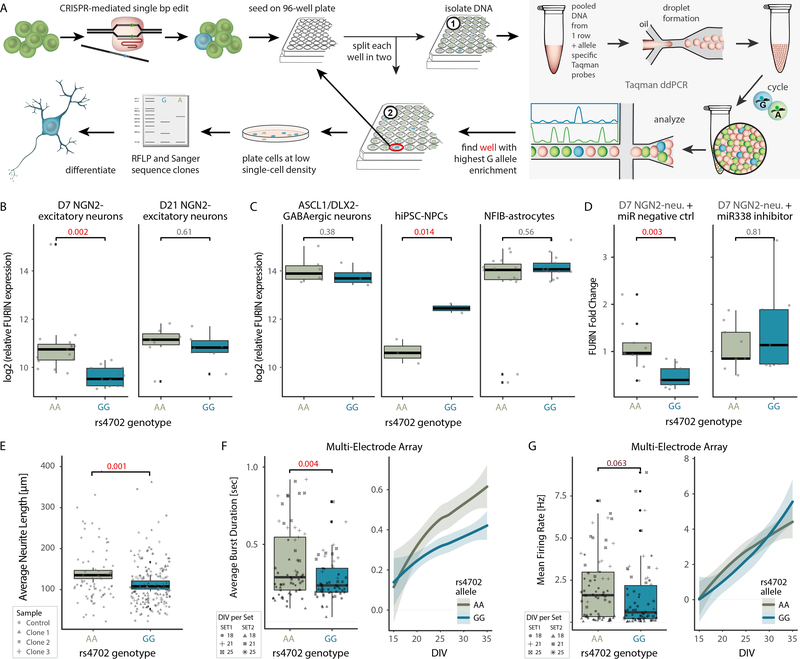
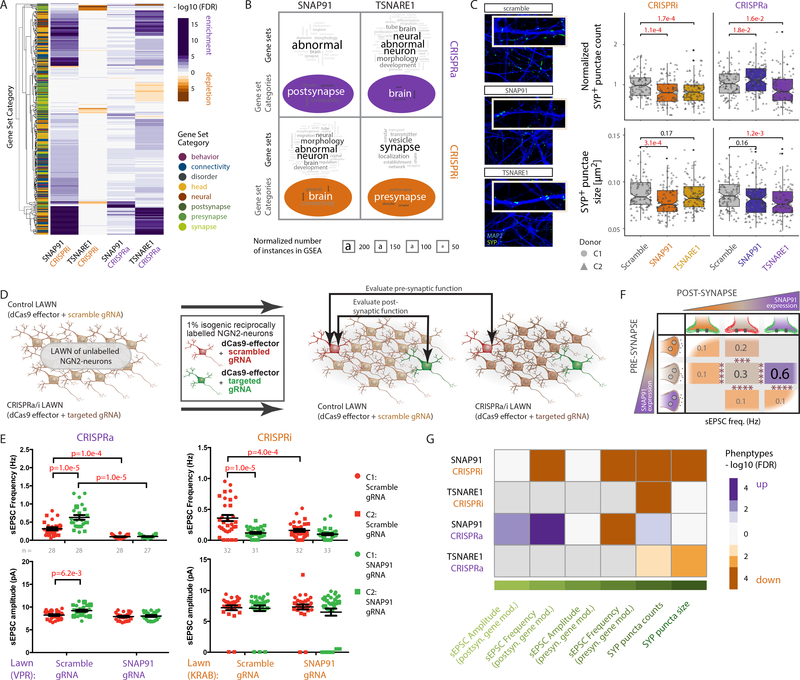
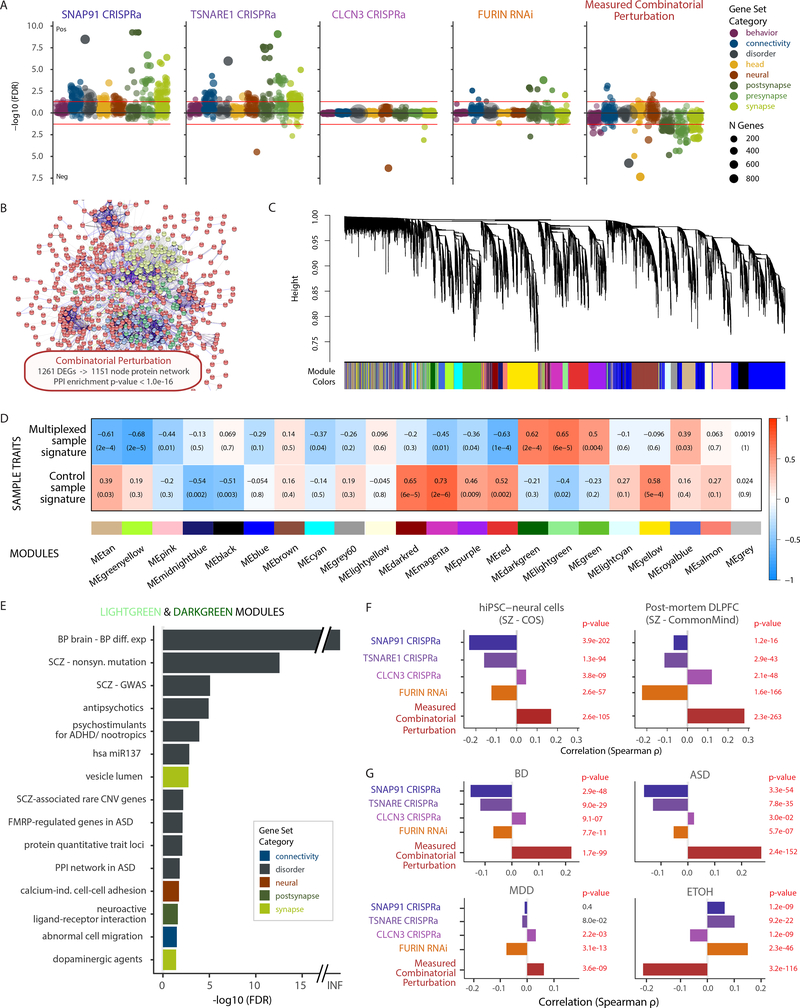
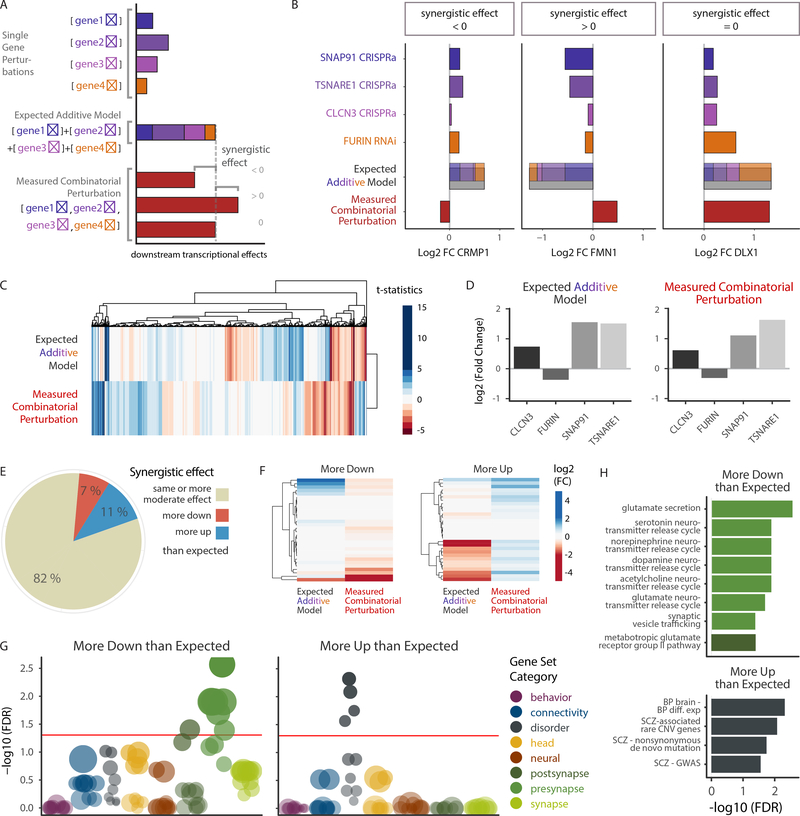
The mechanisms by which common risk variants of small effect interact to contribute to complex genetic disorders are unclear. Here, we apply a genetic approach, using isogenic human induced pluripotent stem cells, to evaluate the effects of schizophrenia (SZ)-associated common variants predicted to function as SZ expression quantitative trait loci (eQTLs). By integrating CRISPR-mediated gene editing, activation and repression technologies to study one putative SZ eQTL (FURIN rs4702) and four top-ranked SZ eQTL genes (FURIN, SNAP91, TSNARE1 and CLCN3), our platform resolves pre- and postsynaptic neuronal deficits, recapitulates genotype-dependent gene expression differences and identifies convergence downstream of SZ eQTL gene perturbations. Our observations highlight the cell-type-specific effects of common variants and demonstrate a synergistic effect between SZ eQTL genes that converges on synaptic function. We propose that the links between rare and common variants implicated in psychiatric disease risk constitute a potentially generalizable phenomenon occurring more widely in complex genetic disorders.


Conflict of interest statement

COMPETING FINANCIAL INTEREST STATEMENT

The authors declare no conflicts of interest.

Figures

Figure 1.
Figure 1.. Prioritization of SZ-SNPs and SZ-genes for functional validation.
A. Schematic summary of analysis pipeline. B. Integration of GWAS (top), eQTL (middle) and fine-mapping (bottom) analysis for FURIN, SNAP91, TSNARE1, CLCN3 and CNTN4. Only FURIN shows evidence of having a single, high probability (0.94) putative causal SNP-eQTL. GWAS results derived from 34,241 cases, 45,604 controls and 1,235 trios and association tested using additive logistic regression model and meta-analysis using an inverse-variance weighted fixed effects model. eQTL statistics generated from 467 DLPFC samples using an additive linear model implemented, and significance assessed using t test.
Figure 2.
Figure 2.. CRISPR editing demonstrates the cell-type-specific impact of rs4702 on FURIN expression and resulting neural phenotypes.
A. Schematic for CRISPR-mediated single base pair (bp) edit, pooled screening and validation strategy. B. log2 (FURIN expression) in rs4702 AA and GG D7 (left, n = 14) and D21 (right, n = 13) NGN2-excitatory neurons. qPCR was performed on four edited clones and two unedited clones of the same donor line in four independent experiments. C. log2 (FURIN expression) in rs4702 AA and GG hiPSC-derived inhibitory ASCL1/DLX2-GABAergic neurons (left, n = 6 ea), hiPSC-NPCs (center, n = 2 ea) and hiPSC-derived NFIB-astrocytes (right, n = 14 ea) through qPCR. D. log2 (FURIN expression) in rs4702 AA and GG D7 NGN2-excitatory neurons, following transfection with either a control miRNA (left, n = 8 ea) or miR338 (right, n = 8 ea). P values calculated using one-sided t test, a linear mixed-effects model controlled for variation between qPCR runs, n refers to biologically independent samples. E. Average neurite length of rs4702 AA and GG D7 NGN2-excitatory neurons, measured (semi-automated) from confocal images of GFP-labeled neurons. N = 40 biologically independent samples, totaling 379 neurons F. Average burst duration and G. Mean firing rate in rs4702 AA and GG D18-D25 NGN2-excitatory neurons (left) and at various time points from 15 to 35 days in vitro (DIV) (right). N = 44 biologically independent samples from 2 independent experiments. P values calculated using two-sided t test; line fitted through locally weighted smoothing (loess). Shaded areas (95% confidence interval), boxplots (quartiles), whiskers (largest/smallest observation within hinge ±1.5× inter-quartile range), and overlaid scatter plots (means of replicates from individual clones) indicated.
Figure 3.
Figure 3.. CRISPRa/i perturbations of the synaptic genes SNAP91 and TSNARE1 leads to transcriptomic changes and synaptic phenotypes.
A. Heat map of SNAP91 and TSNARE1 CRISPRa/i clustering in NGN2-excitatory neurons based on −log10 (P value) and regression coefficient of gene set enrichment analysis. Gene set enrichment tests were performed using a competitive test (accounting for inter-gene correlation) across 698 curated neural gene sets, summarized in 8 categories (denoted as y-axis color annotations). B. Word cloud analysis of enriched gene sets and summary categories from (A) for SNAP91 and TSNARE1 shows most frequently occurring gene set/category words. Font size denotes frequency, which was corrected by subtraction of the respective total word frequency in all used gene sets. C. Representative confocal microscopic images of NGN2-excitatory neurons with altered SNAP91 and TSNARE1 expression, immunostained against presynaptic SYP (SYNAPTOPHYSIN1; green) and dendritic MAP2 (blue) at day 24. Scale bar = 5 pm (left). Normalized SYP+ puncta counts (top) or size (bottom) of neurons with control (scramble gRNA, CRISPRa/i, n = 104 ea), or altered expression of SNAP91 (CRISPRa/i, n = 102 ea) or TSNARE1 (CRISPRa/i, n = 106 ea) from two cell lines (C1, C2). P values calculated using two-sided t tests. N refers to independent images from three independent experiments. Boxplots (quartiles), whiskers (largest/smallest observation within hinge ± 1.5 × inter-quartile range), and overlaid scatter plots (means of replicates from individual clones) indicated. D. Schematic of electrophysiological strategy to evaluate presynaptic and postsynaptic effects of manipulating gene expression. E. sEPSC frequency and amplitude of fluorescently labeled day 28–31 NGN2-excitatory neurons with SNAP91 CRISPRa (left, n = 111 individual neurons) or SNAP91 CRISPRi (right, n = 128 individual neurons). Data collected across three independent experiments. P values determined by multiple comparison test using two-way ANOVA. Plots show scatter graphs with mean and standard error for each group. F. Summary schematic of sEPSC frequency and amplitude of fluorescently labeled NGN2-excitatory neurons from (E). orange: SNAP91 CRISPRi, brown: control, purple: SNAP91 CRISPRa neurons. G. Heat map representation of observed synaptic phenotypes for SNAP91 and TSNARE1 CRISPRa/i based on −log10 (P value) and regression coefficient from (C) and (E).
Figure 4.
Figure 4.. Transcriptomic analysis of combinatorial perturbation of SNAP91, TSNARE1, CLCN3 and FURIN in the direction predicted for their SZ-eQTLs.
A. Competitive gene set enrichment analysis using limma camera (see methods), based on 698 neural gene sets, stratified by eight neural categories. B. Protein network (predicted using STRING database (http://string-db.org)) with 1,151 nodes from 1,261 differentially expressed genes (DEGs, FDR < 5%) resulting from the combinatorial perturbation. Enrichment P value P = 1 × 10⁻¹⁶ by random permutation. C. Hierarchical clustering of genes through topological overlap-based dissimilarity (top) and assigned module colors (bottom). D. Sample trait-module association heatmap. Rows correspond to sample groups (multiplexed CRISPR and controls), columns to module eigengenes. Cell labels denote weighted Pearson correlation (supported through color legend) and Student asymptotic P value of corresponding module and group (n = 4 independent multiplexed CRISPR samples, and n = 12 independent control samples). E. Over-representation analysis (ORA), using a hypergeometric test, of 698 curated gene sets and ranked genes in the two modules, ME-lightgreen (521 genes) and ME-darkgreen (258 genes), with highest correlation to combinatorial perturbation samples. Only gene sets with FDR < 5% shown. F. Analysis of concordance between the current study and two SZ RNA-seq studies (hiPSC-derived NPCs and FB-neurons (COS cohort, top) and post-mortem DLPFC (CMC cohort, bottom), based on Spearman correlation between genome-wide t statistics of 11,245 genes. P values computed through one-sided hypothesis test for the Spearman correlation coefficients being greater than zero. G. Concordance between this study with post-mortem RNA-seq datasets of five neuropsychiatric disorders determined through Spearman correlation between the t statistics of 11,245 genes. P values were computed through a one-sided hypothesis test for the Spearman correlation coefficients being greater than zero. BD Bipolar Disorder, MDD Major Depressive Disorder, ASD Autism Spectrum disorder, ETOH Alcohol dependence.
Figure 5.
Figure 5.. Synergistic effects of SZ-eQTL genes converge on synaptic function and common and rare variant-signatures.
A. Schematic of differential expression analysis. Individual gene modifications, the implementation of the expected additive model based on the latter and the measured combinatorial perturbation allowing for the detection of synergistic effects through comparison with the additive model. B. log2 fold changes of three representative genes (CRMP1, FMN1, DLX1) in individual SZ-eQTL gene perturbations, their computed additive model and their combinatorial perturbation, illustrating different possible synergistic effects (negative, positive and none, respectively). C. Hierarchical clustering of the t statistics for the additive model and the combinatorial perturbation. Color gradient represents t statistic values. D. Differential expression log2 (fold changes) of SNAP91, TSNARE1, CLCN3 and FURIN in the additive model and the combinatorial perturbation. E. Pie chart showing percentages of genes that exhibit similar or more moderate differential expression (beige) following combinatorial perturbation in comparison with the expected additive model, as well as genes that are more downregulated (red) and more upregulated (blue). F. Hierarchical clustering of the differential expression log2 (fold changes) of “more down” and “more up” genes, in the additive model vs. the combinatorial perturbation. FMN1, as seen in (B), is part of the “more up” category. G-H. Over-representation analysis (ORA) using a hypergeometric test, of 698 curated gene sets and those “more down” and “more up” genes with significant synergistic differential expression (FDR < 10%, n(more down) = 36 genes, n(more up) = 132 genes), ranked by adjusted significance.

Comment in

Similar articles

Cited by

References

    1. Schizophrenia Working Group of the Psychiatric Genomics Consortium. Biological insights from 108 schizophrenia-associated genetic loci. Nature 511, 421–7 (2014). - PMC - PubMed
    1. Pardinas AF et al. Common schizophrenia alleles are enriched in mutationin-tolerant genes and in regions under strong background selection. Nat Genet (2018). - PMC - PubMed
    1. Finucane HK et al. Heritability enrichment of specifically expressed genes identifies disease-relevant tissues and cell types. Nat Genet 50, 621–629 (2018). - PMC - PubMed
    1. Skene NG et al. Genetic identification of brain cell types underlying schizophrenia. Nat Genet 50, 825–833 (2018). - PMC - PubMed
    1. Jaffe AE et al. Developmental and genetic regulation of the human cortex transcriptome illuminate schizophrenia pathogenesis. Nat Neurosci 21, 1117–1125 (2018). - PMC - PubMed

METHODS REFERENCES

    1. He X et al. Sherlock: detecting gene-disease associations by matching patterns of expression QTL and GWAS. Am J Hum Genet 92, 667–80 (2013). - PMC - PubMed
    1. Benner C et al. FINEMAP: efficient variable selection using summary data from genome-wide association studies. Bioinformatics 32, 1493–501 (2016). - PMC - PubMed
    1. Brennand KJ et al. Modelling schizophrenia using human induced pluripotent stem cells. Nature 473, 221–5 (2011). - PMC - PubMed
    1. Szklarczyk D et al. STRING v10: protein-protein interaction networks, integrated over the tree of life. Nucleic Acids Res 43, D447–52 (2015). - PMC - PubMed
    1. Hoffman GE & Schadt EE variancePartition: interpreting drivers of variation in complex gene expression studies. BMC Bioinformatics 17, 483 (2016). - PMC - PubMed

Publication types

MeSH terms