. 2019 Nov;22(11):1857-1870.
doi: 10.1038/s41593-019-0496-y. Epub 2019 Sep 23.

CA1-projecting subiculum neurons facilitate object-place learning

Affiliations

CA1-projecting subiculum neurons facilitate object-place learning

Yanjun Sun et al. Nat Neurosci. 2019 Nov.

Abstract

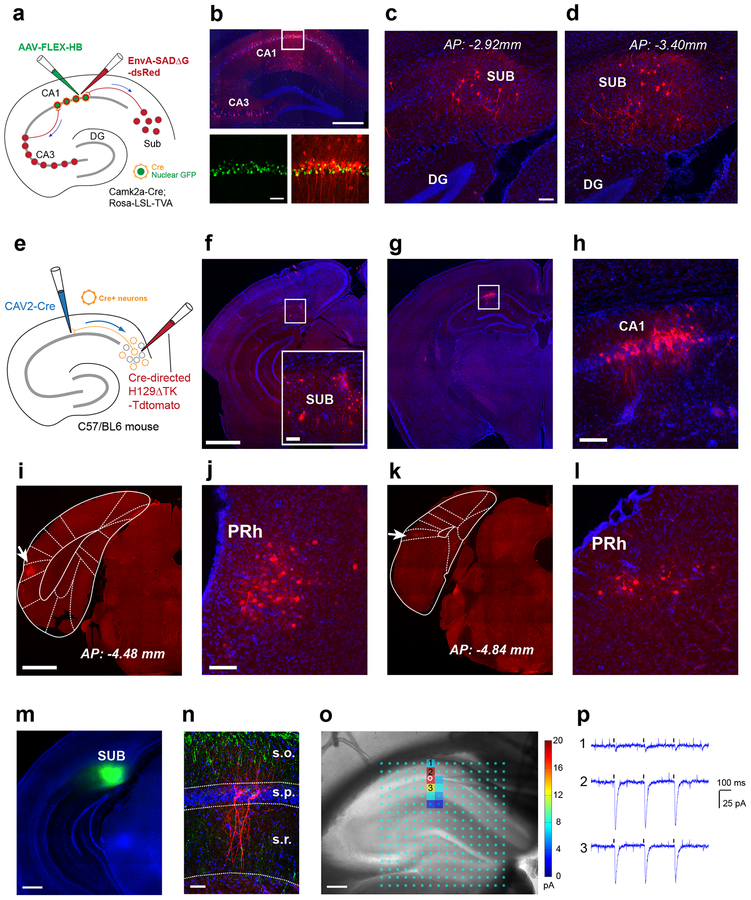
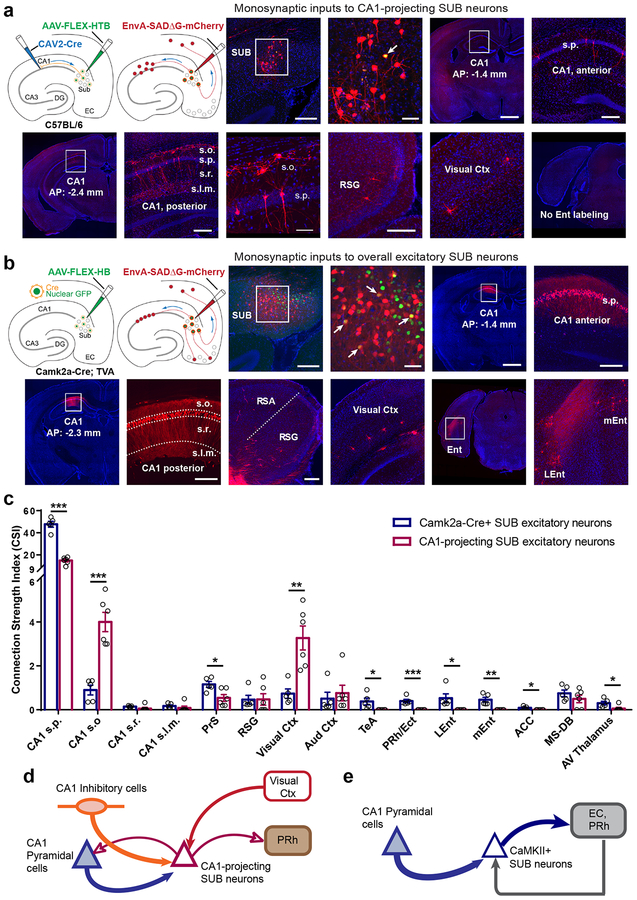
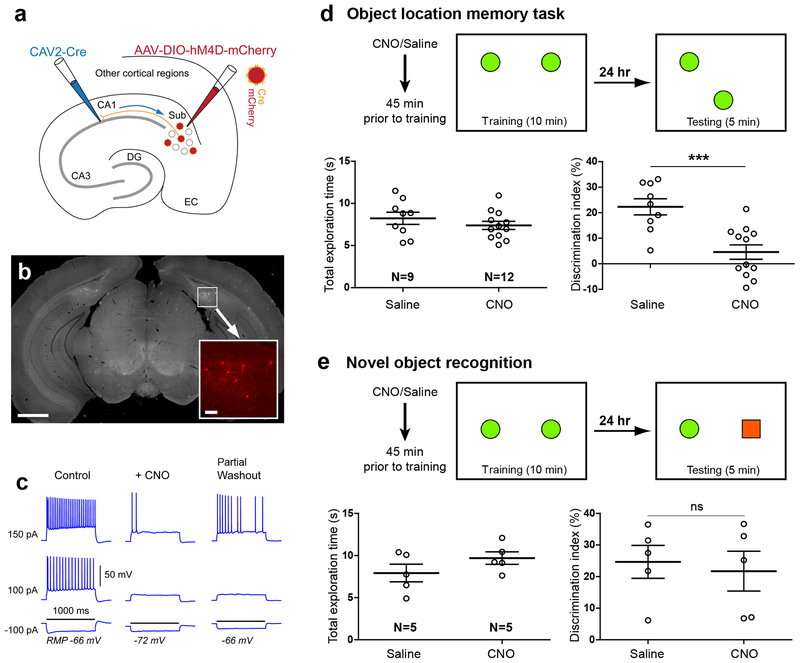
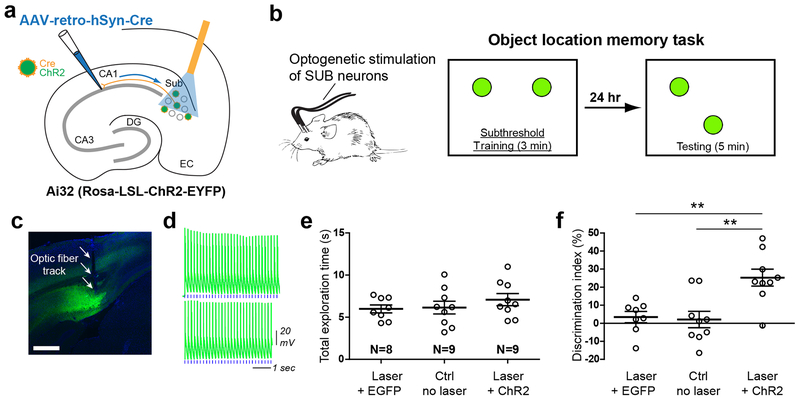
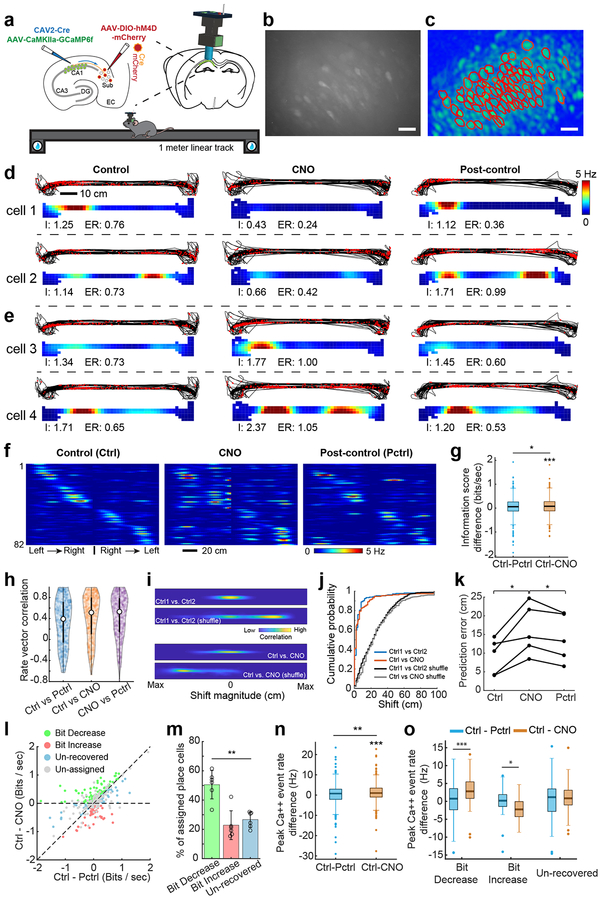
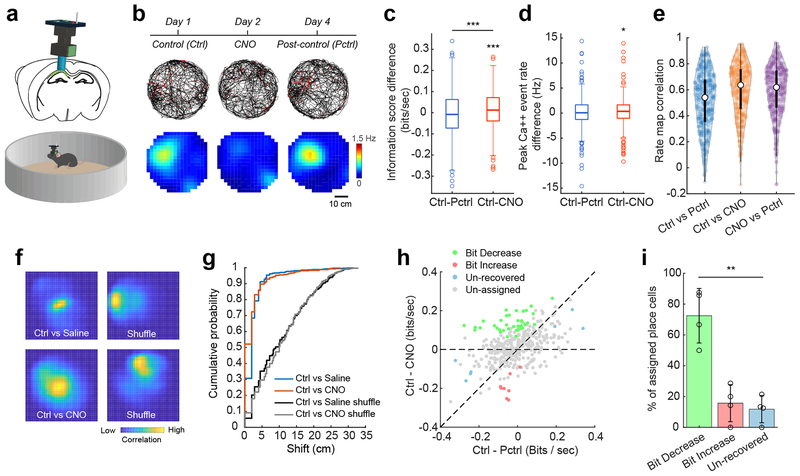
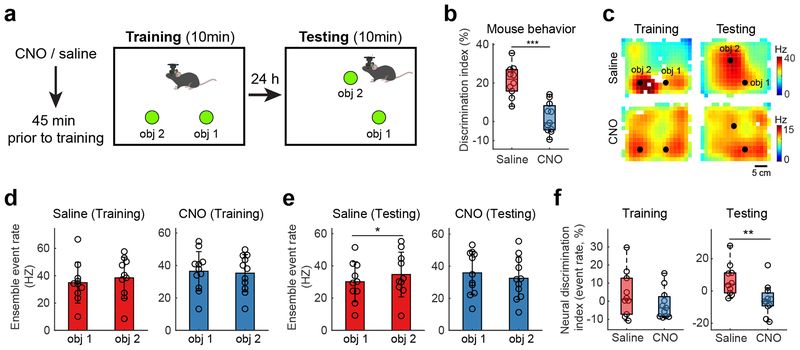
Recent anatomical evidence suggests a functionally significant back-projection pathway from the subiculum to the CA1. Here we show that the afferent circuitry of CA1-projecting subicular neurons is biased by inputs from CA1 inhibitory neurons and the visual cortex, but lacks input from the entorhinal cortex. Efferents of the CA1-projecting subiculum neurons also target the perirhinal cortex, an area strongly implicated in object-place learning. We identify a critical role for CA1-projecting subicular neurons in object-location learning and memory, and show that this projection modulates place-specific activity of CA1 neurons and their responses to displaced objects. Together, these experiments reveal a novel pathway by which cortical inputs, particularly those from the visual cortex, reach the hippocampal output region CA1. Our findings also implicate this circuitry in the formation of complex spatial representations and learning of object-place associations.


Conflict of interest statement

Competing Interests

The authors declare no competing interests.

Figures

Fig. 1.
Fig. 1.. The cortico-hippocampal circuitry involving a non-canonical subiculum - CA1 pathway is identified anatomically by retrograde monosynaptic rabies tracing and anterograde herpes simplex virus (H129) tracing, and verified functionally by channelrhodopsin-2 (ChR2) assisted circuit mapping.
a-d, Direct subiculum-CA1 backprojections are shown by monosynaptic retrograde rabies tracing. This experiment was independently repeated in 12 mice, each with similar results. a, The scheme for our Cre-dependent, monosynaptic rabies tracing approach (see details in the Methods). Using Camk2a-Cre; TVA mice, we map direct presynaptic input connections onto Camk2a-Cre expressing excitatory neurons in hippocampal CA1 in the intact brain. Starter neurons in dorsal hippocampal CA1 are shown (b, top panel), labeled by both EGFP and dsRed expression from both AAV and rabies infection (b, bottom panels). Their presynaptic partners (e.g., local interneurons and CA3 neurons) are labeled by the red fluorescent protein dsRed from rabies infection. The scale bars for the top and bottom panels are 500 μm and 50 μm. c-d, Retrogradely labeled subicular neurons presynaptic to CA1 excitatory neurons are seen in sections of dorsal subiculum at different anterior-posterior positions (c, AP: −2.92 mm; d, AP: −3.40 mm). Scale bar = 50 μm. e-h, Time-limited anterograde-directed HSV tracing supports subiculum-CA1 projections. This experiment was independently repeated in 5 mice, each with similar results. e, The scheme for anterograde tracing by combined use of CAV2-Cre injection in CA1 and the injection of Cre-dependent H129 (H129ΔTK-tdTomato) in SUB to map projections of CA1-projecting SUB excitatory neurons. f, H129 infected neurons at the injection site in the subiculum are shown in red; DAPI staining in blue. The scale bar on the left (1mm) applies to the lower magnification panels while the scale bar for the enlarged insert panel on the right is 200 μm. g-h, Postsynaptic neuronal labeling is robustly seen in hippocampal CA1 ipsilaterally at 48 hours post H129 viral injection. Scale bar = 200 μm in h. i-l, Besides CA1, postsynaptic neuronal labeling by H129 is seen in the perirhinal cortex (PRh) ipsilaterally. This experiment was independently repeated in 5 mice, each with similar results. i, An example of perirhinal labeling, with a white arrow pointing to the atlas aligned brain structure of PRh. The scale bar (1mm) applies to both i and k. j, An enlarged view of perirhinal neuronal labeling in i. The scale bar (200 μm) applies to both j and l. k-l, Perirhinal labeling from a different animal. m-p, Physiological mapping indicate that CA1 pyramidal neurons receive excitatory subicular inputs. This experiment was independently repeated in 8 cells from 5 mice, each with similar results. m, Spatially localized iontophoretic injection of AAV1-ChR2-Venus in the subiculum (green). n, Post-hoc verification of biocytin-filled recorded pyramidal neurons (red) along with the distribution of ChR2/Venus expressing subicular axons (green) counterstained with DAPI in a hippocampal slice. o-p, Direct subicular innervation of CA1 excitatory neurons is shown by postsynaptic current responses to local photoactivation of ChR2-expressing subicular axons in the presence of TTX and 4-AP, which block Na+ channels required for generating axonal action potentials and K+ channels critical for axonal membrane potential repolarization, respectively. o, Highly localized excitatory subicular inputs impinged onto the recorded excitatory pyramidal neuron (indicated by the white circle). The photoactivation sites (light cyan dots) are superimposed on the slice image, with the strength of evoked input sites scored with a color coded heat map for average integrated input strength within the analysis window (>10 ms to 160 ms post photostimulation), with the baseline spontaneous responses subtracted from the photostimulation response of the same site (for more details see Methods). p, Raw ChR2 photoactivation responses recorded from the pyramidal neuron in response to 3 repeated laser flashes (473 nm, 1 ms) at the oriens (1), pyramidale (2), and radiatum (3) layer of CA1, respectively.
Fig. 2.
Fig. 2.. CA1-projecting SUB excitatory neurons differ in circuit connections from larger populations of SUB excitatory neurons defined by Camk2a-Cre expression.
a, Global mapping of input connections to CA1-projecting SUB excitatory neurons using a combinatorial viral-genetic tracing method. The approach using CAV2-Cre and Cre-dependent monosynaptic rabies tracing is illustrated schematically (see details in Methods). The first two image panels show the injection site in the subiculum. Scale bars are 200 and 50 μm, respectively. DAPI staining is blue; rabies labeled neurons are red. The starter neuron (yellow) indicated by the white arrow appears to receive strong local SUB inputs, as it is surrounded by a cluster of other SUB neurons. Input mapped neurons in dorsal CA1, retrosplenial granular cortex (RSG), and visual cortex are shown in subsequent panels (also see Supplementary Fig. 2). CA1 projecting SUB excitatory neurons receive both excitatory and inhibitory CA1 inputs and do not receive direct input from entorhinal cortex. The scale bar (1mm) applies to low magnification image panels. The scale bar (50 μm) applies for the enlarged view of stratum oriens interneurons and pyramidal cells. All other scale bars = 200 μm. Note that all the labeled neurons shown in the figure are ipsilateral to the injection site, and very few contralateral labeled neurons were seen across all experimental cases. s.o., stratum oriens; s.p., stratum pyramidale; s.r., stratum radiatum; s.l.m., stratum lacunosum-moleculare. This experiment was independently repeated in 6 mice, each with similar results. b, Global mapping of input connections to the full population of SUB excitatory neurons using Camk2a-Cre; TVA mice. The Cre-dependent monosynaptic rabies tracing method is illustrated in the schematics on the left. The first two image panels show the injection site in the subiculum. The scale bars are 200 and 50 μm, respectively. DAPI staining is blue; rabies labeled neurons are red and starter neurons are yellow. Input mapped neurons in anterior (AP: −1.4 mm) and posterior (AP: −2.3 mm) dorsal CA1, retrosplenial granular cortex (RSG), visual cortex, and medial and lateral entorhinal cortex (mEnt and LEnt) are shown in the subsequent panels (see Supplementary Fig. 2 for more input mapped regions). The scale bar (1mm) applies to low magnification image panels. All other scale bars = 200 μm. Panels of RSG, visual cortex, and Lent/mEnt share the same scale. This experiment was independently repeated in 5 mice, each with similar results. c, Quantitative analysis of input connection strengths of CA1-projecting and Camk2a-Cre SUB excitatory neuron types, showing the connectivity strength index (CSI) for each input mapped brain structure. Data are measured from Camk2a-Cre expressing SUB excitatory neurons (N = 5 cases), and CA1-projecting SUB excitatory neurons (N = 6 cases), and are presented as mean ± SE. Two-tailed t-tests are used to test significance of differences for each input region. See detailed data in Supplementary Table 1b. *P < 0.05; **P < 0.01; ***P < 0.001. s.p., stratum pyramidale; s.o., stratum oriens; s.r., stratum radiatum; s.l.m., stratum lacunosum-moleculare. PrS: Presubiculum, RSG: Retrosplenial granular cortex, Vis Ctx: Visual cortex, Au Ctx: Auditory cortex, TeA: Temporal association cortex, PRh: Perirhinal cortex, Ect: ectorhinal cortex, Lent: Lateral entorhinal cortex; mEnt: Medial entorhinal cortex, ACC: anterior cingular cortex, MS-DB: Medial septum and diagonal band of Broca. d–e. Schematic highlights the major input connections and output projections of CA1-projecting SUB neurons versus CaMKII+ SUB excitatory neurons, based on our tracing data shown in Figs. 1 and 2 as well as incorporation of relevant literature on SUB efferent projections. Note that CA1-projecting SUB neurons are GABA immuno-negative and 90% of them are CaMKIIa positive (see Supplementary Fig. 1).
Fig. 3.
Fig. 3.. Genetically targeted inactivation and activation of CA1-projecting excitatory SUB neurons modulates object-location memory.
a, Schematic illustration of genetic inactivation of CA1-projecting SUB excitatory neurons using dual CAV2-Cre injection in CA1 and AAV2-DIO-hM4D-mCherry injection in the SUB. b, Histological analysis in coronal brain sections verifies bilateral, spatially restricted hM4D-mCherry expression in SUB. Scale bar = 1 mm. The bottom right insert shows a higher magnification view of the white square region in b with hM4D-mCherry expressing, CA1-projecting SUB neurons in red. The insert scale bar = 100 μm. The viral injection experiment was independently repeated in 21 mice, each with similar results. c, Example electrophysiological data demonstrating in vitro validation of DREADDs-mediated SUB neuronal inactivation. The 5 μM CNO application hyperpolarized the cell’s resting membrane potential (RMP) and suppressed action potential firing by intrasomatic current injections. The black horizontal line indicates 1000 ms of the current injection duration with different strengths (i.e., −100 pA, 100 pA and 150 pA). The 5 μM concentration matched the CNO dosage of 1.5 mg/kg used for in vivo DREADDs experiments. Given hM4D is a G-protein coupled receptor, CNO effects can only be partially reversed with washout of 30–45 minutes, which is consistent with published results. The experiment was independently repeated in 10 cells from 4 mice, each with similar results. See more validation data in Supplementary Fig. 4a–c. d. Scheme for experimental design and results of location-dependent object recognition task following CNO-activated inhibition of CA1-projecting SUB excitatory neurons during the training phase. The box represents the open field arena, and the green filled circles indicate the training (left) and test (right) object locations. Before the experiment, mice were handled and habituated to the context in the absence of objects. Mice received a single dose i.p. injection of control saline or experimental CNO treatment (1.4mg/kg) 45 min prior to the training. Left graph: total exploration time of the animals during the testing session. Right graph: discrimination index for the testing session 24 hours after training. CNO treated mice show no preference for the moved object in contrast to saline treated controls. Data are presented as mean ± SE. *** p =0.0005 (two-tailed t-test). e, Test of novel object recognition. In training sessions, two identical objects (green filled circles) are placed in the arena, while for testing, distinct objects (green filled circle and red filled square) are placed. Mice with inhibition of CA1-projecting SUB neurons show equal preference for the novel object, similar to the saline treated controls. Data are presented as mean ± SE. n.s., not significant p = 0.73 (two-tailed t-test). For more data information, see Supplementary Table 2a.
Fig. 4.
Fig. 4.. Optogenetically activating CA1 projecting SUB neurons enhances object-location memory.
a, Scheme for optogenetic activation of CA1-projecting subicular neurons using AAV-retro-hSyn-Cre in Ai32 (Rosa-LSL-ChR2-EYFP) mice. b, Left, schematic depicting a mouse bilaterally connected with optic fibers for delivery of laser stimulation to the subiculum. Right, the experimental design of the object location task for testing the memory enhancement. The box represents the open field arena and the green filled circles indicate initial and shifted object locations. Object exploration was for only 3 min in training, which normally is sub-threshold for long-term memory formation; testing in response to a moved object location following subthreshold training is shown at the far right. c, A coronal brain section image shows the expression of ChR2-EYFP (green) in the subiculum and an optic fiber track. The viral injection experiment was independently repeated in 18 mice, each with similar results. d, Example responses of a ChR2-expressing SUB neuron to 473 nm blue laser stimulation (6 Hz, 50 ms) for 3 minutes with a matched light intensity of in vivo behavioral experiments. Each blue tick beneath the response trace indicates one stimulation. The experiment was independently repeated in 15 cells from 4 mice, each with similar results. See more relevant data in Supplementary Fig. 4d–f. e, The total exploration time with objects during the testing session is similar for each condition. f, The stable versus displaced object discrimination index during testing for each condition is shown. Mice that received subicular laser stimulation show strongly increased preference for the moved object in contrast to unstimulated controls or EGFP controls with laser stimulation. Data are presented as mean ± SE and a two-tailed t-test was used. ** p = 0. 0018 (top bar) and 0.0027 (bottom bar), respectively.
Fig. 5.
Fig. 5.. CA1-projecting SUB neurons modulate place-specific activity of CA1 neurons in the linear track space.
Experiments described in the figure were independently repeated in 6 CNO-treated mice, each with similar results obtained. For control data, experiments were independently repeated in 3 mice, each with similar results obtained. a, Top left, a schematic illustration of AAV1 injection for targeted expression of GCaMP6f in CA1 excitatory neurons, and a second dual injection of CAV2-Cre in CA1 and AAV2-DIO-hM4D in SUB for targeted expression of DREADDs in the CA1-projecting SUB excitatory neurons. Top right, a schematic depicts a miniaturized fluorescent microscope (miniscope) used to image in vivo calcium signals in CA1 neurons in awake behaving mice. The implanted GRIN lens (shown in blue) and fixed miniscope baseplate allow reliable, repeated imaging of the same group of neurons over 2 weeks. The lower cartoon depicts a mouse running on a 1-meter linear track during in vivo calcium imaging. Water rewards are placed on both ends of the linear track. b, Representative maximum intensity projected image showing recorded CA1 neurons from three combined 15 min imaging sessions (control, CNO, post-control) across days. The calcium imaging videos were motion corrected and aligned across sessions, scale bar = 25 μm. c, A spatial footprint profile image shows extracted neurons (red contours) using the CNMF-E algorithm (see the Methods for details) based on the combined video in b, scale bar = 25 μm. d, Two sets of panels display tracking data (black lines) with superimposed red dots depicting sites where Ca++ events occurred (upper) and corresponding calcium activity rates (lower) for two example cells (cell 1 and cell 2) from the bit-decrease group (see classification below) on the linear track. Each bottom panel is a color-coded rate map showing the averaged spatial distribution of calcium event rates of the same CA1 neuron mapped to animal position on the linear track. Each line shows the event plot and rate maps of control (left), CNO (center), and post-control (right) sessions from the same CA1 place cell over about 2 weeks (2–3 days between sessions). “I” indicates the spatial information score (bits/second), “ER” indicates the mean calcium event rate. e, Same organization as d, these panels show the activities of two example cells (cell 3 and cell 4) from the bit-increase (see classification below) group. f, A color coded population event rate map organized by spatial position for left to right track traversals and then right to left traversals of all place cells from one representative mouse during control (Ctrl, left), CNO (center), and post-control (Pctrl, right) sessions. The depicted cell order is unchanged across the sessions of control, CNO and post-control as determined initially in the control session. Each line shows activity of one place cell. Color indicates event rate (scale bar). The overall rate map correlation values (Pearson’s) between control and post control sessions, and between control and CNO sessions are, respectively, 0.61 and 0.54. g, Comparison of the difference of spatial information scores (bits/second) between Ctrl and Pctrl (Ctrl –Pctrl, two-tailed t-test against zero: p = 0.15), and between Ctrl and CNO (Ctrl – CNO, two-tailed t-test against zero, p = 1.3 × 10⁻⁴) across all 347 place cells recorded from 6 mice. Differences between Ctrl – Pctrl and Ctrl – CNO are also observed (two-tailed, paired t-test, p = 0.03). h, A violin plot showing the distribution of individual place cell’s rate vector correlation coefficients (Pearson’s) for all session combinations (“control versus CNO”, “control versus post-control”, and “CNO versus post-control”). The median value for Ctrl vs Pctrl, Ctrl vs CNO, and CNO vs PCtrl are 0.40, 0.51, and 0.53 (n = 347 place cells from 6 mice). The white points indicate median values, and thin black lines extend to the most extreme values within 1.5 times of the interquartile range of the median. The filled color width represents a density estimate of the distribution of values along the y axis. i, Spatial cross-correlograms of example CA1 cells from the saline-treated experiment (Ctrl1 vs Ctrl2) and CNO-treated experiment (Ctrl vs CNO). Shuffled examples were obtained by randomly pairing rate maps across the same comparison sessions as for the example cells. j, The distributions of correlation-peak shift magnitudes for the place cells in the saline experiment (blue line) and the CNO experiment (red line) differ significantly from the corresponding shuffled distributions (p = 3.17 × 10−64, two-tailed, two-sample Kolmogorov–Smirnov test (KS), n = 174 cells from Ctrl1 vs Ctrl2 and 1000 shuffles from Ctrl1 vs Ctrl2; p = 1.48 × 10−101, two-sample KS, two-tailed, n = 347 cell from Ctrl vs CNO and 1000 shuffles from Ctrl vs CNO). Shuffled distributions were obtained by randomly pairing place maps 1,000 times across the indicated sessions. There is no significant difference between the distribution of Ctrl vs CNO (red line) and the Ctrl1 vs Ctrl2 (blue line) (p = 0.38, two-sample KS, two-tailed). k, Quantification of the prediction errors between predicted trajectories and actual trajectories for decoding accuracy using the trained model based on the first control session, which supports the observations in Supplementary Fig. 8a. Each line represents the prediction errors of Ctrl, CNO and Pctrl sessions from one mouse. Significantly higher prediction errors are observed in CNO sessions compared to those in Ctrl (p = 0.016, two-tailed, paired t-test) and Pctrl (p = 0.015, two-tailed, paired t-test) sessions. n = 5 mice. l, Recorded CA1 place cells can be classified into 3 non-overlapping groups termed bit-decrease, bit-increase, and un-recovered (see Methods for more information about the group classification), based on the statistical significance of differences in information scores (bit/sec) between CNO and Ctrl, and between CNO and Pctrl. Statistical testing employed a jackknife resampling method for each place cell with appropriate corrections for error terms. Un-assigned place cells did not pass the statistical test and were excluded from further categorization analysis. On the scatter plot, the x-axis is Ctrl – Pctrl (the difference of spatial information scores between Ctrl and Post-ctrl) and the y-axis is Ctrl – CNO (the difference of information scores between Ctrl and CNO). m, Of the 201 place cells that show significant differences (assigned place cells) from 6 mice, 50% show decreased information scores in CNO sessions compared to the control and post-control sessions (bit-decrease group, green bar). A smaller subset (~ 23%) show increased information scores in CNO compared to the control and post-control (bit-increase group, red bar). The remaining ones are the unrecovered group which accounts for ~ 27% of place cells. Comparing the mean percentages of each type seen in each mouse, a significant difference in the % of place cells among these three groups is observed (p = 0.002, repeated measures ANOVA, n = 6 mice). Data are presented as mean ± SE in the bar plot. n, Comparison of the difference of peak calcium event rates between Ctrl and Pctrl (Ctrl –Pctrl, two-tailed t-test against zero, p = 0.32), and between Ctrl and CNO (Ctrl –CNO, two-tailed t-test against zero, p = 1.6 × 10⁻⁵) across all 347 place cells recorded from 6 mice. Differences between Ctrl – Pctrl and Ctrl – CNO are also observed (two-tailed, paired t-test, p = 0.004). o, Comparisons of peak calcium event rates between Ctrl – Pctrl and Ctrl – CNO in bit decrease (two-tailed, paired t-test, p = 3 × 10⁻⁷, n = 97 cells), bit increase (two-tailed, paired t-test, p = 0.027, n = 48 cells) and un-recovered groups (two-tailed, paired t-test, p = 0.20, n = 56 cells), respectively. For the box plots throughout the figure, the three box lines from top to bottom represent the 25th, 50th (median), and 75th percentile of data values of the samples. The whiskers extend to the most extreme values within 1.5 times of the interquartile range of the median.
Fig. 6.
Fig. 6.. Inactivation of CA1-projecting SUB neurons impacts CA1 neural activities in an open field.
A cohort of mice with bilateral hM4D expression in CA1-projecting SUB neurons were used for these experiments. Miniscope imaging of CA1 place cell activities were obtained while animals explored an open arena. The experiments were independently repeated in 4 mice of each treatment group, each with similar results. a, A schematic illustration of the CA1 Ca++ imaging experiment in a circular arena. b, Top: Example position sampling (grey lines) and locations of Ca++ events of a single neuron (red dots) for control, CNO, and post-control sessions. Bottom: Calcium event rate maps for the same example cell across sessions. The experimental time line is shown at the top. c, Comparisons of the difference of spatial information score(bits/second) between Ctrl and Pctrl (Ctrl – Pctrl, two-tailed t-test against zero: p = 0.26), and between Ctrl and CNO (Ctrl - CNO, two-tailed t-test against zero, p = 1.82 × 10⁻⁴) across 379 place cells from 4 mice. Significant differences between Ctrl – Pctrl and Ctrl – CNO are also observed (two-tailed, paired t-test, p = 2.73 × 10⁻⁵). For the box plots in the figure, the three box lines from top to bottom represent the 25th, 50th (median), and 75th percentile of data values of the samples. The whiskers extend to the most extreme values within 1.5 times of the interquartile range of the median. d, Comparisons of the difference of individual place cells’ peak calcium event rates between Ctrl and Pctrl (Ctrl – Pctrl, two-tailed t-test against zero, p = 0.32), and between Ctrl and CNO (Ctrl - CNO, two-tailed t-test against zero, p = 0.02). e, A violin plot showing the distribution of individual place cell’s rate map correlation coefficients (Pearson’s) for all session combinations. The median values for Ctrl vs Pctrl, Ctrl vs CNO, and CNO vs PCtrl are 0.51, 0.60, and 0.59 (n = 379 place cells from 4 mice). The overall high correlation indicates consistent and stable positional coding between different conditions. In the violin plot, the white points indicate median values, and thin black lines extend to the most extreme values within 1.5 times of the interquartile range of the median. The filled color width represents a density estimate of the distribution of values along the y axis. f, Spatial cross-correlograms of example CA1 cells from the saline-treatment experiment (Ctrl vs Saline) and CNO-treatment experiment (Ctrl vs CNO). Shuffled examples were obtained by randomly pairing place maps across the same comparison sessions as for the example cells. g, The distributions of correlation-peak shift magnitudes for the place cells in the saline experiment (blue line) and the CNO experiment (red line) differ significantly from the corresponding shuffled distributions (p = 1.94 × 10−107, two-sample Kolmogorov–Smirnov test (KS), two-tailed, n = 606 place cells from Ctrl vs Saline and 1000 shuffles from Ctrl vs Saline; p = 2.05 × 10−97, two-sample KS, two-tailed, n = 379 place cells from Ctrl vs CNO and 1000 shuffles from Ctrl vs CNO). Shuffled distributions were obtained by randomly pairing place maps 1,000 times across the indicated sessions. The distribution of Ctrl vs CNO (red line) is slightly left shifted than Ctrl vs Saline (blue line) (p = 1.69 × 10⁻¹⁰, two-sample KS, two-tailed). h, In the CNO inactivation experiment in the open field, recorded CA1 place cells can be classified into 3 non-overlapping groups termed bit-decrease, bit-increase, and un-recovered, based on the statistical significance of differences in information scores (bits/second) between CNO and Ctrl, and between CNO and Pctrl subject to a jackknife resampling test for each place cell. Un-assigned place cells did not pass the statistical test with jackknife resampling and were excluded from further categorization analysis. On the scatter plot, the x-axis is Ctrl – Pctrl (the difference of spatial information scores between Ctrl and Post-ctrl) and the y-axis is Ctrl – CNO (the difference of information scores between Ctrl and CNO). i, Of the 52 place cells that passed the statistical test from 4 mice, on average, 72% show decreased information scores in CNO sessions compared to the control and post-control sessions (bit-decrease group, green bar); a smaller subset (16%) show increased information scores in CNO compared to the control and post-control (bit-increase group, red bar), and the remaining 12% belong to the unrecovered group (blue bar). There is a significant difference across the group percentage values (p = 0.0033, repeated measures ANOVA, n = 4 mice), while the saline control experiment does not show this difference (Supplementary Fig. 10f). Data are presented as mean ± SE in the bar plots.
Fig. 7.
Fig. 7.. Inactivation of CA1-projecting SUB neurons modulates CA1 neural activity correlated with impaired object-location memory performance.
a, Task schematic and timeline. b, CNO-treated mice (n = 11) exhibit significantly impaired object-location memory (OLM) performance, compared with saline-controls (n = 10), as reflected in the lower discrimination index (two-tailed Welch’s t-test, p = 2 × 10⁻⁵). c, Ensemble Ca++ event rate maps of all cells during training and testing phases from one saline-control mouse (343 cells) and one CNO-treated mouse (182 cells), respectively. The ensemble event rates are the summation of events from all recorded neurons, normalized by time spent at each location. d, No significant differences of ensemble Ca++ event rates between the two objects for both saline-control mice (n = 10, p = 0.274) and CNO-treated mice (n = 11, p = 0.576) are seen during the OLM training phase. P-values are from two-tailed paired t-tests. e, Ensemble Ca++ event rates during the OLM testing phase. We observe significantly higher Ca++ event rates around the displaced object (object 2) compared to that around the stable object (object 1) for saline-control mice (n = 10, p = 0.032). There is no difference of Ca++ event rates around object 2 versus object 1 for CNO-treated mice (n = 11, p = 0.14). P-values are from two-tailed paired t-tests. f, CNO-treated mice (n = 11) do not differ from saline-control mice (n = 10) in terms of the neural discrimination index calculated with ensemble Ca++ event rates during the training session (p = 0.244, two-tailed Welch’s t-test), but show decreased neural discrimination during the testing session (p = 0.0099, two-tailed Welch’s t-test). This neural discrimination index is based on relative event rates and expressed as (ERobject2 – ERobject1) / (ERobject2 + ERobject1) ×100%) wherein ERobject2 and ERobject1 are the ensemble event rates associated with the two objects, respectively. For the box plots throughout the figure, the three box lines from top to bottom represent the 25th, 50th (median), and 75th percentile of data values of the samples. The whiskers extend to the most extreme values within 1.5 times of the interquartile range of the median. Data are presented as mean ± SE in the bar plots.

Similar articles

Cited by

References

    1. Henriksen EJ et al. Spatial representation along the proximodistal axis of CA1. Neuron 68, 127–137, doi:10.1016/j.neuron.2010.08.042 (2010). - DOI - PMC - PubMed
    1. Kjelstrup KB et al. Finite scale of spatial representation in the hippocampus. Science 321, 140–143, doi:10.1126/science.1157086 (2008). - DOI - PubMed
    1. Xu X, Sun Y, Holmes TC & Lopez AJ Noncanonical connections between the subiculum and hippocampal CA1. J Comp Neurol, doi:10.1002/cne.24024 (2016). - DOI - PMC - PubMed
    1. Sun Y et al. Cell-type-specific circuit connectivity of hippocampal CA1 revealed through Cre-dependent rabies tracing. Cell Rep 7, 269–280, doi:10.1016/j.celrep.2014.02.030 (2014). - DOI - PMC - PubMed
    1. Sun Y, Nitz DA, Holmes TC & Xu X Opposing and Complementary Topographic Connectivity Gradients Revealed by Quantitative Analysis of Canonical and Noncanonical Hippocampal CA1 Inputs. eNeuro 5, doi:10.1523/ENEURO.0322-17.2018 (2018). - DOI - PMC - PubMed

Methods-only references

    1. Haettig J, Sun Y, Wood MA & Xu X Cell-type specific inactivation of hippocampal CA1 disrupts location-dependent object recognition in the mouse. Learn Mem 20, 139–146, doi:10.1101/lm.027847.112 (2013). - DOI - PMC - PubMed
    1. Sun Y et al. Neuregulin-1/ErbB4 Signaling Regulates Visual Cortical Plasticity. Neuron 92, 160–173, doi:10.1016/j.neuron.2016.08.033 (2016). - DOI - PMC - PubMed
    1. Kuhlman SJ et al. A disinhibitory microcircuit initiates critical-period plasticity in the visual cortex. Nature 501, 543–546, doi:nature12485 [pii]10.1038/nature12485 (2013). - PMC - PubMed
    1. Sun Y, Grieco SF, Holmes TC & Xu X Local and Long-Range Circuit Connections to Hilar Mossy Cells in the Dentate Gyrus. eNeuro 4, doi:10.1523/ENEURO.0097-17.2017 (2017). - DOI - PMC - PubMed
    1. Seidler B et al. A Cre-loxP-based mouse model for conditional somatic gene expression and knockdown in vivo by using avian retroviral vectors. Proc Natl Acad Sci U S A 105, 10137–10142, doi:10.1073/pnas.0800487105 (2008). - DOI - PMC - PubMed

Publication types