. 2019 Nov;37(11):1302-1313.
doi: 10.1038/s41587-019-0246-4. Epub 2019 Sep 23.

In vivo CRISPR screening in CD8 T cells with AAV-Sleeping Beauty hybrid vectors identifies membrane targets for improving immunotherapy for glioblastoma

Affiliations

In vivo CRISPR screening in CD8 T cells with AAV-Sleeping Beauty hybrid vectors identifies membrane targets for improving immunotherapy for glioblastoma

Lupeng Ye et al. Nat Biotechnol. 2019 Nov.

Abstract

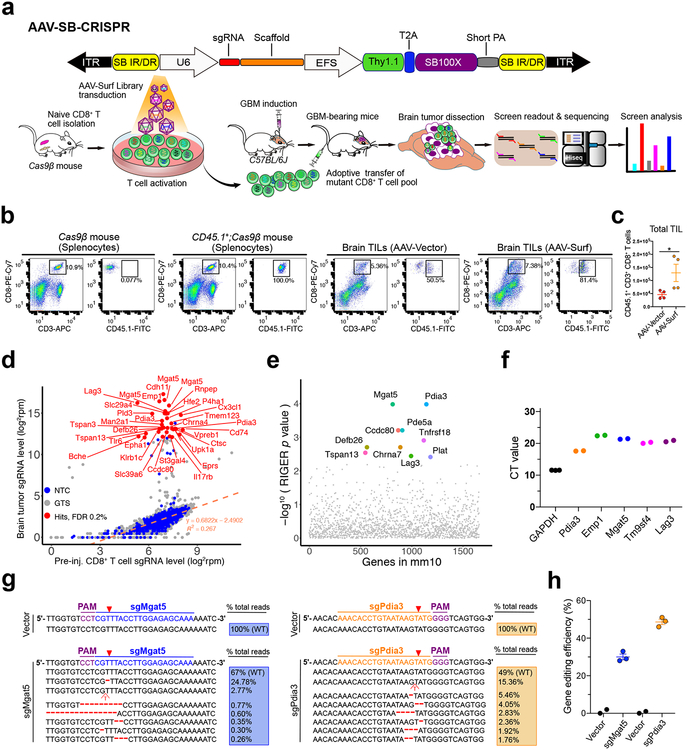
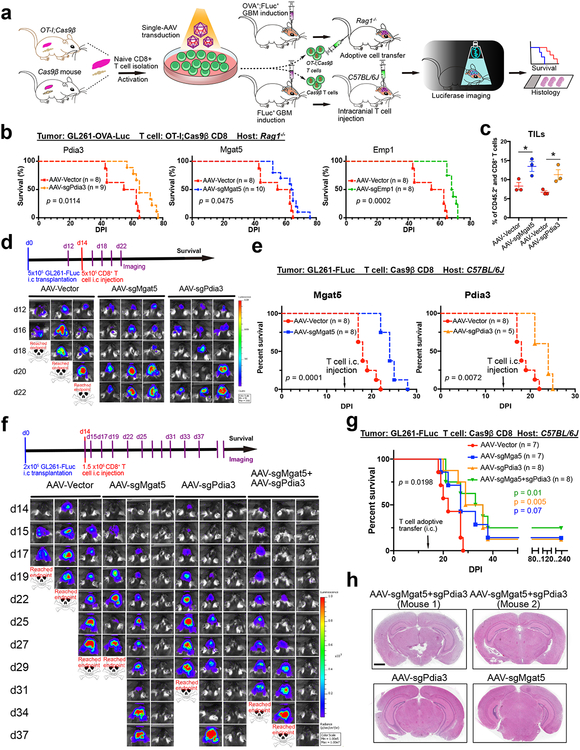
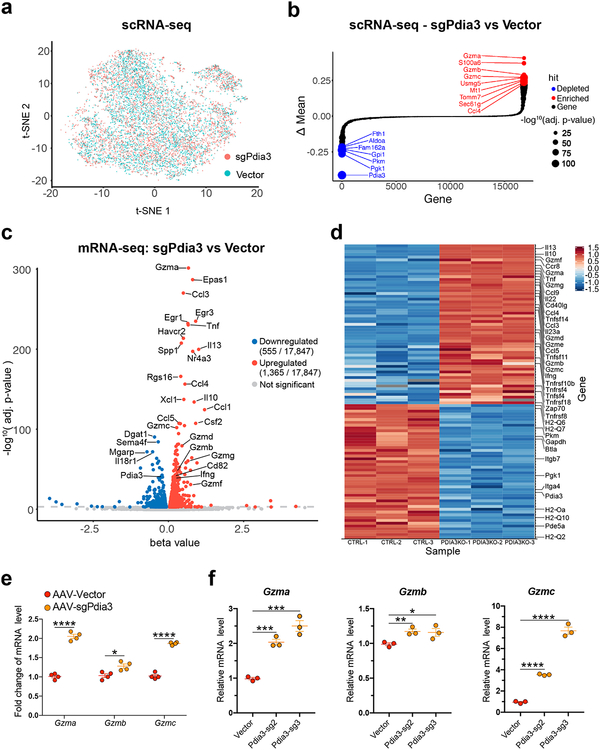
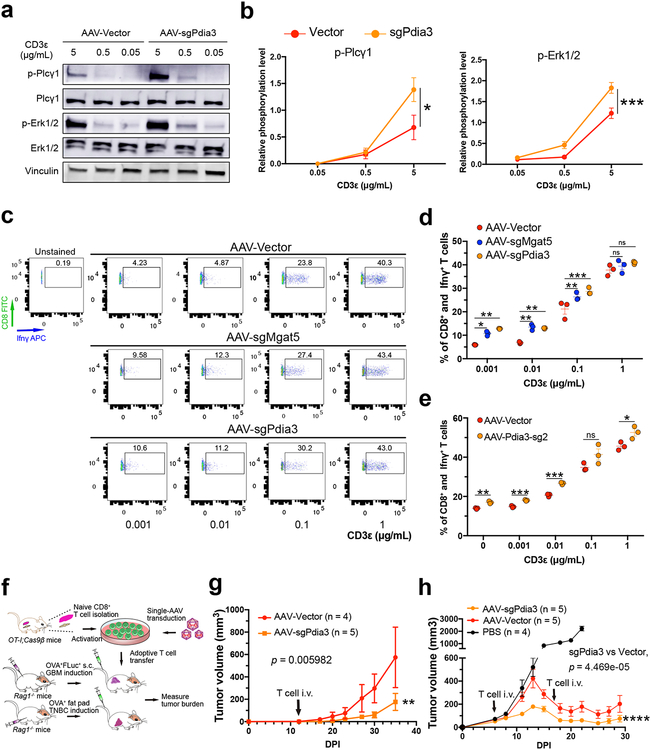
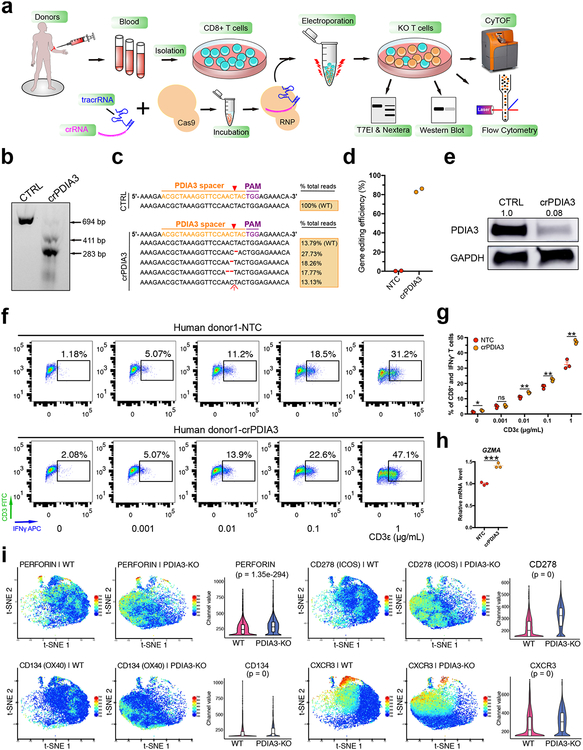
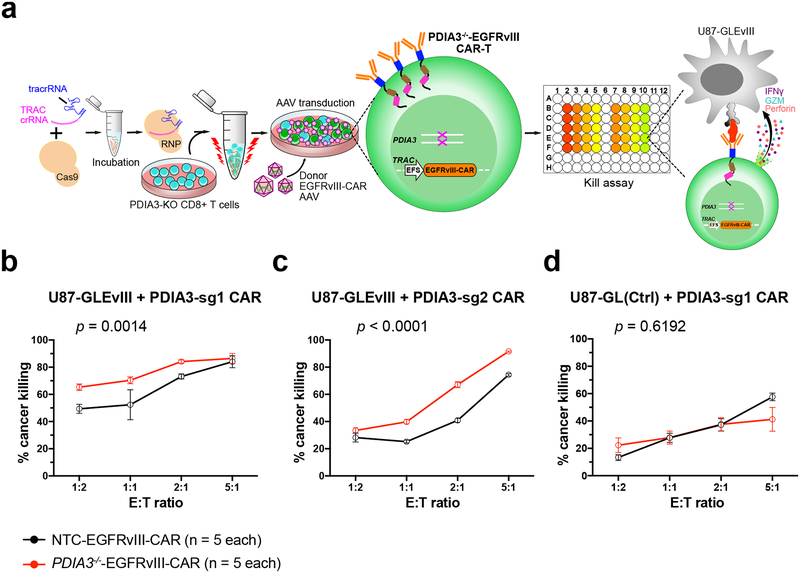
Targeting membrane proteins could improve the efficacy of T cell-based immunotherapies. To facilitate the identification of T cell targets, we developed a hybrid genetic screening system where the Sleeping Beauty (SB) transposon and single guide RNA cassette are nested in an adeno-associated virus (AAV). SB-mediated genomic integration of the single guide RNA cassette enables efficient gene editing in primary murine T cells as well as a screen readout. We performed in vivo AAV-SB-CRISPR screens for membrane protein targets in CD8+ T cells in mouse models of glioblastoma (GBM). We validated screen hits by demonstrating that adoptive transfer of CD8+ T cells with Pdia3, Mgat5, Emp1 or Lag3 gene editing enhances the survival of GBM-bearing mice in both syngeneic and T-cell receptor transgenic models. Transcriptome profiling, single cell sequencing, cytokine assays and T cell signaling analysis showed that Pdia3 editing in T cells enhances effector functions. Engineered PDIA3 mutant EGFRvIII chimeric antigen T cells are more potent in antigen-specific killing of human GBM cells.


Conflict of interest statement

Competing interests declaration

A patent application has been filed related to the data in this manuscript.

Figures

Figure 1.
Figure 1.. In vivo AAV-CRISPR CD8+ T cell screen of membrane bound proteome knockouts in GBM
(a) (Top) Schematics of the hybrid AAV-SB-CRIPSR vector; (Bottom) Schematics of in vivo AAV-SB-CRIPSR screen in a syngeneic mouse model of GBM. Schematics of naïve CD8+ T cell isolation, AAV library transduction, GBM cell transplantation, adoptive cell transfer (ACT), organs isolation, sgRNA readout and deep sequencing. 5 × 10⁵ GL261 cancer cells were injected in to the brain, and 3 × 10⁶ Cas9β CD8+ T cells were intravenously injected after 10 days of tumor engraftment. Brain tumors were dissected at the endpoint of survival. (b) Flow cytometry analysis of TILs in the GBM bearing brain. 5e5 GL261-FLuc cancer cells were injected per mouse, at day 12 after tumor injection, luciferase imaging was performed to reasonably group mice based on luminescence intensity, then 4e6 CD45.1+;Cas9β CD8+ T cells were i.v. injected. Mice were euthanized at day 6 after T cell injection, brains (without olfactory and hindbrain) were dissected for TIL isolation. The i.v. injected CD45.1+;CD3+;CD8+ T cells were quantified and sorted for TCR-seq. Cas9β mouse and CD45.1+;Cas9β mouse splenocytes were used as gating controls. Data was collected from one experiment. (c) Quantification of TIL number after transduction with AAV-Vector and AAV-Surf virus. Data was collected from two mice per group, two independent stainings were performed for each mouse. Data shown are mean ± s.e.m.. * p < 0.05, Mann Whitney test, two-tailed. (d) Bulk analysis for brain tumor vs. cell sgRNA library representation of an AAV-Surf GBM CD8+ T cell screen experiment. A list of most significantly enriched sgRNAs in brain tumors are highlighted as red dots (FDR <= 0.2%). Custom methods by comparing sgRNAs to NTCs were used to estimate enriched sgRNAs (one-sided). FDR was calculated based on the ranks of sgRNAs relative to NTCs. (e) RIGER analysis for brain tumor vs. cell gene level significance of AAV-Surf screen experiment, taken the metrics from multiple sgRNAs. The top 10 most enriched genes (by RIGER p-value, second-best sgRNA method) in brain tumors are highlighted. (f) CD8+ T cell mRNA levels of several top hits from the AAV-Surf GBM screen. The mRNA levels of all candidates were measured with RT-qPCR using gene-specific probes, indicating that all genes tested are expressed in mouse primary CD8+ T cells. (n = 3 for Gapdh, n = 2 for other genes). (g-h) Nextera indel analysis for Mgat5 and Pdia3 knock-out in mouse CD8+ T cells. (g) Representative mutations were shown around predicted sgRNA target sites. (h) Quantification of total indel frequency for each gene were shown, demonstrating that AAV-mediated primary mouse CD8+ T cell gene editing was efficient. (n = 2 for Vector group, n = 3 for sgMgat5 and sgPdia3 groups). Data are shown as mean ± s.e.m.., plus individual data points on the bar graph.
Figure 2.
Figure 2.. In vivo validation and efficacy testing of top candidates by adoptive transfer of mutant CD8+ T cells in mouse models of GBM
(a) Schematic of the pre-clinical therapeutic efficacy testing strategy for top candidates from the AAV- Surf screens using an independent model of GBM immunotherapy, where cancer cells express a cognate cOVA model tumor antigen recognized by CD8+ T cells from TCR transgenic OT-I mice. And a syngeneic mouse model of GBM was used to evaluate therapeutic efficacy by intracranially (i.c) delivering T cells. (b) Survival plots of adoptive transfer top candidate validations in Rag1−/− mice. Mgat5, Pdia3, and Emp1, were chosen for gene editing in CD8+ T cells for therapeutic efficacy testing. All mice were engrafted with 1 × 10⁵ GL261-FLuc-mCh-cOVA cells, and adoptive transfer was performed after 10 days of tumor engraftment by intravenous injection of 1 × 10⁶ OT-I;Cas9β CD8+ T cells infected with AAV-Vector (n = 8), AAV-sgMgat5 (n = 10), AAV-sgPdia3 (n = 9), and AAV- sgEmp1 (n = 8). Vector control from the same group and each gene was plotted against Vector separately for visibility. Survival significance was assessed by a log-rank Mantel-Cox test. (c) Barplot of quantitative results for CD45.2+ and CD8+ CD8+ T cell infiltration in GBM bearing mice (TILs) with or without Mgat5 or Pdia3 knockout (n = 3 for each group). Unpaired t test was used for assess significance. * p < 0.05. Data are shown as mean ± s.e.m., plus individual data points on the bar graph. (d) Representative IVIS images. In vivo imaging illustrate that all mouse brains had a growing tumor at day 12. The luciferase imaging was performed every 2 days using an IVIS system. The tumor growth rate significantly slowed down after injecting T cells infected with AAV- sgMgat5 or AAV-sgPdia3 virus compared with the AAV-Vector group. Data was collected from one independent experiment, each group included 5–8 mice. (e) Survival plots of mice treated with T cells. Survival significance was assessed by a log-rank Mantel-Cox test. DPI, days post tumor implantation. (f) (Top) A time line for tumor induction, T cell i.c injection, and imaging for therapeutic efficacy testing of AAV-SB-CRISPR targeting Pdia3, Mgat5, and combination in CD8+ T cells in a syngeneic mouse model of GBM. C57BL/6J mice were implanted intracranially with 2 × 10⁵ GL261-FLuc cancer cells on day 0. In vivo imaging was performed at day 14 before T cell injection for randomization with tumor-burden matched subgrouping. 1.5 × 10⁶ T cells were injected intracranially at the same coordinate as tumor injection. The luciferase imaging was performed every 2–3 days. (Bottom) Representative IVIS images of brain tumor growth in GL261-FLuc cancer cell injected mice receiving i.c. injection of T cells infected with AAV-Vector, AAV-sgMgat5 and AAV-sgPdia3 virus groups. Data was collected from one independent experiment, each group with 7–8 mice. (g) Survival plot of mice treated with T cells. Overall survival significance was assessed by a log-rank Mantel-Cox test between Vector and mutant groups. Comparison between groups, Log-Rank test. DPI, days post tumor implantation. (h) Whole brain section H&E staining of four long-term survivor mice. Scale bar, 2 mm for whole brain sections. Data was collected from one independent experiment, survivor mice were from the same experiment as in f-g. The p-values and number of mice used in each group are indicated in the plots and/or in a supplemental excel table.
Figure 3.
Figure 3.. Single-cell RNA-seq and bulk mRNA-seq analysis of Pdia3 knockout in CD8+ T cells
(a) t-SNE plot of sample distribution based on the transcriptome of 9,193 single cells from AAV-sgPdia3 and AAV-Vector treated CD8+ T cells. (b) Bubble-rank plot of differential gene expression of scRNA-seq. Delta-mean is the difference of mean expression value between AAV-sgPdia3 and AAV-Vector treated single CD8+ T cells (n = 3 each group). Differential expression: Two-sided Wilcoxon signed-rank test by gene, with p-values adjusted by Benjamini & Hochberg. Statistical significance is scaled by –log10, p-value as shown in the size key. (c) A volcano plot of all differentially expressed genes between AAV-Vector and AAV-sgPdia3 transduced mouse primary CD8+ T cells (n = 3 biological replicates). Differential gene expression was performed with Sleuth using Wald test, the FDR adjusted q-value was used for the plot. (d) Heatmap of representative immune-related differentially expressed genes between AAV-Vector and AAV-sgPdia3 transduced mouse primary CD8+ T cells (n = 3 biological replicates). (e) RT-qPCR validation of the scRNA-seq and bulk mRNA-seq results confirmed the upregulation of granzyme genes upon AAV-sgPdia3 perturbation (n = 4). Unpaired t test, two-tailed. * p < 0.05, **** p < 0.0001. (f) RT-qPCR validation of scRNA-seq and bulk mRNA-seq results using two independent Pdia3 sgRNAs (n =3). Unpaired t test, two-tailed. * p < 0.05, ** p < 0.01, *** p < 0.001, **** p < 0.0001. The p-values and number of mice used in each group are indicated in the plots and/or in a supplemental excel table.
Figure 4.
Figure 4.. Mechanistic analysis and pre-clinical efficacy testing of Pdia3 knockout in CD8+ T cells
(a-b) Dose-dependent TCR signaling experiment for Pdia3 KO showing upregulation of the phosphorylation level of Plcγ and Erk1/2. (a) Original western blot gel of a representative experiment among the three independent replicate experiments. (b) Quantification of relative phosphorylation level of Plcγ and Erk1/2, (n = 3). Data are shown as mean ± s.e.m.. Two-way ANOVA, sgPdia3 vs vector, * p < 0.05, *** p < 0.001. (c-e) Intracellular flow cytometry was performed to detect the expression levels of Ifnγ. The OT-I;Cas9β CD8+ T cells were infected with AAV-Vector and AAV-sgMgat5 or AAV-sgPdia3 after isolation. Before Ifnγ detection assay, T cells were rested for 12 h, then reactivated with different concentration of anti-CD3ε for 4 h. (c) Flow cytometry results suggested that Mgat5 or Pdia3 knockout significantly improved T cell sensitivity to the low concentration anti-CD3ε and secreted more Ifnγ. (d) The quantification result of (c). (e) Ifnγ intracellular staining after Pdia3 KO using a different sgRNA. Two-sided multiple t test was used to assess the significance, Holm-Sidak method was used for multiple comparisons correction. * p < 0.05, ** p < 0.01, *** p < 0.001, ns, not significant. (f) Schematic of the therapeutic efficacy testing strategy for Pdia3 knockout T cell using a subcutaneous model of GBM and a syngeneic triple-negative breast cancer (TNBC) model. (g) Tumor growth curves of GL261-FLuc-mCh-cOVA tumor bearing mice receiving T cells infected with AAV-Vector (n = 4) or AAV-sgPdia3 (n = 5). Wilcoxon rank sum test with continuity correction, two sided, p = 0.005982. DPI, days post tumor implantation. (h) Tumor growth curves of E0771-mCh-cOVA TNBC bearing mice receiving CD8+ T cell therapy. Wilcox test, two sided, using only data points on or after T cell adoptive transfer: AAV-Vector vs. AAV-sgPdia3, p < 0.001. DPI, days post tumor implantation. The p-values and number of mice used in each group are indicated in the plots and/or in a supplemental excel table.
Figure 5.
Figure 5.. Human CD8+ T cells PDIA3 knockout and effector function analysis
(a) Schematics of human CD8+ T cell isolation, culture, RNP electroporation, T7EI assay, Nextera sequencing, Flow cytometry and CyTOF analysis. (b) T7EI assay showed human PDIA3 knockout with a high efficiency compared with control. Arrows pointed to pre- and post- cleavage products of predicted sizes. Data shown are representative of three independent experiments. (c) Nextera data quantification of gene editing efficiency of (b). (d) Quantification of Nextera data (n = 2 each). (e) Western blot for PDIA3 change in protein level upon CRISPR knockout. Data from one experiment. (f) IFNγ intracellular staining after PDIA3 KO. (g) Quantification of (f). Two-sided multiple t test was used to assess the significance. Holm-Sidak method was used for multiple comparisons correction. * p < 0.05, ** p < 0.01, ns, not significant. The p-values and number of mice used in each group are indicated in the plots and/or in a supplemental excel table. (h) qPCR validation of GZMA expression. Unpaired t test, two-tailed. *** p < 0.001. (i) t-SNE plots of representative markers detected by the CyTOF. Perforin, two co-stimulatory molecules (CD134/OX40 and CD278/ICOS) and CXCR3 were found to be significantly upregulated at the single cell level upon PDIA3 KO (n = 3 replicates each, sampled 7,000 cells per replicate for comparison). Violin plots were used for visualizing marker levels quantitatively in single cells. Violins show kernel probability density on side, and boxplot is standard, i.e. middle band is median, hinges/ends of box are interquartile range (25% and 75% quantiles), lower whisker = smallest observation greater than or equal to lower hinge - 1.5 * IQR, upper whisker = largest observation less than or equal to upper hinge + 1.5 * IQR. Wilcoxon test, two-sided, p value adjusted by Benjamini & Hochberg method. KO vs WT, PERFORIN, p = 1.35e-294; CD278, p = 0 (below algorithm detection limit); CD134, p = 0; CXCR3, p = 0.
Figure 6.
Figure 6.. Human PDIA3−/−-EGFRvIII CAR-T cell establishment and GBM cell killing
(a) Schematics of human PDIA3−/−-EGFRvIII CAR-T cell generation. CD8 T cells were electroporated with crPDIA3:tracRNA:Cas9 first, then PDIA3−/− T cells were knock-in (KI) with an EGFRvIII-CAR construct which consists of TRAC locus homology-directed repair (HDR) 5’ and 3’ arms, an EFS promoter, an EGFRvIII-CAR expression cassette, and a short polyA. The donor KI constructs were packaged into AAV6, then introduced into T cells by viral transduction after TRAC first-exon targeting RNP electroporation. U87-GFP-Luc-EGFRvIII (U87-GLEvIII) and PDIA3−/−-EGFRvIII CAR-T cell co-culture assay was set up after CAR-T cells were established to test PDIA3−/−-EGFRvIII CAR-T cell killing ability. (b-d) Kill assay of NTC-EGFRvIII-CAR and PDIA3−/−-EGFRvIII-CAR T cells with U87-GLEvIII and U87-GL (parental line control) human GBM cells, with a titration series of Effector : Target (E:T) ratios at 24h post co-culture: (b) Kill assay with PDIA3-sg1, on U87-GLEvIII cells; (c) Kill assay with PDIA3-sg2, on U87-GLEvIII cells; (d) Kill assay with PDIA3-sg1, on U87-GL parental control cells; Data are shown as mean ± s.e.m., plus individual data points, n = 5 biological replicates. Two-way ANOVA test was used to evaluated significance. The p-values and number of mice used in each group are indicated in the plots and/or in a supplemental excel table.

Similar articles

Cited by

References

    1. Chen DS & Mellman I Oncology meets immunology: the cancer-immunity cycle. Immunity 39, 1–10 (2013). - PubMed
    1. Tumeh PC et al. PD-1 blockade induces responses by inhibiting adaptive immune resistance. Nature 515, 568-+ (2014). - PMC - PubMed
    1. Kvistborg P et al. Anti-CTLA-4 therapy broadens the melanoma-reactive CD8(+) T cell response. Science Translational Medicine 6 (2014). - PubMed
    1. Ribas A Tumor Immunotherapy Directed at PD-1. New Engl J Med 366, 2517–2519 (2012). - PubMed
    1. Pardoll DM The blockade of immune checkpoints in cancer immunotherapy. Nature reviews. Cancer 12, 252–264 (2012). - PMC - PubMed

Publication types

MeSH terms