. 2019 Oct;68(10):1621-1633.
doi: 10.1007/s00262-019-02393-x. Epub 2019 Sep 23.

The BRCA2 mutation status shapes the immune phenotype of prostate cancer

Affiliations

The BRCA2 mutation status shapes the immune phenotype of prostate cancer

Maximilian Jenzer et al. Cancer Immunol Immunother. 2019 Oct.

Abstract

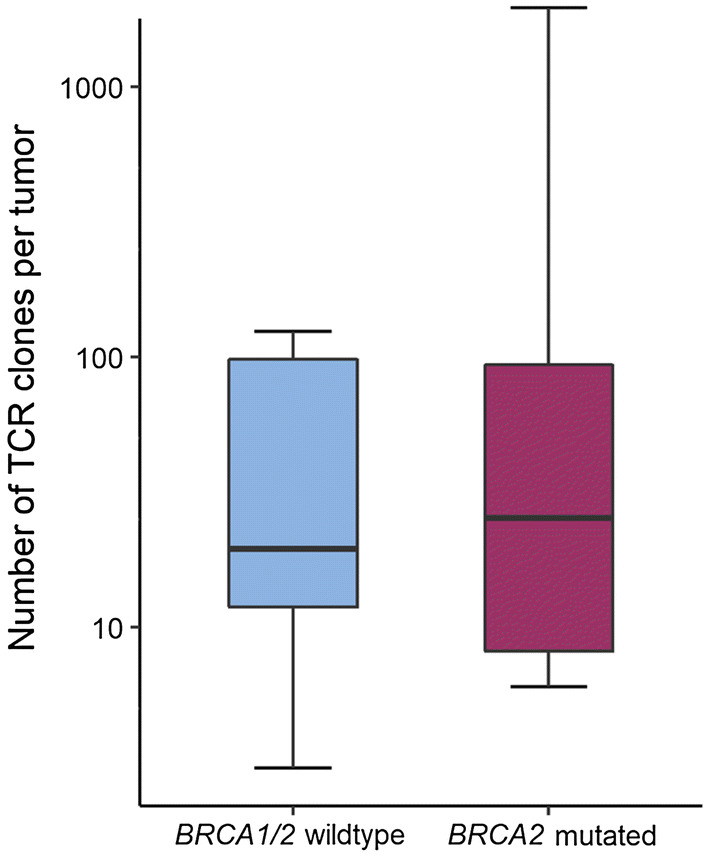
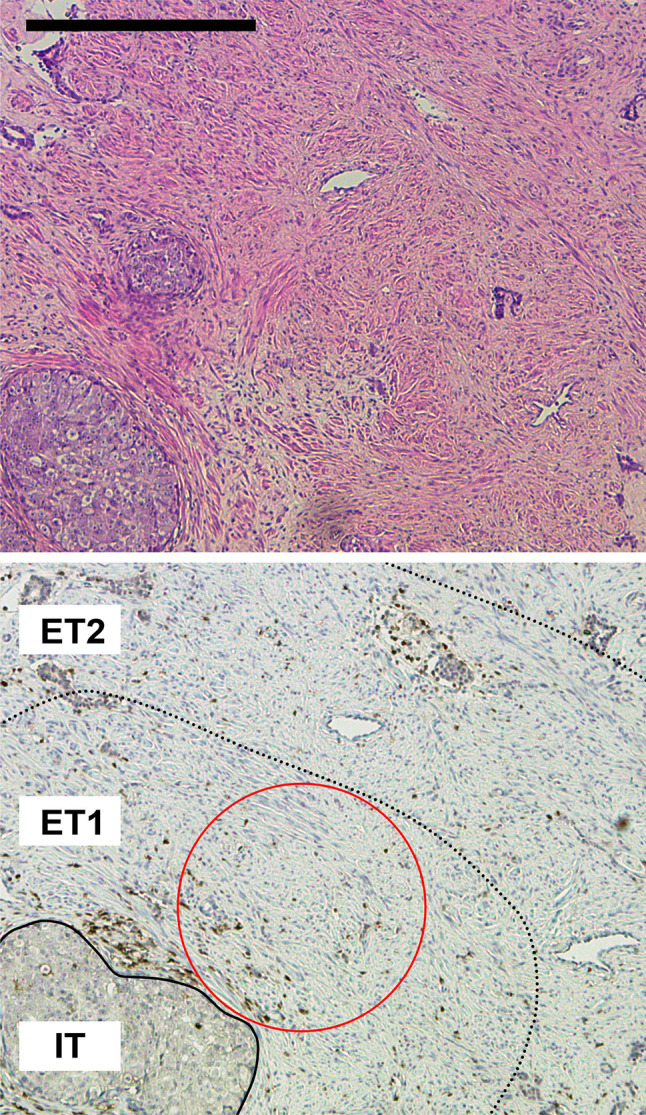
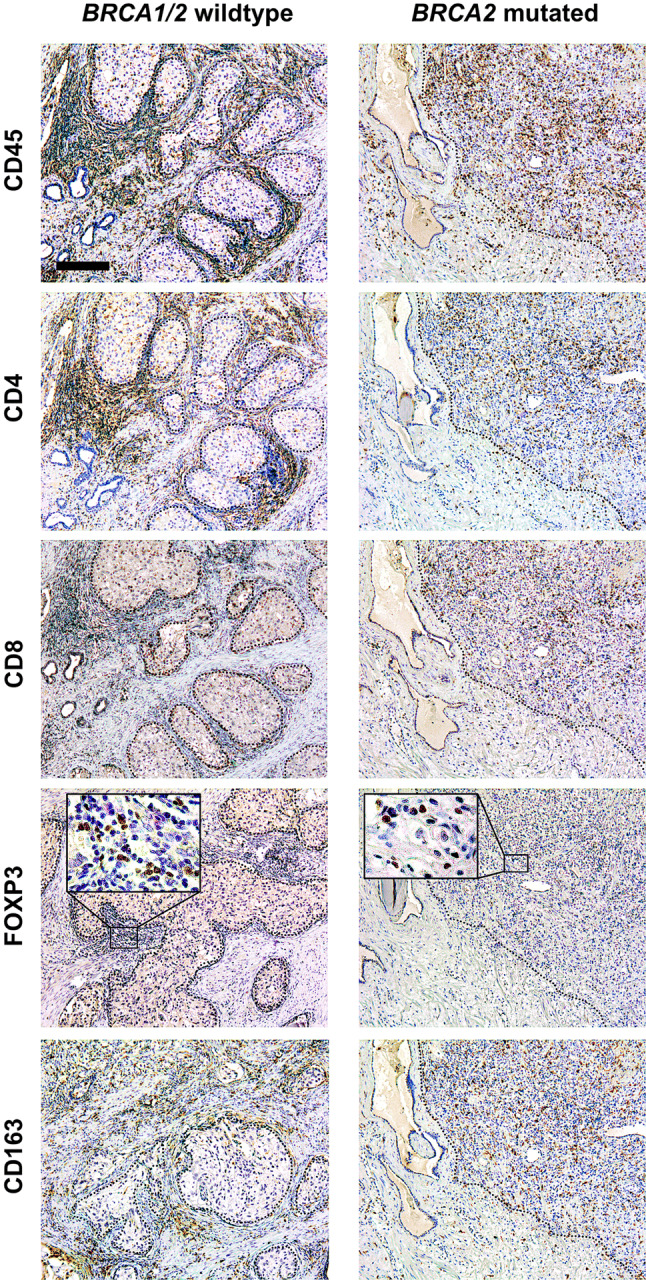
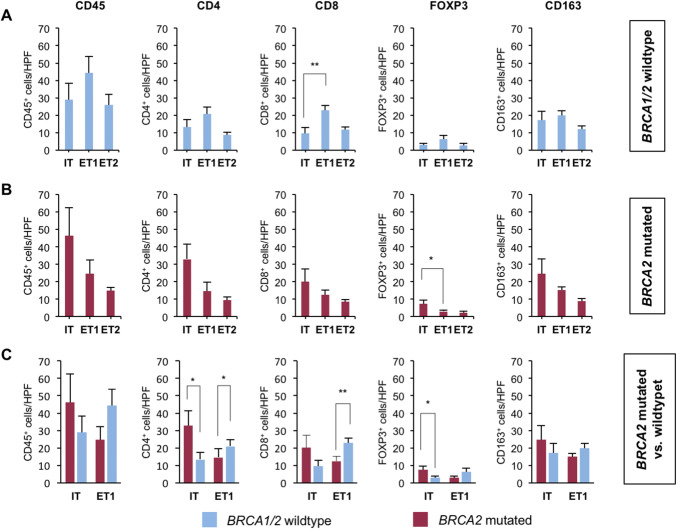
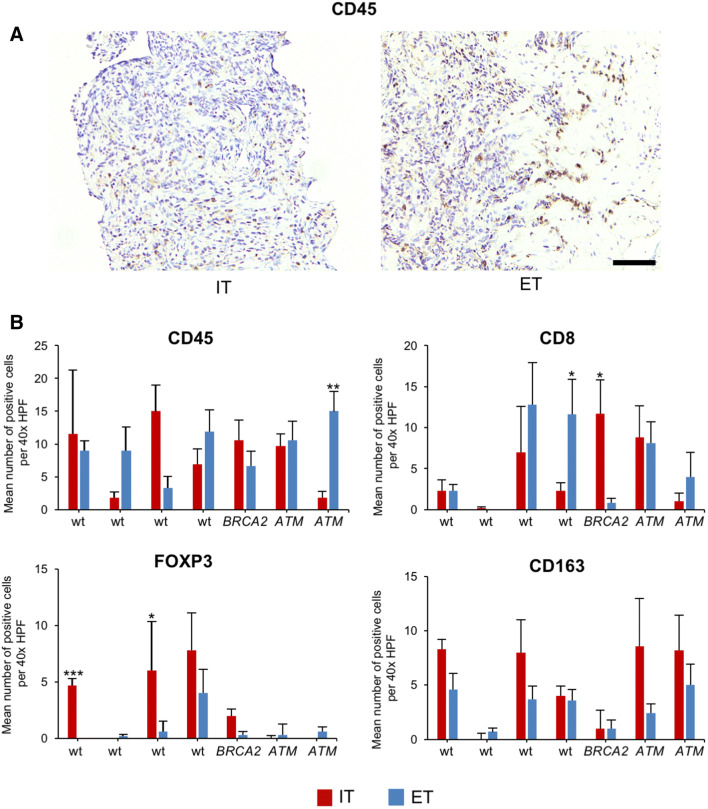
Defects in DNA damage repair caused by mutations in BRCA1/2, ATM or other genes have been shown to play an important role in the development and progression of prostate cancer. The influence of such mutations on anti-tumor immunity in prostate cancer, however, is largely unknown. To better understand the correlation between BRCA1/2 mutations and the immune phenotype in prostate cancer, we characterized the immune infiltrate of eight BRCA2-mutated tumors in comparison with eight BRCA1/2 wild-type patients by T-cell receptor sequencing and immunohistochemistry for CD45, CD4, CD8, FOXP3, and CD163. In addition, we analyzed seven prostate cancer biopsies that were either BRCA2 or ATM-mutated in comparison with wild-type tumors. Whereas in BRCA1/2 wild-type tumors, immune cells were found predominantly extratumorally, most BRCA2-mutated tumors including one biopsy showed a significantly increased intratumoral immune cell infiltration. The ratio of intratumoral to extratumoral immune cells was considerably higher in BRCA2-mutated tumors for all markers and reached statistical significance for CD4 (p = 0.007), CD8 (p = 0.006), and FOXP3 (p = 0.001). However, the intratumoral CD8 to FOXP3 ratio showed a trend to be lower in BRCA2-mutated tumors suggesting a more suppressed tumor immune microenvironment. Our findings provide a rationale for the future use of immune oncological approaches in BRCA2-mutated prostate cancer and may encourage efforts to target immunosuppressive T-cell populations to prime tumors for immunotherapy.

Keywords: BRCA1/2; Homologous recombination deficiency; Immune checkpoint inhibitors; Prostate cancer; Tumor microenvironment; Tumor-infiltrating lymphocytes.


Conflict of interest statement

The authors declare that they have no potential conflict of interest.

Figures

Fig. 1
Fig. 1
Number of TCR clones per tumor by BRCA1/2 mutation status. Box plots represent the median number of identified TCR clones per sample in BRCA1/2 wild-type (blue) and BRCA2-mutated (red) prostate cancer identified by TCR sequencing. Whiskers representing minimum and maximum of each group. A log10 scale is used for the y-axis
Fig. 2
Fig. 2
Overview of tumor and microenvironmental compartments analyzed. Representative H&E (top panel) and immunohistochemical (bottom panel) staining of prostate cancer for CD45 showing the three compartments intratumoral (IT), extratumoral 1 (ET1) and extratumoral 2 (ET2) used in this study. The red circle stands for a representative high-power field (40-fold objective, 500 µm in diameter) in the ET1 compartment. The scale bar represents 500 µm
Fig. 3
Fig. 3
Overview of immunohistochemical stainings. Representative immunohistochemical stainings for CD45 (pan-leucocyte), CD4 (T helper cells), CD8 (cytotoxic T cells), FOXP3 (regulatory T cells), and CD163 (macrophages) on consecutive slides of a BRCA1/2 wild-type and a BRCA2-mutated prostate cancer. The dotted line represents the border between tumor and stroma. Scale bar represents 200 µm
Fig. 4
Fig. 4
BRCA2-mutated tumors harbor more intratumoral immune cells. a, b Bar graphs show the mean number of positive cells (+ standard error) per 40 × HPF in BRCA2-mutated or BRCA1/2 wild-type prostate cancer in the intratumoral (IT), extratumoral 1 (ET1), and extratumoral 2 (ET2) compartments for CD45, CD4, CD8, FOXP3, and CD163. c Bar graphs show the mean number of positive cells (+ standard error) per 40 × HPF in BRCA2-mutated compared to BRCA1/2 wild-type prostate cancer in the intratumoral (IT) and extratumoral 1 (ET1) compartments for CD45, CD4, CD8, FOXP3, and CD163. Each bar represents the mean of five 40 × HPF from the eight patients of each group i.e., BRCA1/2 wild type and BRCA2 mutated. BRCA1/2 wild-type tumors in blue, BRCA2-mutated tumors in red. Standard errors are shown. *p ≤ 0.05, **p ≤ 0.005
Fig. 5
Fig. 5
Shift in immune cell distribution in BRCA2-mutated tumors as reflected by the IT/ET ratio. Bar graphs show the ratio of mean positive cell counts from five representative HPF each of the intratumoral (IT) and extratumoral closest to the tumor (ET1) compartment of each patient sorted from highest to lowest for CD45 (a), CD4 (b), CD8 (c), FOXP3 (d), and CD163 (e). A log10 scale is used for the y-axis. f Bar graph showing mean IT/ET1 ratio for all eight patients of each group for CD45, CD4, CD8, FOXP3, and CD163. BRCA1/2 wild-type tumors in blue, BRCA2-mutated tumors in red. Standard errors are shown. *p ≤ 0.05, **p ≤ 0.005
Fig. 6
Fig. 6
Intratumoral CD8/FOXP3 ratio is reduced in BRCA2-mutated tumors. Waterfall plot of intratumoral CD8/FOXP3 ratios in BRCA1/2 wild-type (blue) and BRCA2-mutated (red) prostate cancer
Fig. 7
Fig. 7
Immune phenotype of prostate cancer biopsies from BRCA2- or ATM-mutated tumors. a Representative immunohistochemical staining of prostate cancer biopsies for CD45 showing the intratumoral (IT) area (left) and an IT area with adjacent extratumoral (ET) area (right). The scale bar represents 250 µm. b Bar graphs show the mean number of positive cells per 40 × HPF in BRCA2-mutated or ATM-mutated biopsies compared to wild-type (wt) specimens in the intratumoral (IT) and extratumoral (ET) compartments for CD45, CD8, FOXP3, and CD163. Each bar represents counts from a mean of six 40 × HPFs. Standard errors are shown. *p ≤ 0.05, **p ≤ 0.005, ***p ≤ 0.0005

References

    1. Ferlay J, Steliarova-Foucher E, Lortet-Tieulent J, Rosso S, Coebergh JW, Comber H, Forman D, Bray F. Cancer incidence and mortality patterns in Europe: estimates for 40 countries in 2012. Eur J Cancer. 2013;49(6):1374–1403. doi: 10.1016/j.ejca.2012.12.027. - DOI - PubMed
    1. Siegel RL, Miller KD, Jemal A. Cancer statistics. CA Cancer J Clin. 2018;68(1):7–30. doi: 10.3322/caac.21442. - DOI - PubMed
    1. Pritchard CC, Mateo J, Walsh MF, De Sarkar N, Abida W, Beltran H, Garofalo A, Gulati R, Carreira S, Eeles R, Elemento O, Rubin MA, Robinson D, Lonigro R, Hussain M, Chinnaiyan A, Vinson J, Filipenko J, Garraway L, Taplin ME, AlDubayan S, Han GC, Beightol M, Morrissey C, Nghiem B, Cheng HH, Montgomery B, Walsh T, Casadei S, Berger M, Zhang L, Zehir A, Vijai J, Scher HI, Sawyers C, Schultz N, Kantoff PW, Solit D, Robson M, Van Allen EM, Offit K, de Bono J, Nelson PS. Inherited DNA-repair gene mutations in men with metastatic prostate cancer. N Engl J Med. 2016;375(5):443–453. doi: 10.1056/NEJMoa1603144. - DOI - PMC - PubMed
    1. Hall JM, Lee MK, Newman B, Morrow JE, Anderson LA, Huey B, King MC. Linkage of early-onset familial breast cancer to chromosome 17q21. Science. 1990;250(4988):1684–1689. doi: 10.1126/science.2270482. - DOI - PubMed
    1. Wooster R, Neuhausen SL, Mangion J, Quirk Y, Ford D, Collins N, Nguyen K, Seal S, Tran T, Averill D, et al. Localization of a breast cancer susceptibility gene, BRCA2, to chromosome 13q12-13. Science. 1994;265(5181):2088–2090. doi: 10.1126/science.8091231. - DOI - PubMed