. 2020 Jan 8;28(1):217-234.
doi: 10.1016/j.ymthe.2019.09.003. Epub 2019 Sep 6.

A NeuroD1 AAV-Based Gene Therapy for Functional Brain Repair after Ischemic Injury through In Vivo Astrocyte-to-Neuron Conversion

Affiliations

A NeuroD1 AAV-Based Gene Therapy for Functional Brain Repair after Ischemic Injury through In Vivo Astrocyte-to-Neuron Conversion

Yu-Chen Chen et al. Mol Ther. .

Abstract

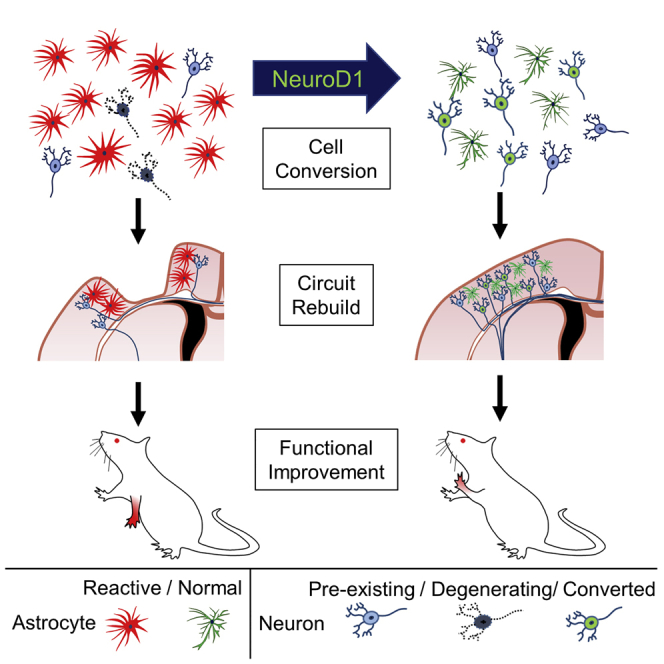
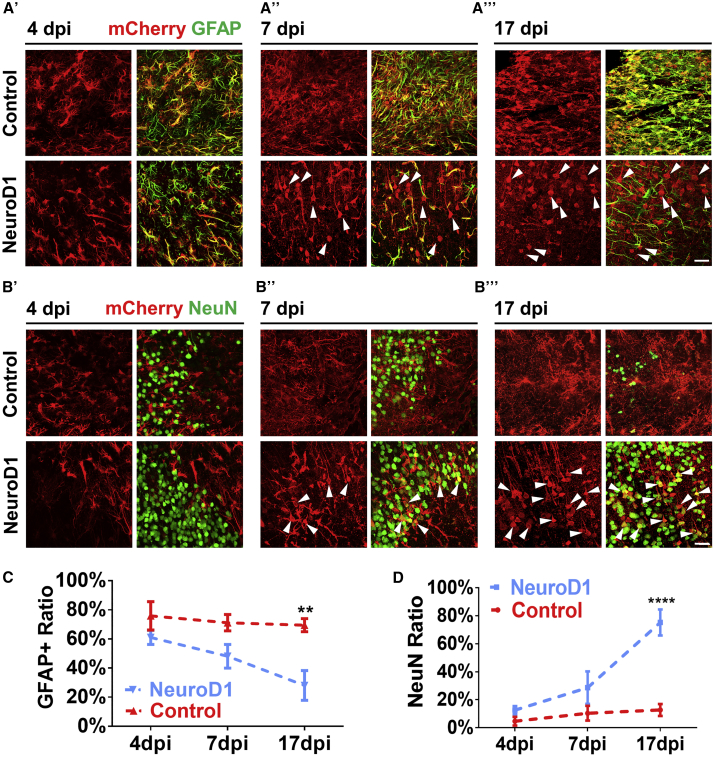
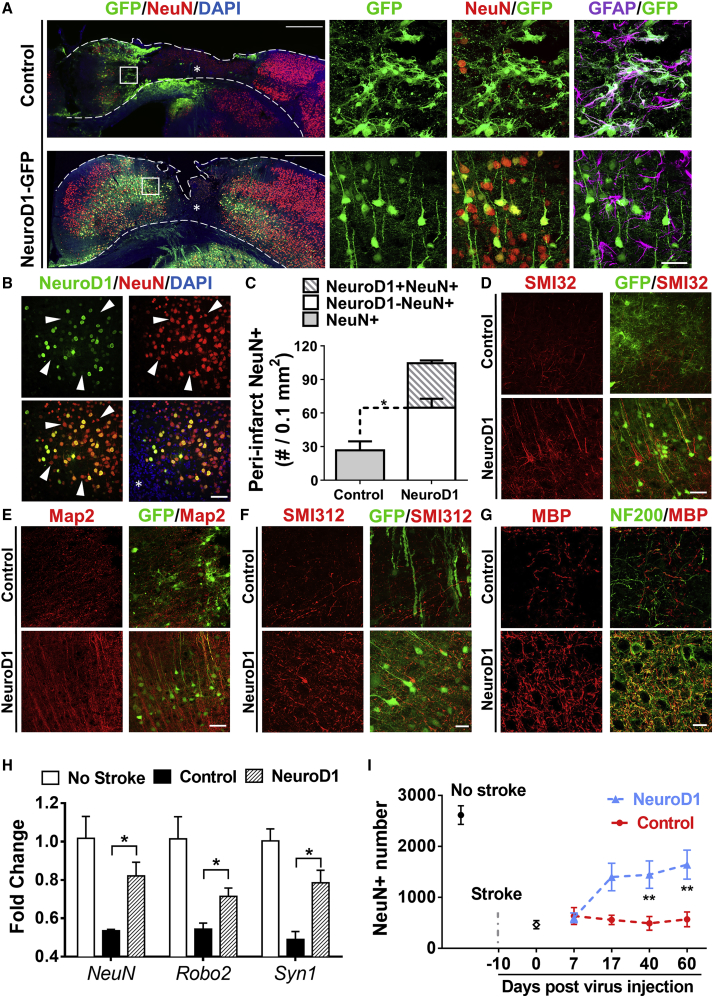
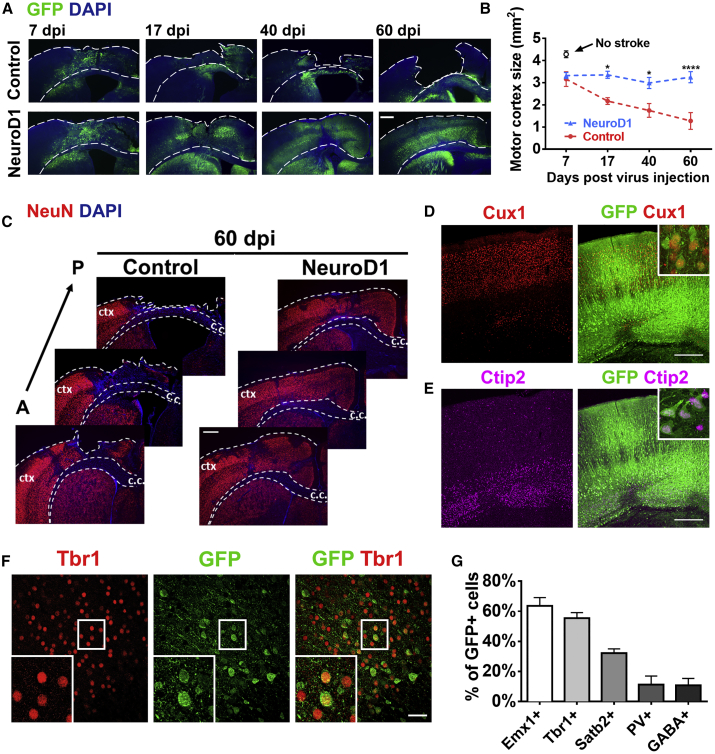
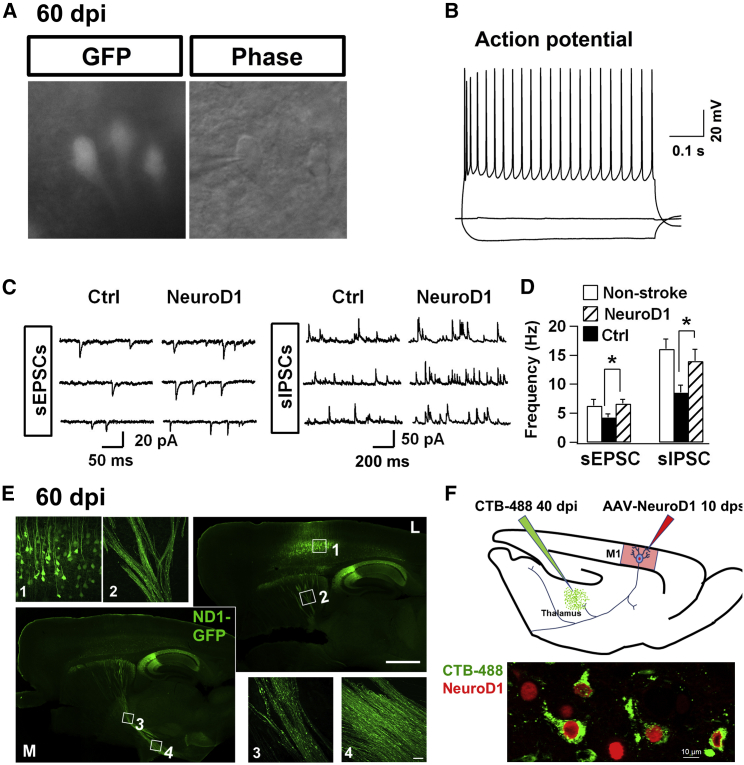
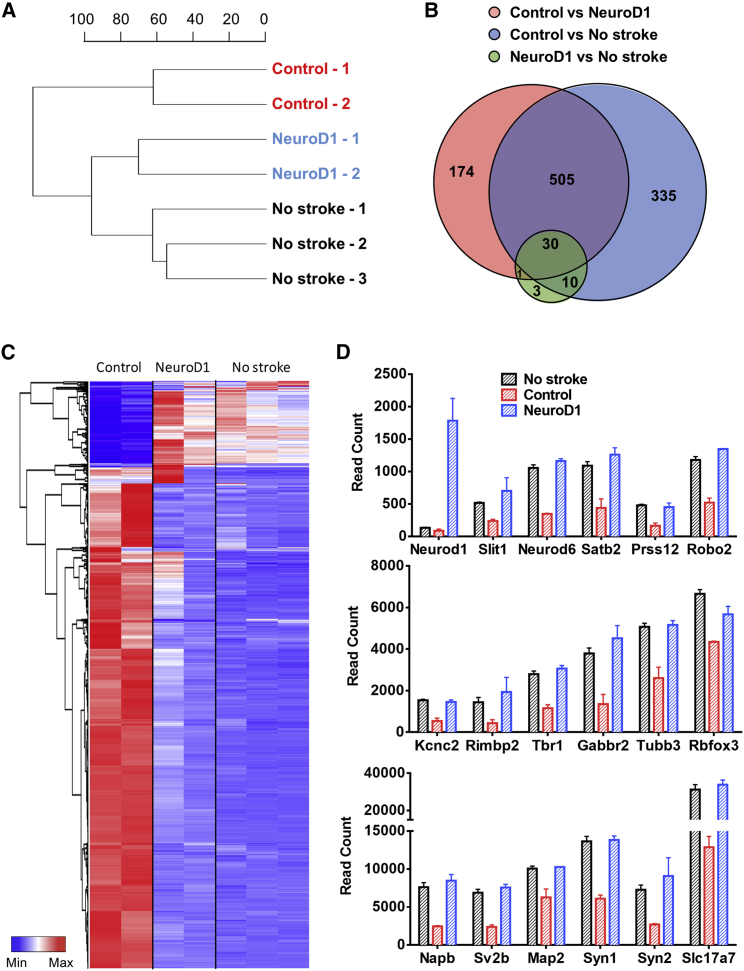
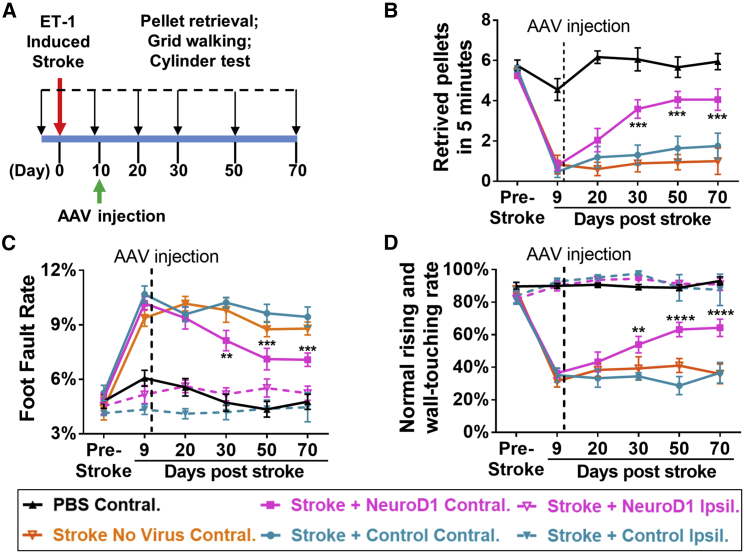
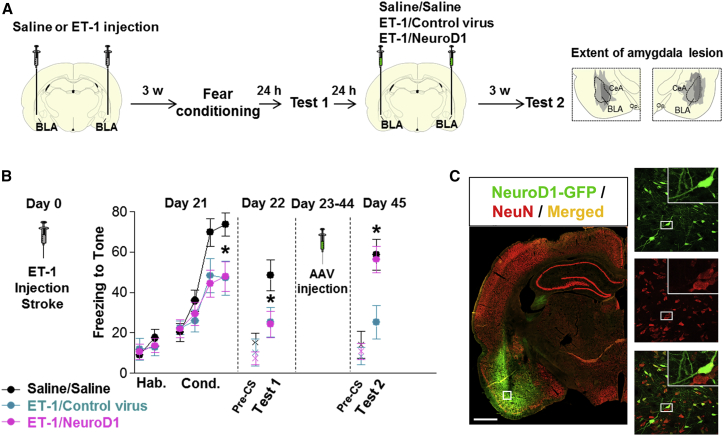
Adult mammalian brains have largely lost neuroregeneration capability except for a few niches. Previous studies have converted glial cells into neurons, but the total number of neurons generated is limited and the therapeutic potential is unclear. Here, we demonstrate that NeuroD1-mediated in situ astrocyte-to-neuron conversion can regenerate a large number of functional new neurons after ischemic injury. Specifically, using NeuroD1 adeno-associated virus (AAV)-based gene therapy, we were able to regenerate one third of the total lost neurons caused by ischemic injury and simultaneously protect another one third of injured neurons, leading to a significant neuronal recovery. RNA sequencing and immunostaining confirmed neuronal recovery after cell conversion at both the mRNA level and protein level. Brain slice recordings found that the astrocyte-converted neurons showed robust action potentials and synaptic responses at 2 months after NeuroD1 expression. Anterograde and retrograde tracing revealed long-range axonal projections from astrocyte-converted neurons to their target regions in a time-dependent manner. Behavioral analyses showed a significant improvement of both motor and cognitive functions after cell conversion. Together, these results demonstrate that in vivo cell conversion technology through NeuroD1-based gene therapy can regenerate a large number of functional new neurons to restore lost neuronal functions after injury.

Keywords: AAV; NeuroD1; astrocyte-to-neuron conversion; brain repair; fear conditioning learning; gene therapy; ischemic injury; motor function.


Figures

None
Graphical abstract
Figure 1
Figure 1
NeuroD1-Mediated Astrocyte-to-Neuron Conversion in a Focal Stroke Model (A) Tissue loss caused by focal ischemic injury. Injection of ET-1 (1–31) into mouse motor cortex led to a gradual tissue loss in 10 weeks. Dashed lines indicate cortical areas. White bar (3 mm) indicates the cortical areas being quantified for tissue loss. Scale bars, 3 mm. (B) Quantification of the remaining cortical tissue (from the midline to 3 mm lateral area, white bar) at 1, 4, and 10 weeks after ischemic injury in the motor cortex (n = 3 for each time point). (C and D) Assessing reactive astrocytes after ischemic injury. Immunostaining of NeuN and GFAP at 5 days (C) and 10 days post stroke (dps) (D) revealed reactive astrocytes at 10 dps. c.c., corpus callosum; ctx, cortex. Scale bars, left panel 200 μm, right panel 40 μm. (E) Retroviruses expressing GFP alone (top row) or NeuroD1-GFP (bottom row), illustrating neuronal conversion by NeuroD1. Viral injection at 10 dps and immunostaining at 17 dpi. Scale bar, 20 μm. (F) Injection of AAV9 expressing GFP alone (hGFAP::GFP, top row) or NeuroD1-GFP (hGFAP::NeuroD1-P2A-GFP, bottom row), illustrating more neurons generated by AAV than retroviruses. Scale bar, 40 μm. (G) Capture of the transitional stage from astrocytes (GFAP) to neurons (NeuN) at early time points of NeuroD1 expression (4 dpi). Injection of AAV9 hGFAP::Cre and CAG::FLEX-NeuroD1-P2A-mCherry resulted in significant NeuroD1 expression in GFAP-labeled astrocytes (top row). Interestingly, some NeuroD1-mCherry labeled cells showed both NeuN and GFAP signal (bottom row), suggesting a transition stage from astrocytes to neurons. Scale bars, upper 40 μm and lower insets 20 μm. (H) Experimental outline for ischemic injury, AAV injection (Cre-FLEX system), and immunostaining analysis. Scale bar, 40 μm. (I) Detection of a large number of NeuroD1-converted neurons using AAV Cre-FLEX system. At 17 dpi, the GFP control group showed many GFAP+ reactive astrocytes (top row, GFAP in purple), whereas the majority of NeuroD1-GFP labeled cells became NeuN-positive (red) neurons (bottom row).
Figure 2
Figure 2
NeuroD1 Gradually Converts Reactive Astrocytes into Neurons after Stroke (A’–A’’’) Identification of astrocytes with GFAP immunostaining at 4 (A’), 7 (A’’), or 17 (A’’’) days post viral injection (dpi) in control (mCherry alone, top row) and NeuroD1-mCherry (bottom row) infected areas. Scale bar, 40 μm. (B’–B’’’) Identification of neurons with NeuN immunostaining at 4 (B’), 7 (B’’), or 17 dpi (B’’’). Arrowheads indicate some of the NeuroD1-converted neurons. Scale bar, 40 μm. (C and D) Quantification of GFAP+ cells (C) or NeuN+ cells (D) among all viral infected cells. Note a significant decrease of astrocytes (C) accompanied with a significant increase of neurons (D) in NeuroD1 group. **p < 0.01, ****p < 0.0001. Two-way ANOVA followed by Sidak’s multiple comparison test. n = 3 mice per group. Three images were randomly taken in cortical areas with viral infection. Data are represented as mean ± SEM.
Figure 3
Figure 3
High Efficiency of Neuroregeneration Achieved by NeuroD1-Mediated Astrocyte-to-Neuron Conversion (A) Comparison of the NeuN signal in the motor cortex (17 dpi) between the control (top row) and NeuroD1 groups (bottom row). Left panels show the overall NeuN distribution after ischemic injury and viral injection; right panels show enlarged images of the peri-injury core areas. Note that NeuroD1-infected cells (green) were mostly converted into NeuN+ neurons (yellow), but GFAP+ astrocytes (purple) still persisted in the same areas. Scale bars, 500 μm for left panels and 40 μm for right panels. (B) NeuroD1-converted neurons (green and yellow) were intermingled with non-converted neurons (red, arrowheads) in the injury areas. Scale bar, 40 μm. (C) Quantification of total NeuN+ cells in the peri-injury core areas of control group and NeuroD1 group, as well as non-injured cortical areas. Note that the number of non-converted neurons in the NeuroD1 group (white bar) more than doubled the number in the control group, suggesting a neuroprotective effect of NeuroD1 conversion. n = 3 mice in each group. *p < 0.05. Two-way ANOVA followed by Sidak’s multiple comparison tests. Data are represented as mean ± SEM. (D and E) Immunostaining of neuronal dendrite markers SMI32 (D) and MAP2 (E) show much improved neuronal morphology in the NeuroD1 group (bottom row) compared to the control group (top row). Scale bar, 40 μm. (F and G) Immunostaining of axonal marker SMI312 (F), NF200 (G), and axon myelination marker MBP (G) show increased axons and axonal myelination in the NeuroD1 group (bottom row) compared to the control group (top row). Scale bar, 20 μm. (H) RT-PCR analysis revealed a significant increase of neuronal mRNA level including NeuN, Robo2, and Syn1 after NeuroD1 treatment. *p < 0.05. n = 4 mice each group. Unpaired t test. Data are represented as mean ± SEM. (I) Quantification of the total number of NeuN+ cells in the motor cortical areas (500–2,500 μm lateral from the midline). Note a significant increase of the total number of neurons in the NeuroD1 group by 60 dpi. n = 3 mice in each group. *p < 0.05, **p < 0.01. Two-way ANOVA followed by Sidak’s multiple comparison tests. Data are represented as mean ± SEM.
Figure 4
Figure 4
Regeneration of Cortical Neurons after NeuroD1-Mediated Astrocyte-to-Neuron Conversion (A) Low magnification images illustrating gradual tissue loss in the GFP control group (top row) and the rescue by NeuroD1 treatment (bottom row). Note layered structures in NeuroD1 group at 60 dpi. Dashed lines delineate the cortical areas. Scale bar, 400 μm. (B) Quantification of the motor cortical areas (from midline to 3 mm lateral) in the control versus NeuroD1 group. *p < 0.05, ***p < 0.001. Two-way ANOVA followed by Sidak’s multiple comparison test. n = 3 mice per group. (C) Serial brain sections from anterior (A) to posterior (P) further illustrating severe tissue injury in the control group. ctx, cortex; c.c., corpus callosum. Red, NeuN. Blue, DAPI. Scale bar, 400 μm. (D and E) Recovery of laminated structure of motor cortex indicated by layer marker Cux1 (D) and Ctip2 (E). Scale bar, 300 μm. (F) Representative images illustrating NeuroD1-converted neurons (NeuroD1-GFP+) expressing cortical marker Tbr1. Scale bar, 40 μm. (G) Quantification of the neuronal markers among NeuroD1-converted neurons in the ischemic injured cortex. Many converted neurons were immunopositive for cortical markers of glutamatergic neurons including Emx1, Tbr1, and Satb2, while only 10% were GABAergic neurons (PV+ and GABA+). n = 3 mice for each group. Data are represented as mean ± SEM.
Figure 5
Figure 5
Local and Global Connections after Astrocyte-to-Neuron Conversion (A and B) Brain slice recording on NeuroD1-converted neurons (GFP) detected repetitive action potential firing (60 dpi, n = 22). (C) Representative traces of spontaneous excitatory (sEPSCs) and inhibitory synaptic events (sIPSCs) recorded in NeuroD1-GFP labeled neurons (60 dpi). (D) Quantification of the frequency of both sEPSCs and sIPSCs in cortical slices without injury (white bar), or with ischemic injury (black bar, GFP control; striped bar, NeuroD1 group). Note that NeuroD1 group showed significantly higher frequency of both sEPSCs and sIPSCs than the control group. Neurons in the control group were the surviving neurons after ischemic injury, not labeled by GFP. Amplitude showed no difference between the control group and NeuroD1 group: EPSC, control, 19.3 ± 2.6 pA; NeuroD1, 16.6 ± 1.3 pA; p > 0.05. IPSC, control, 20.6 ± 1.6 pA; NeuroD1, 21.7 ± 2.0 pA; p > 0.05. n = 22 for control group, and n = 25 for NeuroD1 group. Student’s t test. Electrophysiological properties: Input resistance, non-stroke group 133.8 ± 11.9 MΩ, GFP control group 236.8 ± 27.3 MΩ, NeuroD1 group 180.2 ± 23.3 MΩ; Capacitance, non-stroke group 139.2 ± 10.2 pF, GFP control group 108.0 ± 19.4 pF, NeuroD1 group 128.4 ± 8.5 pF; Resting membrane potential, non-stroke group −70.0 ± 1.9 mV, GFP control group −67.4 ± 1.0 mV, NeuroD1 group −68.1 ± 0.9 mV. n = 21 for non-stroke group, n = 28 for GFP control group, and n = 42 for NeuroD1 group. (E) Representative images illustrating distal axonal projections from NeuroD1-converted neurons. Serial sagittal sections (17 dpi), from medial (M, lower left) to lateral (L, upper right), showing converted neurons in the cortex (inset 1), axonal bundles in the striatum (inset 2), thalamus (inset 3), and hypothalamus (inset 4). Scale bars, 1,000 μm for sagittal images and 40 μm for inset images. (F) CTB retrograding tracing experiment (shown in upper panel, see detail in Supplemental Information) indicate the NeuroD1 converted cells could be labeled by CTB dye. Scale bar, 10 μm.
Figure 6
Figure 6
Transcriptomic Analysis of the Gene-Expression Profile at 17 dpi (A) Sample relationship based on global gene-expression profile revealed a closer relation between NeuroD1-infected tissues and healthy tissues without stroke. Control group (n = 2 mice), NeuroD1 group (n = 2 mice), no stroke group (n = 3 mice). (B) Venn diagram shows the number of differentially expressed genes (DEGs) from pairwise comparisons among control, NeuroD1, and no stroke groups. Note that the number of DEGs between NeuroD1-group and no stroke group is rather small. DEGs are defined as at least 50 base mean value (normalized read counts across all the samples using DESeq2 method) with >3-fold change among samples, and adjusted p value < 0.01. (C) Hierarchical clustering of all the 1,058 DEGs and heatmap of the relative expression level of 1,058 DEGs in all the samples. Red indicates high read count level, whereas blue indicates low read count level. Note the similarity of heatmap pattern between NeuroD1 group and no stroke group. (D) RNA-seq read counts of neuronal genes among different samples. NeuroD1 expression was significantly increased in NeuroD1-infected stroke tissues, as expected. Note a consistent pattern of decreased neuronal gene expression level in stroke tissues infected by control viruses (red bars) but a significant recovery in NeuroD1-infected stroke tissues (blue bars).
Figure 7
Figure 7
Motor Functional Improvement after NeuroD1-Treatment (A) Experimental design for mouse forelimb motor functional tests. Behavioral tests were conducted before ischemic injury to obtain baseline control, and then 9 dps, but 1 day before viral injection to assess injury-induced functional deficits. AAV were injected at 10 dps, and behavioral tests were further performed at 20, 30, 50, and 70 dps to assess functional recovery. (B) Pellet retrieval test. NeuroD1 group (magenta) showed accelerated functional recovery compared to the control group (blue). Ischemic injury at the motor cortex severely impaired the food pellet retrieval capability, dropping from 5–6 pellets/5 min pre-stroke down to 1 pellet/5 min at 9 dps. After NeuroD1 treatment, pellet retrieval ability recovered to 4 pellets/5 min by 60 days post infection. Note that for food pellet retrieval test, only the motor cortex contralateral to the dominant side of forelimb was injured and tested. **p < 0.01, ***p < 0.001. Two-way ANOVA followed by Tukey’s multiple comparison test. Data are represented as mean ± SEM. n = 12 mice for ET-1 plus control AAV group; n = 12 mice for ET-1 plus NeuroD1 AAV group; n = 6 mice for ET-1 plus no virus group; and n = 6 mice for PBS control group. (C) Grid walking test. NeuroD1 group showed lower foot fault rate compared to the control group. Ischemic injury of the motor cortex significantly increased the foot fault rate, which was partially rescued by NeuroD1 treatment. **p < 0.01, ***p < 0.001. Two-way ANOVA followed by Tukey’s multiple comparison test. Data are represented as mean ± SEM. n = 9 mice for ET-1 plus control AAV contralateral (injured) side; n = 9 mice for ET-1 plus NeuroD1 AAV contralateral (injured) side; n = 5 mice for ET-1 plus NeuroD1 ipsilateral (non-injured) side; and n = 4 mice for ET-1 plus control ipsilateral (non-injured) side; n = 6 mice for ET-1 plus no virus contralateral group; and n = 6 mice for PBS contralateral group. (D) Cylinder test. NeuroD1-treated mice showed considerable recovery of rising and touching the sidewall with both forelimbs compared to the control group. **p < 0.01, ****p < 0.0001. Two-way ANOVA followed by Tukey’s multiple comparison test. Data are represented as mean ± SEM. n = 9 mice for ET-1 plus control AAV contralateral (injured) side; n = 11 mice for ET-1 plus NeuroD1 AAV contralateral (injured) side; n = 9 mice for ET-1 plus NeuroD1 ipsilateral (non-injured) side; n = 7 mice for ET-1 plus control ipsilateral (non-injured) side; n = 6 mice for ET-1 plus no virus contralateral group, n = 5 mice for PBS contralateral group.
Figure 8
Figure 8
Recovery of Fear Conditioning Memory after NeuroD1 Treatment (A) Experimental design of fear conditioning test in rats. ET-1 or saline was injected into the BLA, followed by fear conditioning 3 weeks later. Fear memory tests were performed before viral injection and 3 weeks after viral injection to assess the retention of fear memory. Right two panels illustrate the amygdala lesion induced by the infusion of ET-1. Gray areas represent the minimum (dark) and maximum (light) spread of the lesion across different anterior-posterior levels of BLA (−2.12, −2.56, and −2.80 from bregma), condensed in one level for illustration. CeA, central nucleus of the amygdala, op., optical tract. (B) ET-1 lesion reduced freezing during fear conditioning (F(2,31) = 3.98, *p = 0.02, day 21) at both ET-1/Control (blue, *p = 0.021, n = 10) and ET-1/NeuroD1 (magenta, *p = 0.019, n = 14) groups, compared to saline/saline group (black, n = 10). Reduced freezing (F(2,31) = 3.45, *p = 0.044) was also observed on the next day (day 22) in both ET-1/Control (p = 0.030) and ET-1/NeuroD1 (*p = 0.031) groups. Rats were then infused with control virus or NeuroD1 and re-tested 3 weeks later (F(2,31) = 5.86, *p = 0.006, day 45). In the ET-1/NeuroD1 group, freezing returned to the levels of the Saline/Saline group (*p = 0.81), and was significantly higher than ET-1/Control group (*p = 0.004). “x” denotes baseline pre-tone freezing levels. Hab, habituation; Cond, conditioning; pre-CS, pre-conditioned stimulus. One-way ANOVA followed by Duncan’s post hoc test. Data are expressed as mean ± SEM in blocks of two trials. *p < 0.05. (C) After fear conditioning test, immunostaining of rat brain sections confirmed the injection of NeuroD1-GFP viruses into the BLA (green, left panel), and the NeuroD1-infected cells were mostly NeuN-positive neurons (right panels). Scale bar, 1,000 μm.

Comment in

References

    1. Ming G.L., Song H. Adult neurogenesis in the mammalian brain: significant answers and significant questions. Neuron. 2011;70:687–702. - PMC - PubMed
    1. Lim D.A., Alvarez-Buylla A. The Adult Ventricular-Subventricular Zone (V-SVZ) and Olfactory Bulb (OB) Neurogenesis. Cold Spring Harb. Perspect. Biol. 2016;8:a018820. - PMC - PubMed
    1. Gonçalves J.T., Schafer S.T., Gage F.H. Adult Neurogenesis in the Hippocampus: From Stem Cells to Behavior. Cell. 2016;167:897–914. - PubMed
    1. Tobin M.K., Bonds J.A., Minshall R.D., Pelligrino D.A., Testai F.D., Lazarov O. Neurogenesis and inflammation after ischemic stroke: what is known and where we go from here. J. Cereb. Blood Flow Metab. 2014;34:1573–1584. - PMC - PubMed
    1. Magnusson J.P., Göritz C., Tatarishvili J., Dias D.O., Smith E.M., Lindvall O., Kokaia Z., Frisén J. A latent neurogenic program in astrocytes regulated by Notch signaling in the mouse. Science. 2014;346:237–241. - PubMed

Publication types

Substances