

Ensemble forecast and parameter inference of childhood diarrhea in Chobe District, Botswana
- PMID: 31551173
- PMCID: PMC7669214
- DOI: 10.1016/j.epidem.2019.100372
Ensemble forecast and parameter inference of childhood diarrhea in Chobe District, Botswana
Abstract
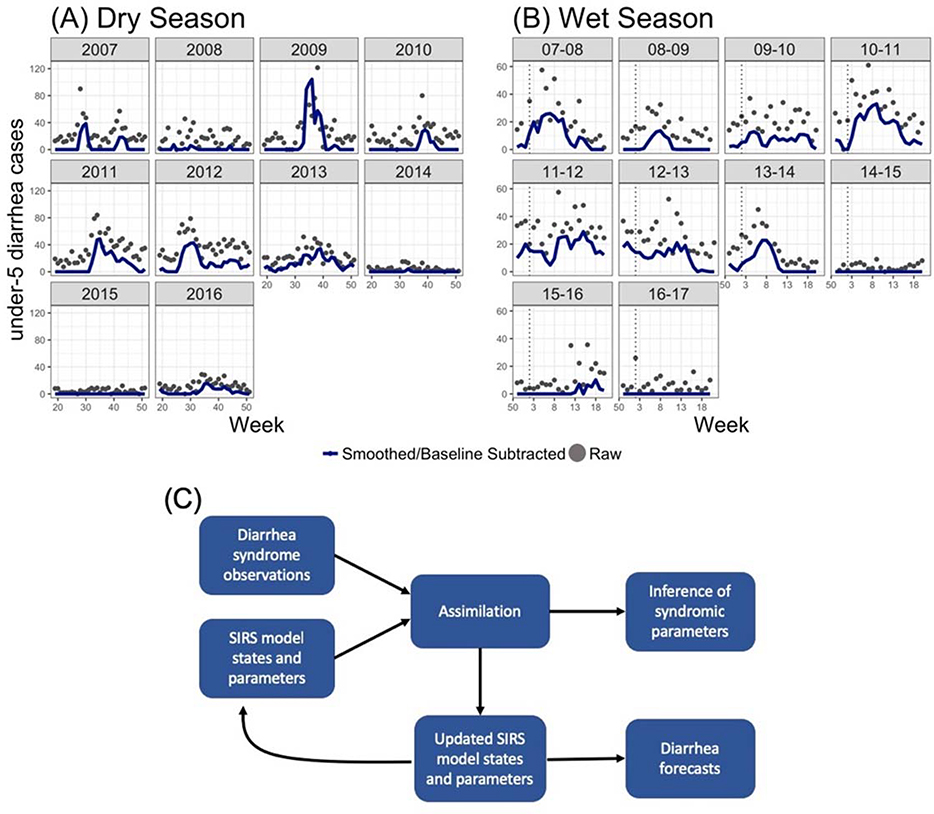
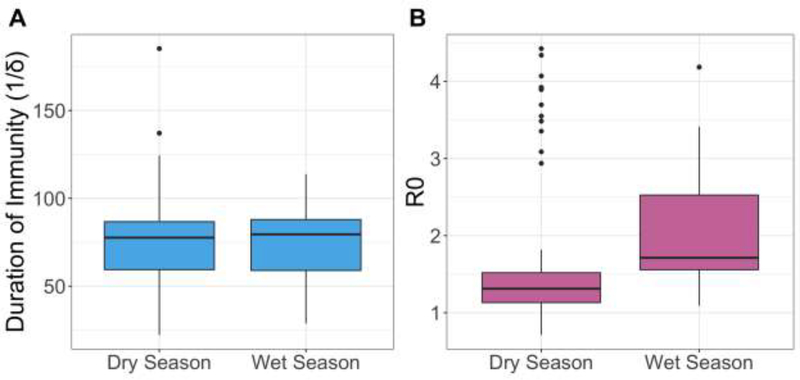
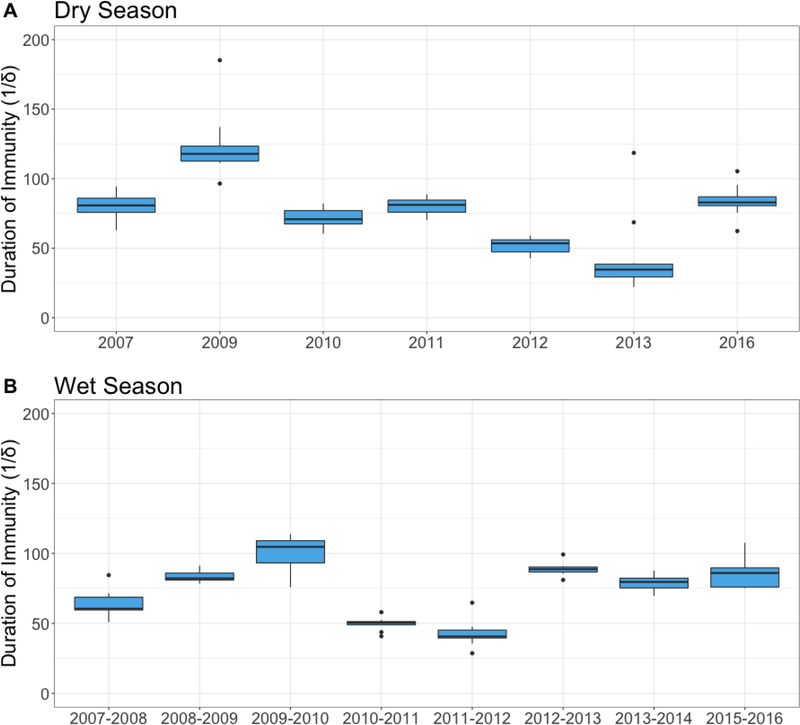
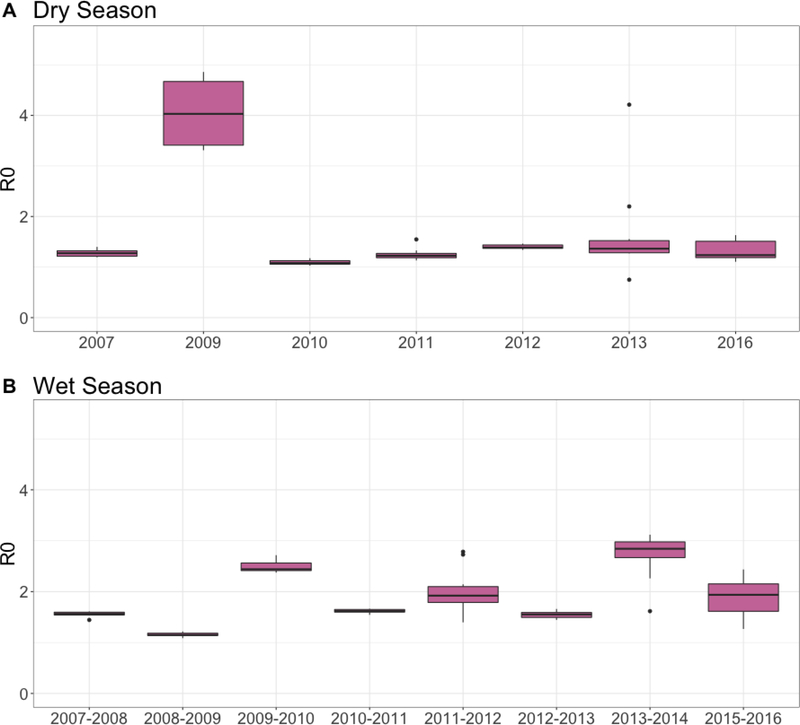
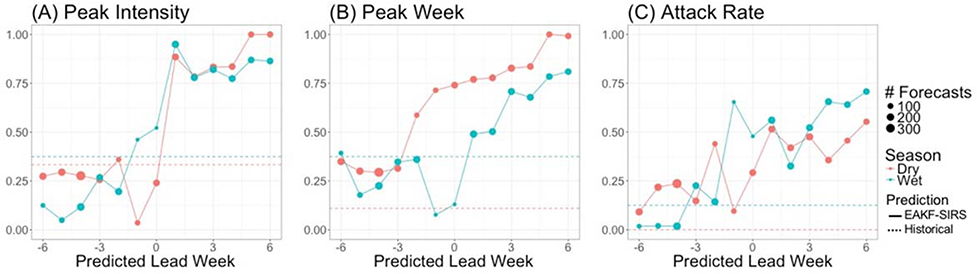
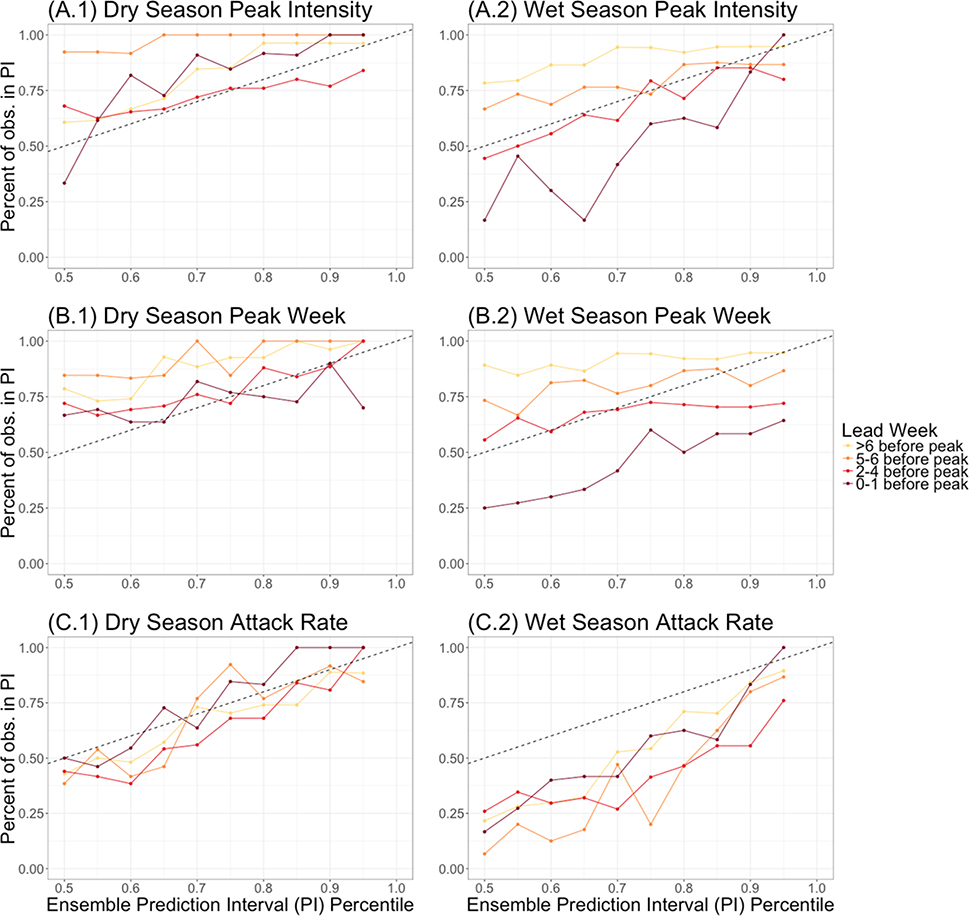
Diarrheal disease is the second largest cause of mortality in children younger than 5, yet our ability to anticipate and prepare for outbreaks remains limited. Here, we develop and test an epidemiological forecast model for childhood diarrheal disease in Chobe District, Botswana. Our prediction system uses a compartmental susceptible-infected-recovered-susceptible (SIRS) model coupled with Bayesian data assimilation to infer relevant epidemiological parameter values and generate retrospective forecasts. Our model inferred two system parameters and accurately simulated weekly observed diarrhea cases from 2007-2017. Accurate retrospective forecasts for diarrhea outbreaks were generated up to six weeks before the predicted peak of the outbreak, and accuracy increased over the progression of the outbreak. Many forecasts generated by our model system were more accurate than predictions made using only historical data trends. Accurate real-time forecasts have the potential to increase local preparedness for coming outbreaks through improved resource allocation and healthcare worker distribution.
Keywords: Bayesian inference; Childhood diarrhea; Dynamic modeling; Forecasting.
Copyright © 2019 The Authors. Published by Elsevier B.V. All rights reserved.
Conflict of interest statement
Declaration of Competing Interest Dr. Jeffrey Shaman declares partial ownership of SK Analytics.
Figures
Similar articles
-
Overcoming barriers in evaluating outbreaks of diarrheal disease in resource poor settings: assessment of recurrent outbreaks in Chobe District, Botswana.BMC Public Health. 2013 Aug 26;13:775. doi: 10.1186/1471-2458-13-775. BMC Public Health. 2013. PMID: 23971427 Free PMC article.
-
Superensemble forecast of respiratory syncytial virus outbreaks at national, regional, and state levels in the United States.Epidemics. 2019 Mar;26:1-8. doi: 10.1016/j.epidem.2018.07.001. Epub 2018 Jul 9. Epidemics. 2019. PMID: 30025885 Free PMC article.
-
El Niño-Southern oscillation and under-5 diarrhea in Botswana.Nat Commun. 2019 Dec 20;10(1):5798. doi: 10.1038/s41467-019-13584-6. Nat Commun. 2019. PMID: 31862873 Free PMC article.
-
Hydrometeorology and flood pulse dynamics drive diarrheal disease outbreaks and increase vulnerability to climate change in surface-water-dependent populations: A retrospective analysis.PLoS Med. 2018 Nov 8;15(11):e1002688. doi: 10.1371/journal.pmed.1002688. eCollection 2018 Nov. PLoS Med. 2018. PMID: 30408029 Free PMC article.
-
Forecasting the 2014 West African Ebola Outbreak.Epidemiol Rev. 2019 Jan 31;41(1):34-50. doi: 10.1093/epirev/mxz013. Epidemiol Rev. 2019. PMID: 31781750
Cited by
-
Predictive modeling for infectious diarrheal disease in pediatric populations: A systematic review.Learn Health Syst. 2023 Jul 29;8(1):e10382. doi: 10.1002/lrh2.10382. eCollection 2024 Jan. Learn Health Syst. 2023. PMID: 38249852 Free PMC article.
-
Differential Effects of Intervention Timing on COVID-19 Spread in the United States.medRxiv [Preprint]. 2020 May 20:2020.05.15.20103655. doi: 10.1101/2020.05.15.20103655. medRxiv. 2020. Update in: Sci Adv. 2020 Dec 4;6(49):eabd6370. doi: 10.1126/sciadv.abd6370. PMID: 32511526 Free PMC article. Updated. Preprint.
-
Analytical reference framework to analyze non-COVID-19 events.Popul Health Metr. 2023 Oct 21;21(1):16. doi: 10.1186/s12963-023-00316-8. Popul Health Metr. 2023. PMID: 37865751 Free PMC article.
-
Differential effects of intervention timing on COVID-19 spread in the United States.Sci Adv. 2020 Dec 4;6(49):eabd6370. doi: 10.1126/sciadv.abd6370. Print 2020 Dec. Sci Adv. 2020. PMID: 33158911 Free PMC article.
-
Decision fusion in healthcare and medicine: a narrative review.Mhealth. 2022 Jan 20;8:8. doi: 10.21037/mhealth-21-15. eCollection 2022. Mhealth. 2022. PMID: 35178439 Free PMC article. Review.
References
-
- Alexander KA, Herbein J, Zajac A, 2012. The Occurrence of Cryptosporidium and Giardia Infections Among Patients Reporting Diarrheal Disease in Chobe District, Botswana. Adv. Infect. Dis. 02, 143–147. doi:10.4236/aid.2012.24023 - DOI
-
- Basu G, Rossouw J, Sebunya TK, A GB, De Beer M, Dewar JB, Steel AD, 2003. Prevalence of rotavirus, adenovirus and astrovirus infection in young children with gastroenteritis in Gaborone, Botswana. East Afr. Med. J. 80, 652–655. - PubMed
Publication types
MeSH terms
Grants and funding
LinkOut - more resources
Full Text Sources
Medical
