. 2019 Dec;181(4):1704-1720.
doi: 10.1104/pp.19.00635. Epub 2019 Sep 24.

PECTIN ACETYLESTERASE9 Affects the Transcriptome and Metabolome and Delays Aphid Feeding

Affiliations

PECTIN ACETYLESTERASE9 Affects the Transcriptome and Metabolome and Delays Aphid Feeding

Karen J Kloth et al. Plant Physiol. 2019 Dec.

Abstract

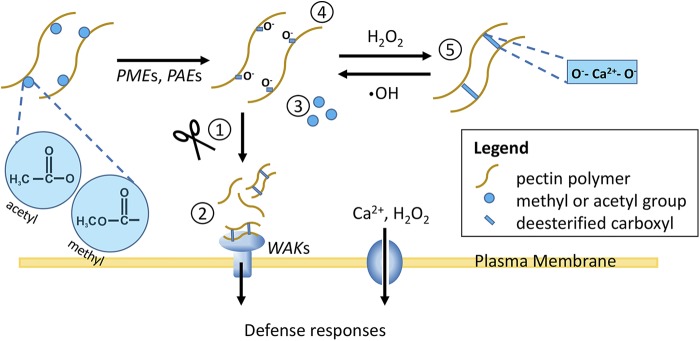
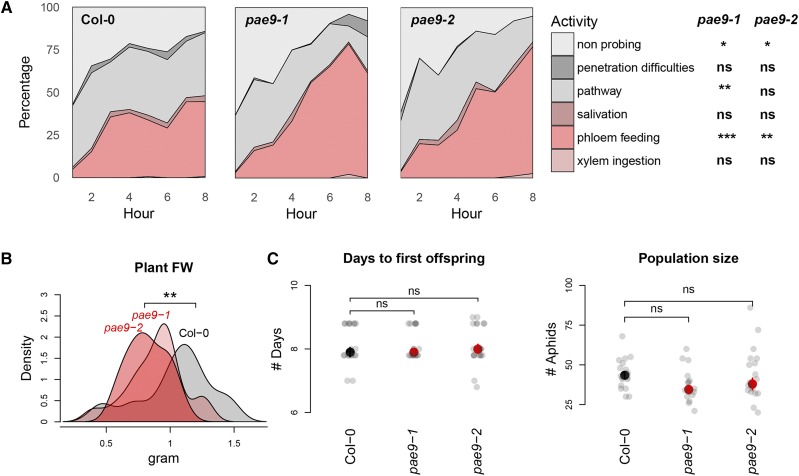
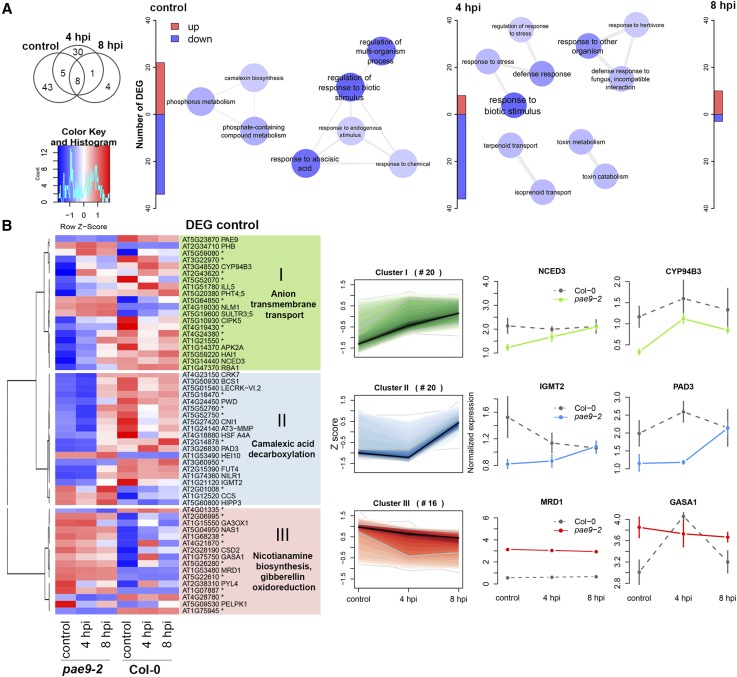
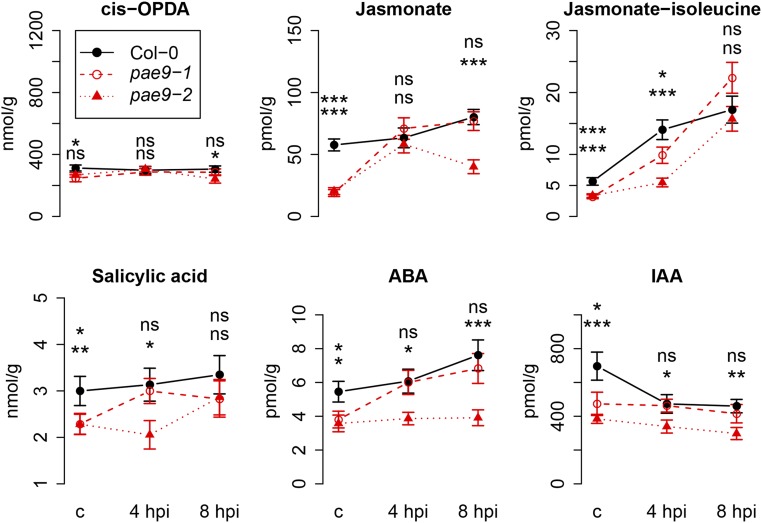
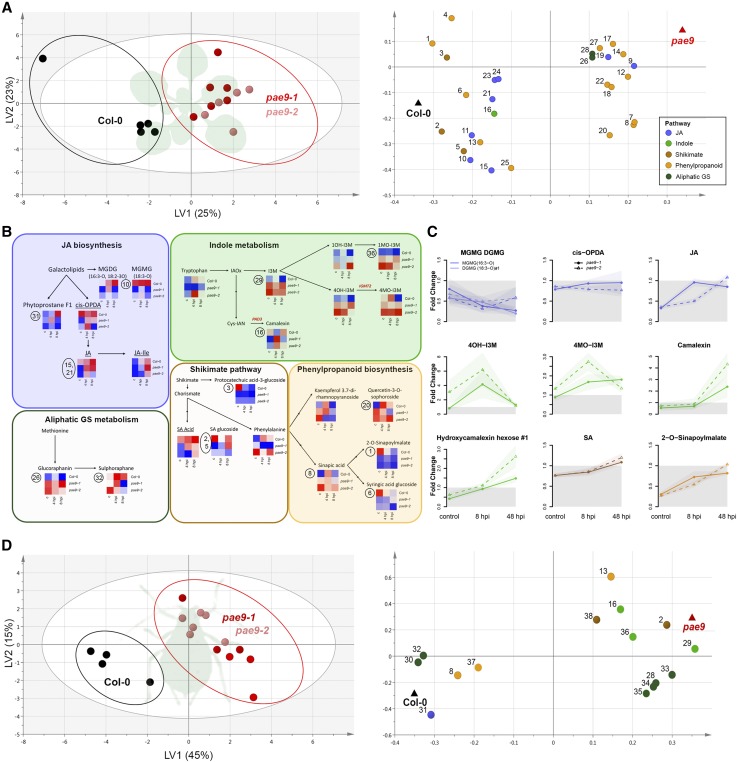
The plant cell wall plays an important role in damage-associated molecular pattern-induced resistance to pathogens and herbivorous insects. Our current understanding of cell wall-mediated resistance is largely based on the degree of pectin methylesterification. However, little is known about the role of pectin acetylesterification in plant immunity. This study describes how one pectin-modifying enzyme, PECTIN ACETYLESTERASE 9 (PAE9), affects the Arabidopsis (Arabidopsis thaliana) transcriptome, secondary metabolome, and aphid performance. Electro-penetration graphs showed that Myzus persicae aphids established phloem feeding earlier on pae9 mutants. Whole-genome transcriptome analysis revealed a set of 56 differentially expressed genes (DEGs) between uninfested pae9-2 mutants and wild-type plants. The majority of the DEGs were enriched for biotic stress responses and down-regulated in the pae9-2 mutant, including PAD3 and IGMT2, involved in camalexin and indole glucosinolate biosynthesis, respectively. Relative quantification of more than 100 secondary metabolites revealed decreased levels of several compounds, including camalexin and oxylipins, in two independent pae9 mutants. In addition, absolute quantification of phytohormones showed that jasmonic acid (JA), jasmonoyl-Ile, salicylic acid, abscisic acid, and indole-3-acetic acid were compromised due to PAE9 loss of function. After aphid infestation, however, pae9 mutants increased their levels of camalexin, glucosinolates, and JA, and no long-term effects were observed on aphid fitness. Overall, these data show that PAE9 is required for constitutive up-regulation of defense-related compounds, but that it is not required for aphid-induced defenses. The signatures of phenolic antioxidants, phytoprostanes, and oxidative stress-related transcripts indicate that the processes underlying PAE9 activity involve oxidation-reduction reactions.


Figures

Figure 1.
Figure 1.
Hypothetical effects of PMEs and PAEs on plant resistance: (1) Increased accessibility for pectin degrading enzymes, (2) production of more, smaller, and cross-linked OGs (DAMPs) that bind to WAKs and induce defense responses, (3) the release of free methanol or acetate that can be reincorporated in primary and secondary metabolism, (4) more negatively charged carboxyl groups that decrease the pH of the apoplast, and (5) more ROS-mediated pectin cross-linking with potential effects on ROS and calcium influxes into the cell.
Figure 2.
Figure 2.
Cryofixed M. persicae aphid stylets in an Arabidopsis leaf. The stylet position illustrates the intimate contact between an aphid and the plant cell wall. Aphids usually do not disrupt cells, but maneuver their stylets through the apoplast and sample several cells along their way to the phloem. Cell wall penetration can take between 10 min and several hours and is accompanied by the secretion of gelling saliva. After arrival at a sieve tube, aphids start phloem feeding and usually keep their stylets anchored for hours or even days. This aphid reached the phloem in 15 min, after penetrating along a track of at least 26 μm of cell wall (not accounting for movements in the direction of the z plane) and showing 25 brief plasma membrane punctures along its path. The arrow indicates an abandoned tract with remnants of gelling saliva (toluidine blue staining, images of different depth of focus are separated with gray lines).
Figure 3.
Figure 3.
Effects of pae9-2 mutants on M. persicae aphids. A, Aphid feeding behavior during 8-h EPG recordings, expressed as the mean percentage of time per hour (‘pathway’= cell wall penetration phase, significance of plant line × time interactions in linear mixed model: *P < 0.05, **P < 0.01, ***P < 0.001, n = 14, for Col-0 the mean of two experiments is depicted; ns, not significant). B, Plant fresh weight (FW; density diagram, P = 0.0091, n = 20, one-way ANOVA). C, Aphid development time from neonate to adult and aphid population sizes after 2 weeks of infestation with one neonate (P = 0.07, P = 0.68, n = 20, mixed linear model with plant fresh weight as random effect). Gray dots represent individual data points, red or black dots represent the mean value, and the error bar the 95% confidence interval.
Figure 4.
Figure 4.
Transcriptome of the pae9-2 mutant. A, The number of differentially expressed genes (DEGs) in the pae9-2 mutant relative to Col-0, and GO enrichment of down-regulated genes. B, DEGs in the control treatment with hierarchical clustering on perturbations (Ward’s minimum variance method on z-scores). Clusters are illustrated with GO enrichment, perturbation signature, and two exemplary genes (values represent mean normalized expression and bars depict ses). Genes without names are annotated with an asterisk in the heatmap.
Figure 5.
Figure 5.
PAE9 effects on phytohormone content. Absolute quantification of phytohormones in uninfested plants and 4 and 8 h after M. persicae aphid infestation (*P < 0.05, **P < 0.01, ***P < 0.001, n = 6, linear mixed model with batch as random effect, values represent mean concentration, bars depict ses; ns, not significant).
Figure 6.
Figure 6.
Secondary metabolite profile of the pae9 mutant and wild-type rosettes and M. persicae aphids. A, Secondary metabolites in uninfested plants (PLS-DA based on the relative quantification of 28 secondary metabolites with VIP score > 1; Table 2; Supplemental Table S5). B, Metabolite pathways and metabolite perturbations in control, 4-hpi, and 8-hpi treatments (heatmaps: blue = low, red = high, encircled numbers refer to compounds in (A) and (D), absolute quantified phytohormone conjugates are underlined, pathways are simplified). C, Effects of 8-h and 48-h aphid infestation on pae9-1 and pae9-2 metabolite abundance compared with Col-0 (colored according to metabolite pathways, gray area is down-regulated, points represent mean fold change, lighter shades se). D, Accumulation of plant secondary metabolites in aphids that had been feeding from either pae9 mutants or Col-0 plants for 10 d (PLS-DA based on relative quantification of 15 secondary metabolites with VIP score > 1; Table 2; Supplemental Table S9). LV1, latent variable 1, LV2, latent variable 2.

References

    1. Abdel-Ghany SE, Burkhead JL, Gogolin KA, Andrés-Colás N, Bodecker JR, Puig S, Peñarrubia L, Pilon M (2005) AtCCS is a functional homolog of the yeast copper chaperone Ccs1/Lys7. FEBS Lett 579: 2307–2312 - PubMed
    1. Adolfsson L, Nziengui H, Abreu IN, Šimura J, Beebo A, Herdean A, Aboalizadeh J, Široká J, Moritz T, Novák O, et al. (2017) Enhanced secondary- and hormone metabolism in leaves of arbuscular mycorrhizal Medicago truncatula. Plant Physiol 175: 392–411 - PMC - PubMed
    1. Akhter S, Uddin MN, Jeong IS, Kim DW, Liu XM, Bahk JD (2016) Role of Arabidopsis AtPI4Kγ3, a type II phosphoinositide 4-kinase, in abiotic stress responses and floral transition. Plant Biotechnol J 14: 215–230 - PMC - PubMed
    1. Albersheim P, Jones TM, English PD (1969) Biochemistry of the cell wall in relation to infective processes. Annu Rev Phytopathol 7: 171–194 - PubMed
    1. Aldington S, McDougall GJ, Fry SC (1991) Structure‐activity relationships of biologically active oligosaccharides. Plant Cell Environ 14: 625–636

Publication types

MeSH terms

LinkOut - more resources