. 2019 Sep 24;4(5):e00375-19.
doi: 10.1128/mSystems.00375-19.

Molecular and Microbial Microenvironments in Chronically Diseased Lungs Associated with Cystic Fibrosis

Affiliations

Molecular and Microbial Microenvironments in Chronically Diseased Lungs Associated with Cystic Fibrosis

Alexey V Melnik et al. mSystems. .

Abstract

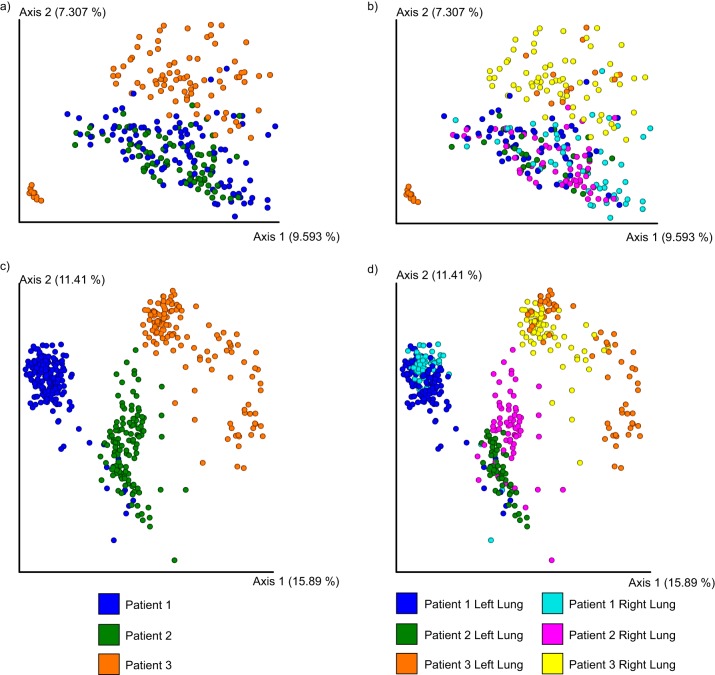
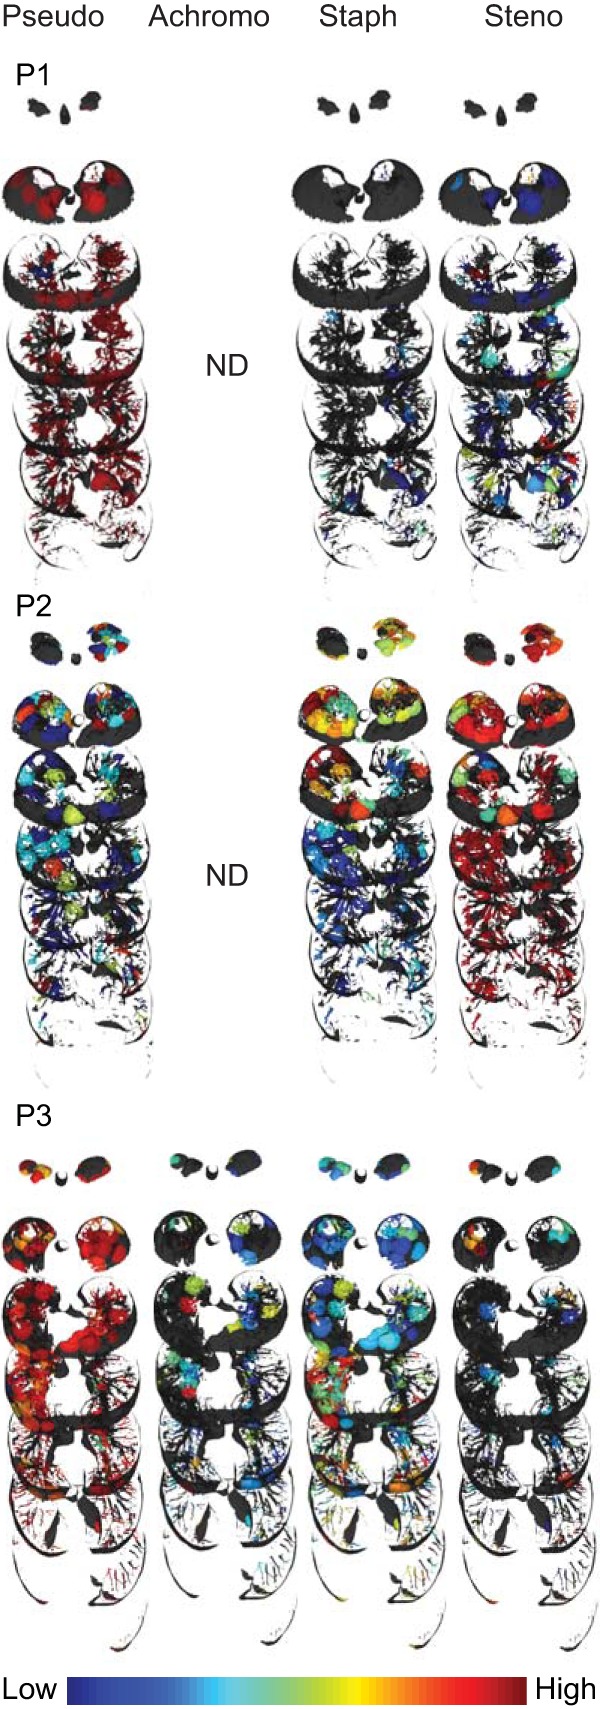
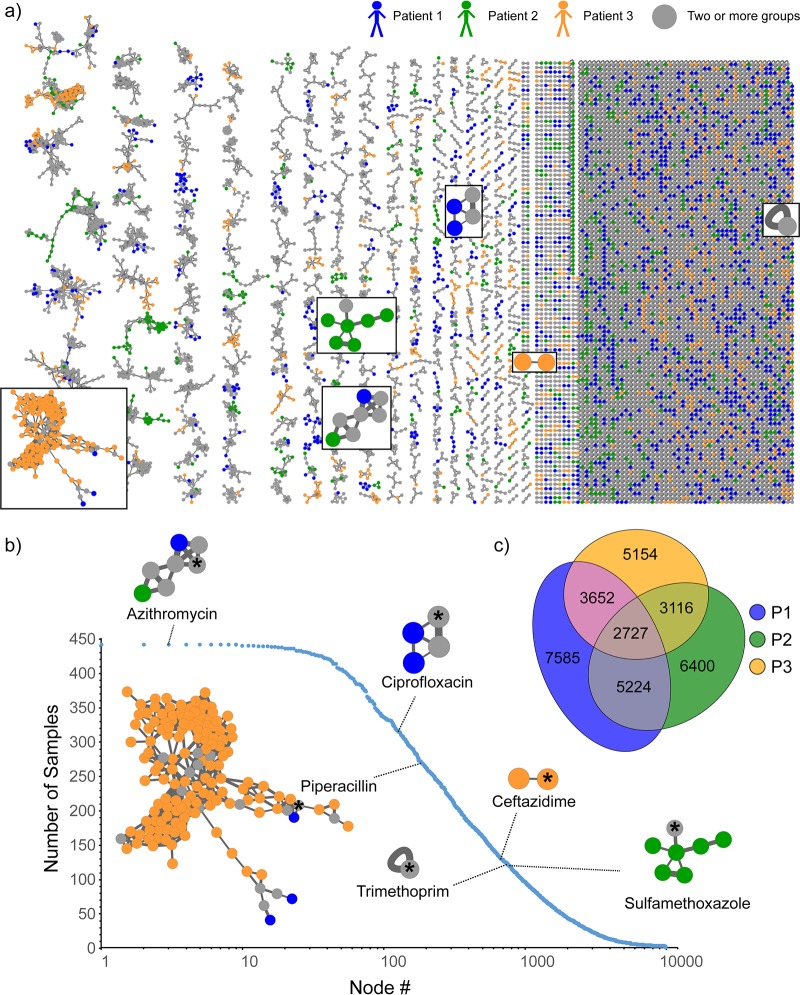
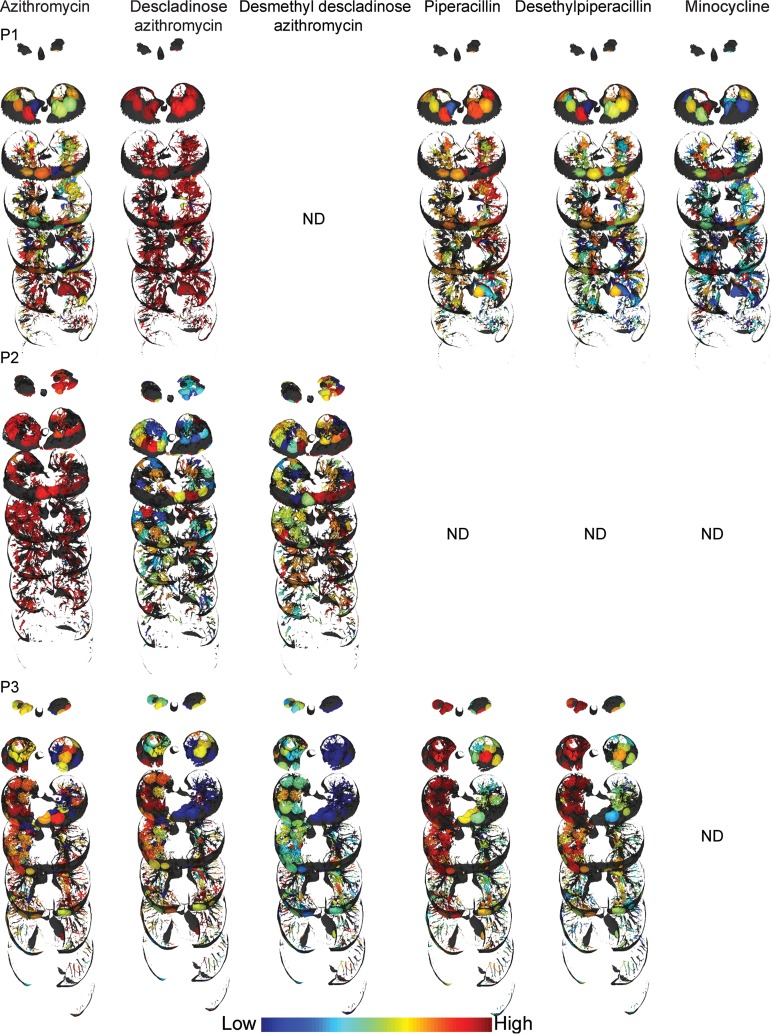
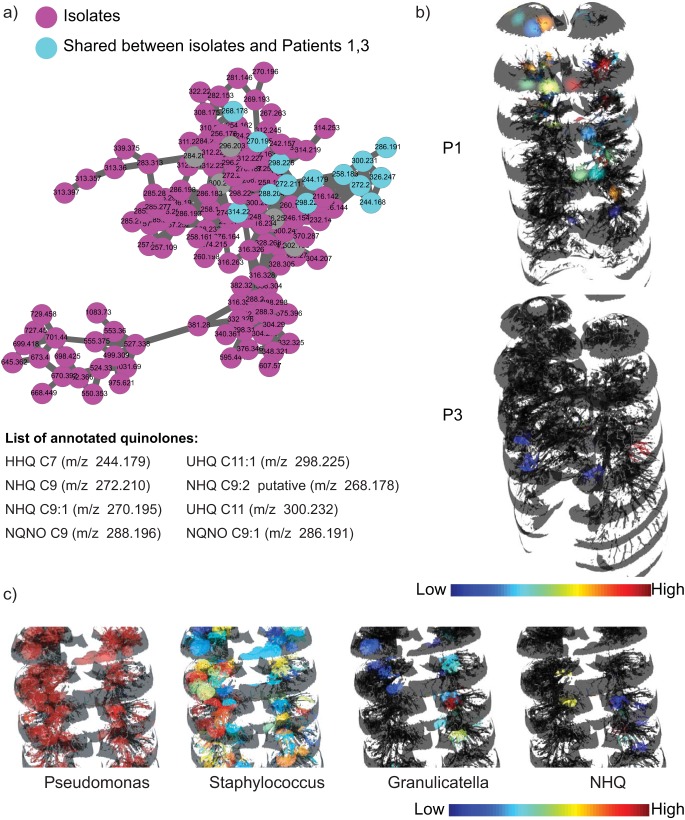
To visualize the personalized distributions of pathogens and chemical environments, including microbial metabolites, pharmaceuticals, and their metabolic products, within and between human lungs afflicted with cystic fibrosis (CF), we generated three-dimensional (3D) microbiome and metabolome maps of six explanted lungs from three cystic fibrosis patients. These 3D spatial maps revealed that the chemical environments differ between patients and within the lungs of each patient. Although the microbial ecosystems of the patients were defined by the dominant pathogen, their chemical diversity was not. Additionally, the chemical diversity between locales in the lungs of the same individual sometimes exceeded interindividual variation. Thus, the chemistry and microbiome of the explanted lungs appear to be not only personalized but also regiospecific. Previously undescribed analogs of microbial quinolones and antibiotic metabolites were also detected. Furthermore, mapping the chemical and microbial distributions allowed visualization of microbial community interactions, such as increased production of quorum sensing quinolones in locations where Pseudomonas was in contact with Staphylococcus and Granulicatella, consistent with in vitro observations of bacteria isolated from these patients. Visualization of microbe-metabolite associations within a host organ in early-stage CF disease in animal models will help elucidate the complex interplay between the presence of a given microbial structure, antibiotics, metabolism of antibiotics, microbial virulence factors, and host responses.IMPORTANCE Microbial infections are now recognized to be polymicrobial and personalized in nature. Comprehensive analysis and understanding of the factors underlying the polymicrobial and personalized nature of infections remain limited, especially in the context of the host. By visualizing microbiomes and metabolomes of diseased human lungs, we reveal how different the chemical environments are between hosts that are dominated by the same pathogen and how community interactions shape the chemical environment or vice versa. We highlight that three-dimensional organ mapping methods represent hypothesis-building tools that allow us to design mechanistic studies aimed at addressing microbial responses to other microbes, the host, and pharmaceutical drugs.

Keywords: GNPS; Pseudomonas; Stenotrophomonas; antibiotic distribution; cystic fibrosis; metabolomics; microbiome; spatial mapping.


Figures

FIG 1
FIG 1
Principal-coordinate plot of metabolome and microbiome from lungs of three patients in the study. (a and b) PCoA plots of 16S rRNA sequencing with the unweighted UniFrac distance. (c and d) PCoA plots of the mass spectrometry data with Jaccard distance data.
FIG 2
FIG 2
Distribution of microorganisms. Distributions of Pseudomonas, Achromobacter, Staphylococcus, and Stenotrophomonas (left to right) are shown for all three patients. Pseudo, Pseudomonas; Achromo, Achromobacter; Staph, Staphylococcus; Steno, Stenotrophomonas, P1, patient 1; P2, patient 2; P3, patient 3, ND, not detected. An intensity scale is provided at the bottom right. Full visualizations of microbial maps can be accessed via the following hyperlinks: patient 1, patient 2, and patient 3.
FIG 3
FIG 3
Molecular network analysis of all six lungs from three patients afflicted with CF. (a) The molecular network is color coded by patient as follows: blue, patient 1; green, patient 2; orange, patient 3. The network clusters corresponding to antibiotics are highlighted in boxes. (b) The numbers of samples that contained a given set of consensus MS/MS spectra (represented as nodes in panel a) are plotted. The frequency of occurrence of antibiotics detected in this data set is highlighted on the plot. The number of nodes in a cluster is reflective of the number of transformations of the parent compound that were detected. The node of each parent compound is highlighted an asterisk. The fragmentation patterns of the most frequently observed drugs, azithromycin and its analogs, are shown in Fig. S4; the large number of nodes shown in the piperacillin cluster stems from its structural similarity to small peptidic compounds abundant in biological samples and its inherent chemical reactivity with biological molecules (48). (c) Venn diagram of the overlap of consensus fragmentation spectra between three patients.
FIG 4
FIG 4
Distribution of selected antibiotics and the metabolites. P1, patient 1; P2, patient 2; P3, patient 3; ND, not detected. An intensity scale is provided at the bottom (distributions of additional antibiotics and their metabolites are shown in Fig. S5). The relative distributions should be compared within a patient lung. Full visualizations of metabolite maps can be accessed via the following hyperlinks: patient 1, patient 2, and patient 3.
FIG 5
FIG 5
Molecules produced by P. aeruginosa in patients 1 and 3. (a) The molecular network cluster of quinolones detected in the lung tissue of patients 1 and 3 and in vitro microbial cultures of Pseudomonas isolated from sputum and the swabs collected from lung sections is shown. (b) The distributions of the quinolone HHQ are shown for patients 1 and 3. All the other quinolones showed similar distributions in those patients (Fig. S8). (c) Inset views of the distribution of Pseudomonas, Staphylococcus, Granulicatella, and the Pseudomonas quinolone NHQ in patient 3 suggestive of upregulation in quinolone production by Pseudomonas in the regions where interactions of Pseudomonas with Staphylococcus and Granulicatella and possibly other microbes take place. In agreement with this observation, the levels of production of HHQ and NHQ were also found to increase in cocultures of Pseudomonas and Staphylococcus compared to Pseudomonas grown alone under identical conditions (Fig. S9).

References

    1. Laxminarayan R, Duse A, Wattal C, Zaidi AK, Wertheim HF, Sumpradit N, Vlieghe E, Hara GL, Gould IM, Goossens H, Greko C, So AD, Bigdeli M, Tomson G, Woodhouse W, Ombaka E, Peralta AQ, Qamar FN, Mir F, Kariuki S, Bhutta ZA, Coates A, Bergstrom R, Wright GD, Brown ED, Cars O. 2013. Antibiotic resistance-the need for global solutions. Lancet Infect Dis 13:1057–1098. doi:10.1016/S1473-3099(13)70318-9. - DOI - PubMed
    1. Shallcross LJ, Davies DS. 2014. Antibiotic overuse: a key driver of antimicrobial resistance. Br J Gen Pract 64:604–605. doi:10.3399/bjgp14X682561. - DOI - PMC - PubMed
    1. Ventola CL. 2015. The antibiotic resistance crisis: part 1: causes and threats. P T 40:277–283. - PMC - PubMed
    1. Mollenkopf DF, Stull JW, Mathys DA, Bowman AS, Feicht SM, Grooters SV, Daniels JB, Wittum TE. 2017. Carbapenemase-producing Enterobacteriaceae recovered from the environment of a swine farrow-to-finish operation in the United States. Antimicrob Agents Chemother 61:e01298-16. doi:10.1128/AAC.01298-16. - DOI - PMC - PubMed
    1. de Kraker ME, Stewardson AJ, Harbarth S. 2016. Will 10 million people die a year due to antimicrobial resistance by 2050? PLoS Med 13:e1002184. doi:10.1371/journal.pmed.1002184. - DOI - PMC - PubMed