. 2019 Sep 24;10(1):4333.
doi: 10.1038/s41467-019-12275-6.

Linkage between endosomal escape of LNP-mRNA and loading into EVs for transport to other cells

Affiliations

Linkage between endosomal escape of LNP-mRNA and loading into EVs for transport to other cells

Marco Maugeri et al. Nat Commun. .

Abstract

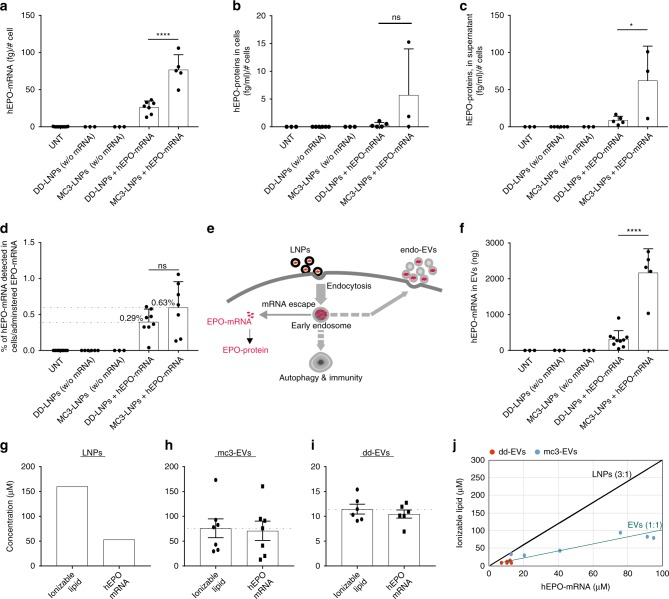
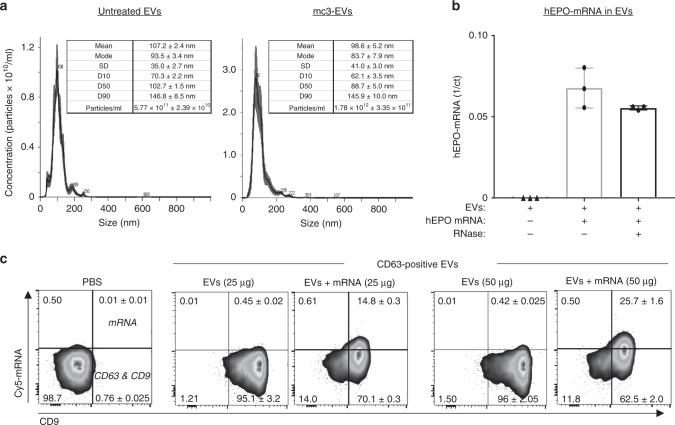
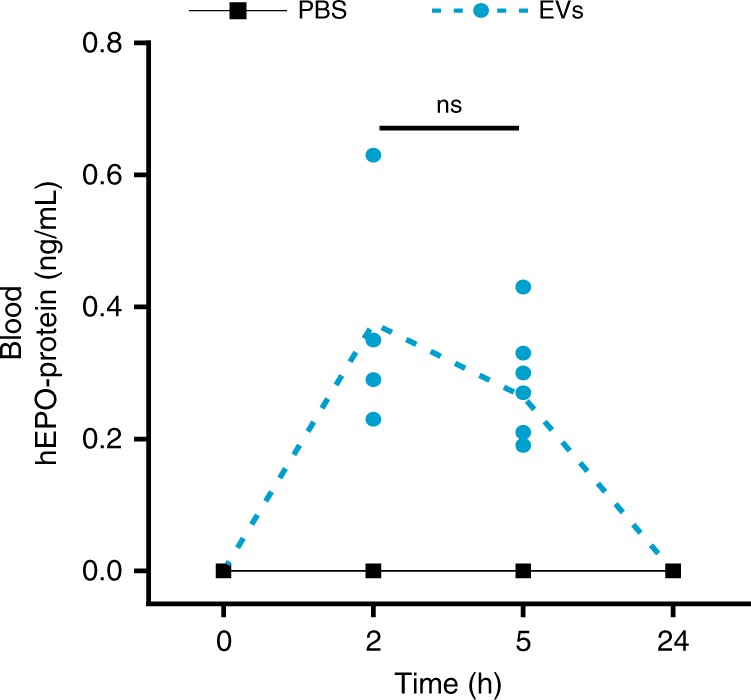
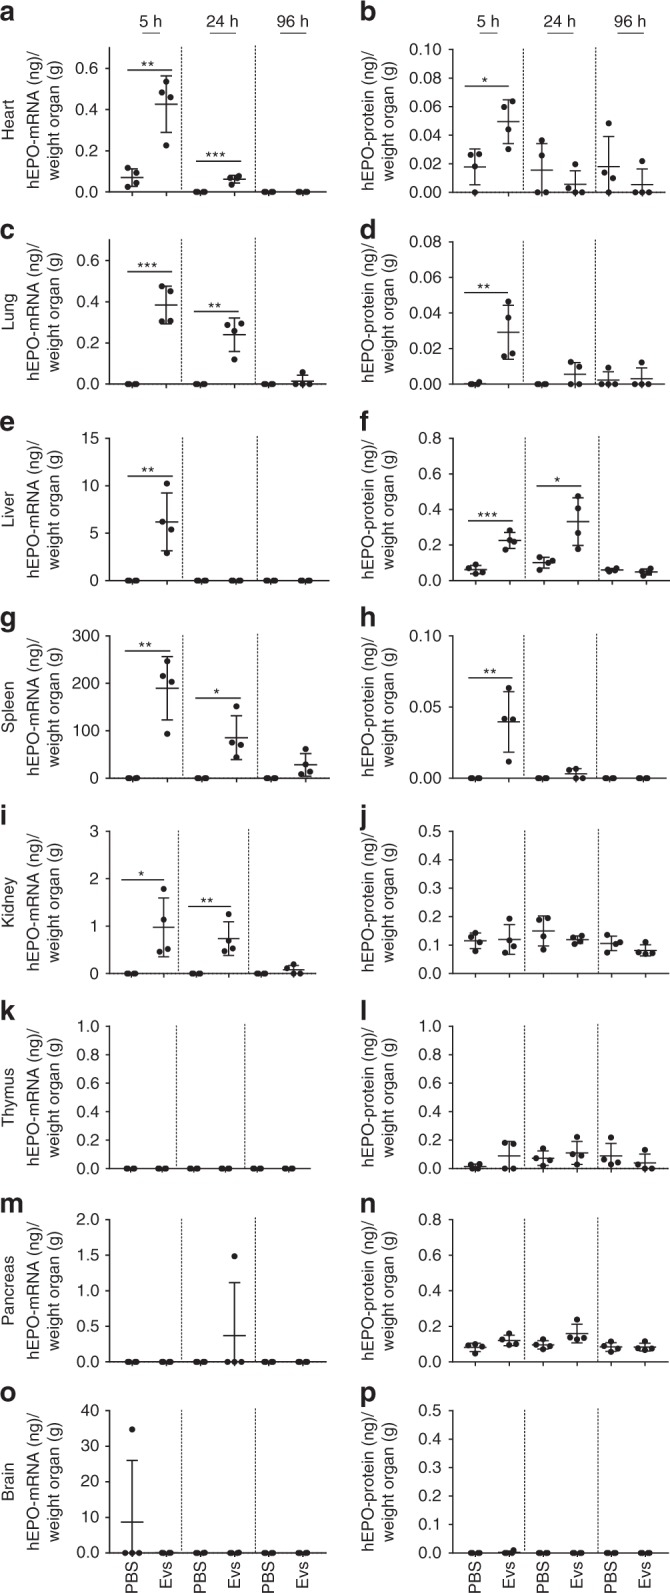
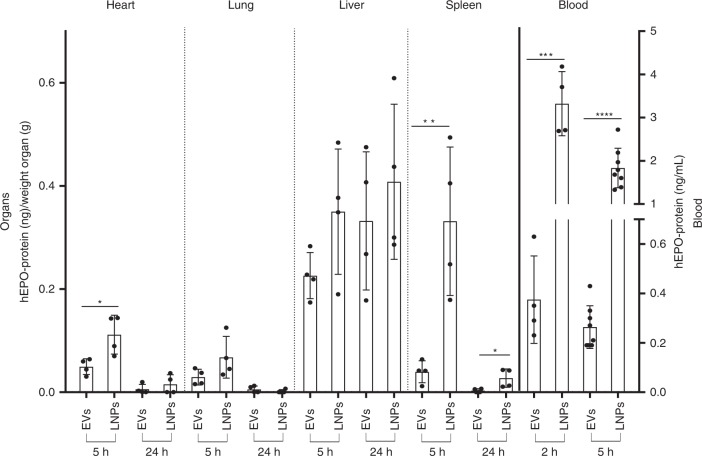
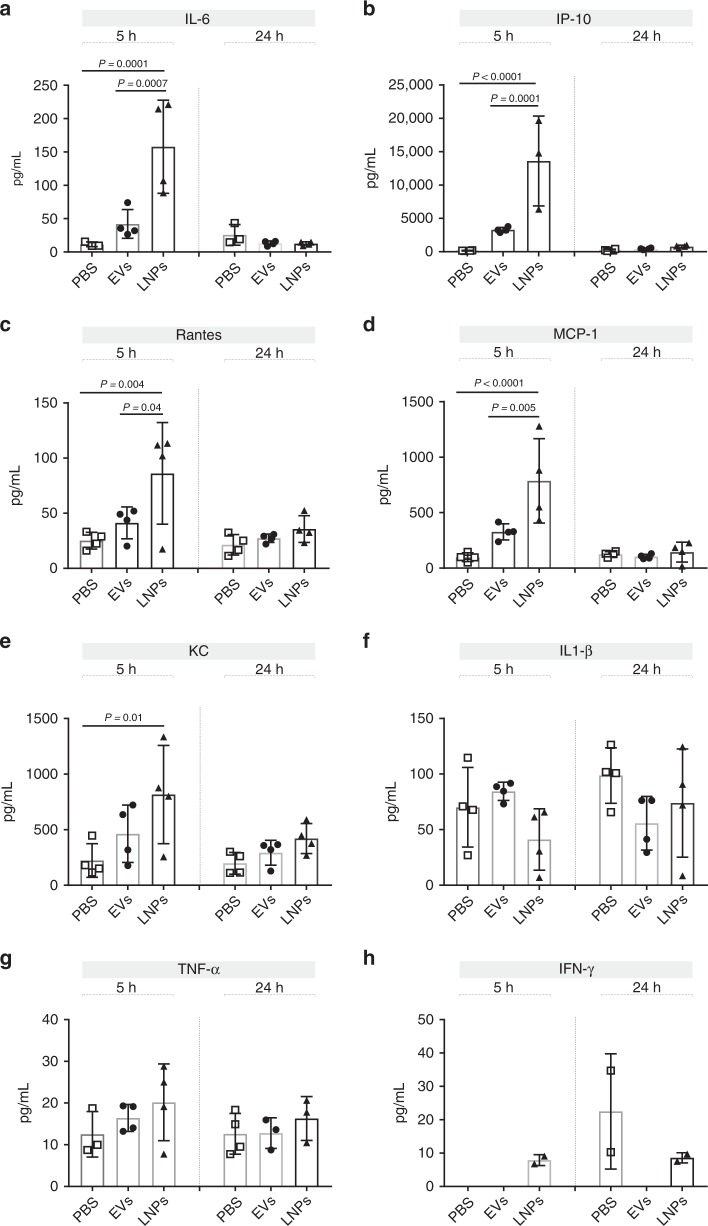
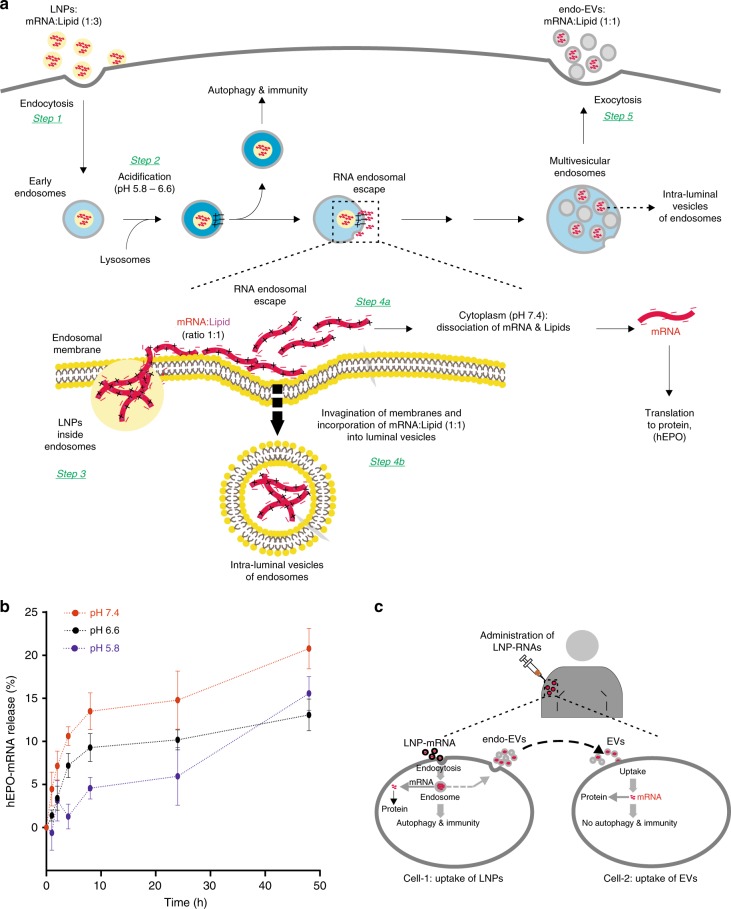
RNA-based therapeutics hold great promise for treating diseases and lipid nanoparticles (LNPs) represent the most advanced platform for RNA delivery. However, the fate of the LNP-mRNA after endosome-engulfing and escape from the autophagy-lysosomal pathway remains unclear. To investigate this, mRNA (encoding human erythropoietin) was delivered to cells using LNPs, which shows, for the first time, a link between LNP-mRNA endocytosis and its packaging into extracellular vesicles (endo-EVs: secreted after the endocytosis of LNP-mRNA). Endosomal escape of LNP-mRNA is dependent on the molar ratio between ionizable lipids and mRNA nucleotides. Our results show that fractions of ionizable lipids and mRNA (1:1 molar ratio of hEPO mRNA nucleotides:ionizable lipids) of endocytosed LNPs were detected in endo-EVs. Importantly, these EVs can protect the exogenous mRNA during in vivo delivery to produce human protein in mice, detected in plasma and organs. Compared to LNPs, endo-EVs cause lower expression of inflammatory cytokines.


Conflict of interest statement

The authors declare no competing interests

Figures

Fig. 1
Fig. 1
Delivery of hEPO mRNA to cells via LNPs and analysis of endo-EVs. MC3-LNPs and DD-LNPs containing 100 μg of hEPO-mRNA were transferred to human epithelial (HTB-177) cells. Untreated cells and cells treated with empty LNPs (without hEPO mRNA) were used as controls. a Amount of hEPO mRNA detected in cells. Untreated (n = 9), DD-LNPs (w/o mRNA) (n = 3), MC3-LNPs (w/o mRNA) (n = 3), DD-LNPs + mRNA (n = 7), and MC3-LNPs + mRNA (n = 5). b Amount of hEPO protein detected in cells. Untreated (n = 3), DD-LNPs (w/o mRNA) (n = 6), MC3-LNPs (w/o mRNA) (n = 3), DD-LNPs + mRNA (n = 5), and MC3-LNPs + mRNA (n = 3). c Amount of hEPO protein detected in the supernatant of cultured cells. Untreated (n = 3), DD-LNPs (w/o mRNA) (n = 6), MC3-LNPs (w/o mRNA) (n = 3), DD-LNPs + mRNA (n = 5), and MC3-LNPs + mRNA (n = 3). d Percentage of hEPO mRNA detected in the cytosol of cells relative to the total amount of mRNA administered (100 µg) to cells via LNPs. Untreated (n = 10), DD-LNPs (w/o mRNA) (n = 6), MC3-LNPs (w/o mRNA) (n = 3), DD-LNPs + mRNA (n = 8), and MC3-LNPs + mRNA (n = 7). e Hypothetical presentation of the endosomal escape of hEPO mRNA of LNPs into the cytoplasm and translation into protein, versus loading of hEPO mRNA into endo-EVs. f Total amount of hEPO mRNA quantified in endo-EVs isolated from LNP-treated cells. Untreated (n = 3), DD-LNPs (w/o mRNA) (n = 3), MC3-LNPs (w/o mRNA) (n = 3), DD-LNPs + mRNA (n = 10), and MC3-LNPs + mRNA (n = 5). g Molar concentrations of ionizable lipids and hEPO-mRNA (ionizable lipids per hEPO mRNA nucleotides) in originally formulated LNPs (control, n = 1), which contains 3 moles of ionizable lipids per 1 mole of mRNA nucleotides. h Molar concentration of ionizable lipids and hEPO-mRNA of mc3-EVs (n = 7). i Molar concentration of ionizable lipids and hEPO-mRNA of dd-EVs (n = 6). j Stoichiometric comparison between LNPs and endo-EVs regarding molar ratio (mole/mole) of ionizable lipids per hEPO-mRNA nucleotides. Red circles (dd-EV) and blue circles (mc3-EV). Ionizable lipids and hEPO-mRNA of mc3-EVs (n = 7) each. Ionizable lipids and hEPO-mRNA of dd-EVs (n = 6) each. Data are presented as scatter dot plots including the mean (bars) and standard deviation (SD) of the number (n) of biologically independent samples specified for each panel. MC3-LNP and DD-LNP groups (ad, f) were compared using the unpaired two-tailed Student’s t-test. **p < 0.01, ****p < 0.0001 and ns = not significant. Source data are provided as a Source Data file
Fig. 2
Fig. 2
Characterization of endo-EVs derived from LNP-treated cells. a Nanoparticle tracking analysis for size distribution and concentration of EVs from untreated cells (Left side panel) and from MC3-LNP-treated cells (Right side panel). For each graph (one representative replicate), a table is provided, including mean and mode sizes, SD, and D-values (D10, D50, D90) and particle concentration. b EV-mRNA protection assay against RNase A. The hEPO-mRNA qPCR data is represented as scatter dot plot and mean SD of n = 3 biologically independent samples. c Cy5 mRNA in CD63/CD9 positive EVs. CD63+ EVs were stained against CD9 antibody and analyzed by FACS for Cy5 mRNA detection. The sole beads incubated with PBS instead of EVs are shown as negative control. Approximately 96% of immunoprecipitated EVs (50 µg assay) from untreated cells are positive for CD63 and CD9 but they are negative for mRNA. By contrast, ~88% of immunoprecipated EVs (50 µg assay) from LNP-treated cells are positive for CD63 and CD9, and 26% EVs contain mRNA that is secreted after the endocytosis of LNP-mRNA. The percentage of CD63/CD9 positive EVs containing Cy5 mRNA is presented in the upper right quadrant. The FACS dot plots represent Cy5 mRNA (y-axis) vs. CD9 (x-axis). One out of two biological replicates is shown. Source data are provided as a Source Data file
Fig. 3
Fig. 3
Detection of hEPO protein in mouse blood after hEPO mRNA delivery via EVs Mice were intravenously injected with 100 μL of mc3-EVs containing 1.5 µg of hEPO mRNA (per mouse). The concentrations of hEPO protein in murine plasma were determined by Gyros immunoassay for hEPO at 0 (untreated), 2, 5, and 24 h after EV injection. The hEPO protein was detected in mouse blood at 2 h after EV injection. N = 8 independent animals at each time point except for 2 h (n = 4) are presented. The plasma hEPO protein from mc3-EV delivery was compared between 2 and 5 h by unpaired two-tailed Student’s t-test, although the difference was not statistically significant (ns = not significant). Source data are provided as a Source Data file
Fig. 4
Fig. 4
Quantification of hEPO mRNA and hEPO protein in mouse organs. Mice were intravenously injected with 100 μL of mc3-EVs containing 1.5 µg of hEPO-mRNA (per mouse). At 5, 24, and 96 h after EV injection, the levels of hEPO mRNA and hEPO protein were determined in eight organs by qPCR and ELISA, respectively. a, b Levels of hEPO mRNA and protein in the heart, c, d lung, e, f liver, g, h spleen, i, j kidney, k, l thymus, m, n pancreas, and o, p brain are shown. The highest amount of hEPO protein was detected in the liver, whereas the highest amount of hEPO mRNA was detected in the spleen. Data are presented as the mean (bars) and standard deviation (SD) n = 4 independent animals at each time point. EVs and untreated groups were compared at each time point using the unpaired two-tailed Student’s t-test. *p < 0.05, **p < 0.01, and ***p < 0.001. Source data are provided as a Source Data file
Fig. 5
Fig. 5
Comparison of hEPO protein levels in murine blood and organs. The ability of mc3-EVs and MC3-LNPs to produce hEPO protein upon injection of equal doses of hEPO mRNA (1.5 µg) into mice was compared. In most organs, the amount of hEPO protein was comparable between LNPs and EVs except for the spleen, which showed a significant difference in protein production followed by the heart (less significant difference). The most significant difference was observed in the plasma levels of hEPO protein, which were considerably higher for MC3-LNPs than for mc3-EVs. Data are presented as the mean (bars) and standard deviation (SD) n = 4 independent animals at each time point except for LNPs and EVs at 5 h for plasma analysis (n = 8). EV and LNP groups were compared for each organ or plasma at each time point using the unpaired two-tailed Student’s t-test. *p < 0.05, **p < 0.01, ***p < 0.001, and ****p < 0.0001. Source data are provided as a Source Data file
Fig. 6
Fig. 6
Cytokine analysis in mouse plasma after mc3-EV and MC3-LNP delivery. Mice were intravenously injected with 100 μL of mc3-EVs or MC3-LNPs containing 1.5 µg of hEPO-mRNA (per mouse). The concentrations of eight pro-inflammatory cytokines including IL-6 (a), IP-10 (b), RANTES (c), MCP-1 (d), KC (e), IL1-β (f), TNF-α (g), and IFN-γ (h) were determined in mouse plasma after 5 and 24 h of mc3-EV, MC3-LNP or PBS injection. The levels of pro-inflammatory cytokines were significantly higher in mice receiving LNP injection than in those receiving EV injection. White squares: PBS, black circles: EVs and black triangles: LNPs. Data are presented as the mean (bars) and standard deviation (SD) n = 4 independent animals at each time point. Statistical analysis was performed using one-way ANOVA, followed by Sidak’s multiple comparisons test. Significant differences are shown as p-values. Source data are provided as a Source Data file
Fig. 7
Fig. 7
A hypothetical mechanism explaining the fate of LNP endosomes. a step 1, 2: after the endocytosis of LNPs, lysosomes fuse with early endosomes and cause the acidification of the endosomal environment (pH 5.5–6.2). a step 3: the surface of LNPs is positively charged, drawing LNPs to the inner membrane of the endosomes, which is negatively charged, . This enables the lipid components of LNPs to fuse with the endosomal membrane, allowing the mRNA translocation to the water phase outside the endosomes. Only the mRNA when neutrally charged by ionizable cationic lipids (ratio 1:1 mRNA:lipid) can cross the endosomal membrane. RNA:lipd ratio other than 1:1 would theoretically be unable to cross the endosomal membrane. b In acidic environment (pH 5.8 or 6.6), the mRNA is slightly released from LNPs, whereas at neutral pH (~7.4), the mRNA and lipids are dissociated (The data are shown as standard error of the mean of three replicates). a step 4a: part of the LNP-mRNA that escapes the endosomal membrane and localizes to the cytoplasm could be dissociated from the ionizable lipids because the pH of the cytoplasm is neutral, consistent with the results shown in b). By contrast a step 4b: when LNP-mRNA is transported to the cytoplasmic side of the endosomal membrane, intraluminal vesicles are formed by invagination of the endosomal membrane, and a portion of the LNP-mRNA could be incorporated into these vesicles. a step 4a and 5: since only a 1:1 ratio (neutral) can cross the endosomal membrane and become incorporated into luminal vesicles of endosomes, endo-EVs contained a 1:1 ratio of hEPO mRNA and ionizable lipids. a step 5: the luminal vesicles are then released into the extracellular environment upon the fusion of multivesicular endosomes with the plasma membrane. c Since LNPs with the same ionizable lipids used in this study are currently being utilized in clinical trials and endo-EVs contained hEPO mRNA acquired after the endocytosis of LNPs and delivered to other cells, we postulate that a similar scenario may occur in individuals administered with LNPs, suggesting that part of the mRNA delivery is achieved by such EVs

References

    1. Dunbar, C. E. et al. Gene therapy comes of age. Science359, pii: eaan4672 (2018). - PubMed
    1. Pardi N, Hogan MJ, Porter FW, Weissman D. mRNA vaccines—a new era in vaccinology. Nat. Rev. Drug Disco. 2018;17:261–279. doi: 10.1038/nrd.2017.243. - DOI - PMC - PubMed
    1. Khvorova A, Watts JK. The chemical evolution of oligonucleotide therapies of clinical utility. Nat. Biotechnol. 2017;35:238–248. doi: 10.1038/nbt.3765. - DOI - PMC - PubMed
    1. Wittrup A, et al. Visualizing lipid-formulated siRNA release from endosomes and target gene knockdown. Nat. Biotechnol. 2015;33:870–876. doi: 10.1038/nbt.3298. - DOI - PMC - PubMed
    1. Ball RL, Hajj KA, Vizelman J, Bajaj P, Whitehead KA. Lipid Nanoparticle Formulations for Enhanced Co-delivery of siRNA and mRNA. Nano Lett. 2018;18:3814–3822. doi: 10.1021/acs.nanolett.8b01101. - DOI - PubMed

Publication types