. 2019 Sep 24;10(1):4161.
doi: 10.1038/s41467-019-12069-w.

Human induced pluripotent stem cell-derived vocal fold mucosa mimics development and responses to smoke exposure

Affiliations

Human induced pluripotent stem cell-derived vocal fold mucosa mimics development and responses to smoke exposure

Vlasta Lungova et al. Nat Commun. .

Abstract

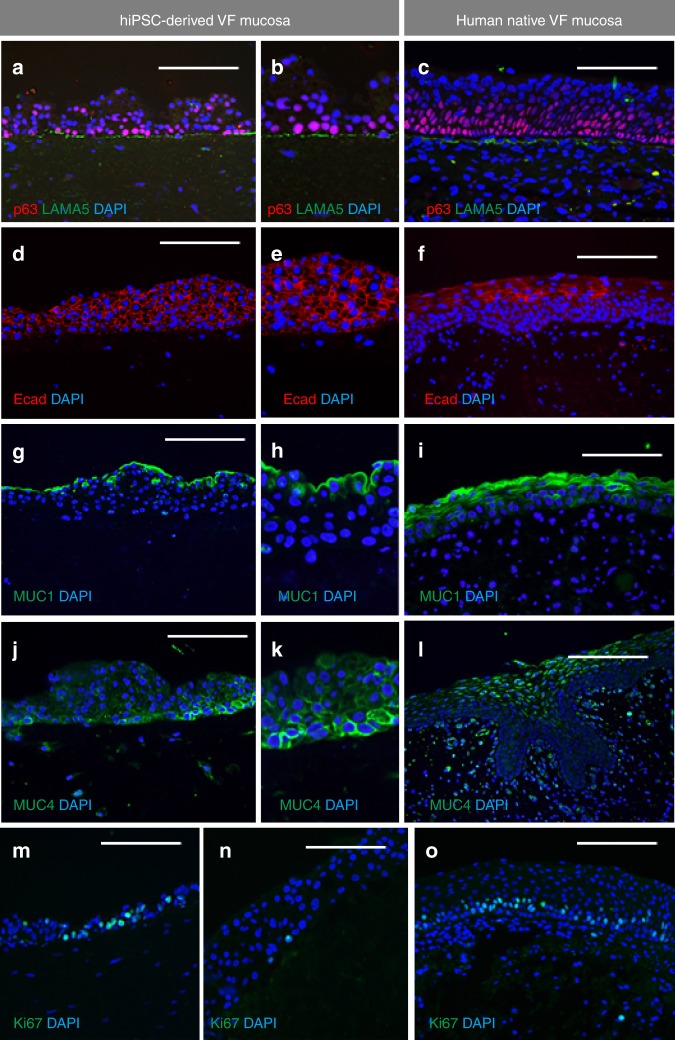
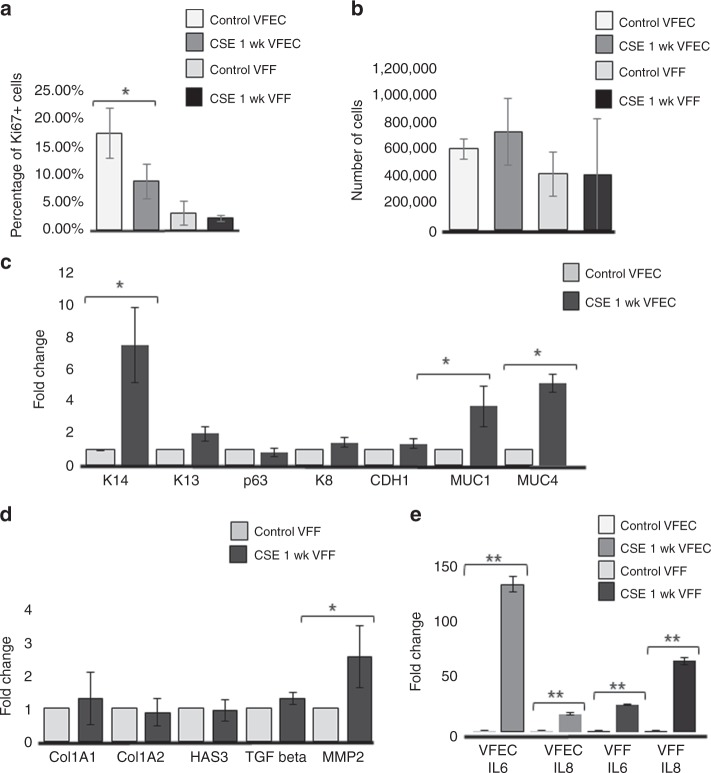
Development of treatments for vocal dysphonia has been inhibited by lack of human vocal fold (VF) mucosa models because of difficulty in procuring VF epithelial cells, epithelial cells' limited proliferative capacity and absence of cell lines. Here we report development of engineered VF mucosae from hiPSC, transfected via TALEN constructs for green fluorescent protein, that mimic development of VF epithelial cells in utero. Modulation of FGF signaling achieves stratified squamous epithelium from definitive and anterior foregut derived cultures. Robust culturing of these cells on collagen-fibroblast constructs produces three-dimensional models comparable to in vivo VF mucosa. Furthermore, we demonstrate mucosal inflammation upon exposure of these constructs to 5% cigarette smoke extract. Upregulation of pro-inflammatory genes in epithelium and fibroblasts leads to aberrant VF mucosa remodeling. Collectively, our results demonstrate that hiPSC-derived VF mucosa is a versatile tool for future investigation of genetic and molecular mechanisms underlying epithelium-fibroblasts interactions in health and disease.


Conflict of interest statement

The authors declare no competing interests.

Figures

Fig. 1
Fig. 1
Green fluorescent protein incorporation into the genome of hiPSC. a Green GFP-positive colonies after nucleofection. b Confirmation of correct GFP insertion with the polymerase chain reaction and southern blotting. ce Colonies of green GFP-positive B10 clones selected for differentiation (c). A detail of the B10 GFP + colony (d). A bright-field image of B10 GFP + colony (e). fn show stable and persistent GFP insertion throughout cell differentiation, including bright field images, in the DE (fh), AFE (ik), and VBP before seeding on the collagen constructs (ln). Scale bars in the panels of a, c, e, f, h, i, k, l, n = 400 μm. Scale bars in the panels of d, g, j, and m = 200 μm. AFE anterior foregut endoderm, DE definitive endoderm, GFP green fluorescent protein, hiPSC human induced pluripotent stem cells, VBP vocal fold basal progenitors. Source data provided as a Source Data file
Fig. 2
Fig. 2
Generation of anterior foregut cell cultures from DE monolayers. a Differentiation of hiPSC into the DE and AFE. bk Expression levels of the markers of the DE and AFE during differentiation characterized with quantitative polymerase chain reaction (b, g) and immunofluorescent staining for SOX17 (c), FOXA2 (d, i), EPCAM (e), cytokeratin K8 (f, k), SOX2 (h), and p63 (j), scale bar = 200 μm. Controls in b, g are hiPSC. In b, value of 0 = 1 for hiPSC control, and in g 0 = 0 expression for controls. We used one-way ANOVA to assess statistical significance between gene expression levels. Except for cytokeratin K13 with p-value = 0.06, p-values for other tested genes were below the threshold p-value < 0.05 indicating that expression levels of these genes significantly differed during differentiation. Error bars represent ± standard error of the mean, n = 3 per group. l, m Gating strategy for confirmation of DE and AFE cell populations by flow cytometry. Cell populations were sorted based on GFP expression and CXCR4 and EPCAM for DE (l) and CD56 and NGFR + for AFE (m). ACTA activin A, AFE anterior foregut endoderm, DE definitive endoderm, hiPSC human induced pluripotent stem cells, VBP vocal fold basal progenitors. Source data provided as a Source Data file
Fig. 3
Fig. 3
Induction of stratification in the AFE by modulating FGF signaling. a hiPSC were differentiated into the DE and AFE. AFE-derived cell cultures were then treated with various concentrations of fibroblasts growth factors (FGF2, FGF7, and FGF10) to derive VBP (groups 1–4). b Comparison in expression of SHH, Cytokeratin 8, and stratified cell markers p63, Cytokeratin 5, 14, and 13 between experimental groups and AFE cells that were collected at day 8 of differentiation and received no treatment. Error bars represent ± standard error of the mean, n = 3 per group. We used one-way ANOVA to assess statistical significance for tested genes. All of the p-values for tested genes are below the threshold p-value < 0.05 indicating that expression levels of tested genes in FGFs treated groups significantly differed from the expression levels in AFE controls. ACTA Activin A, AFE anterior foregut endoderm, DE definitive endoderm, hiPSC human induced pluripotent stem cells, NG noggin, SB SB-431542, VBP vocal fold basal progenitors. Source data provided as a Source Data file
Fig. 4
Fig. 4
Generation of 3D hiPSC-derived human VF mucosa. a Protocol for generation of human induced pluripotent stem cell-derived vocal fold mucosa through DE and AFE. b Comparison in expression levels of p63, Cytokeratin 14, 13, 5, and 8, and Mucin 1 and 4 between fully differentiated hiPSC-derived VFEC after 32 days in culture and earlier stages of differentiation. VFEC were isolated from the entire constructs at day 32. We used one-way ANOVA to assess statistical significance for tested genes. All of the p-values for tested genes were below the threshold p-value < 0.01 (expressed as **), indicating that expression levels of tested genes in fully differentiated hiPSC-derived VFEC significantly differed from the expression levels of these genes in hiPS cells, DE, AFE, and VBP. ACTA Activin A, AFE anterior foregut endoderm, DE definitive endoderm, hiPSCs human induced pluripotent stem cells, NG Noggin, VBP vocal fold basal progenitors, VFEC vocal fold epithelial cells. Source data provided as a Source Data file
Fig. 5
Fig. 5
Characterization of hiPSC-derived 3D VF mucosa. a, b Hematoxylin–eosin staining showing morphology of human iPSc-derived VFEC. c Immunofluorescent anti-GFP staining of VFEC showing persistency in GFP expression (red). d Immunofluorescence staining for Cytokeratin 14 (green). e, f Double staining of anti-GFP (red) and Cytokeratin 14 (green) showing that GFP + cells preferentially differentiate into Cytokeratin 14 + cells. Scale bars in the panels of a, d, and e = 200 μm. Scale bars in the panels of b, c, and f = 100 μm. go Confirmation of the specificity of VF epithelial differentiation examining NKX2-1 in red (g, h), FOXE1 in red (j, k), and SOX2 in red (m, n). HiPSC-derived VF epithelium and human VF mucosa were negative for NKX2-1, FOXE1, and SOX2. Human lungs were used as a positive control for NKX2-1 (i), human tonsils were used as a positive control for FOXE1 (l), and AFE cell cultures were used for confirmation of SOX2 expression (o). Scale bars in the panels of go = 200 μm. AFE anterior foregut endoderm, hiPSC human induced pluripotent stem cell, VF vocal fold
Fig. 6
Fig. 6
Pattern of expression of stratified markers in hiPSC-derived VFEC. a, b Hematoxylin–eosin staining showing differences in morphology between hiPSC-derived VFEC (a) and human native VF mucosa (b). A solid black arrow denotes a flattened luminal cell layer. ch Double immunofluorescent staining showing expression of Cytokeratin 14 (green) and p63 gene (red) in hiPSC-derived VFEC (c, e) and native VF mucosa (f, h) and anti-p63 staining showing p63 + basal cells in hiPSC-derived VFEC (d) and native VF mucosa (g). il Double immunofluorescent staining showing the expression of Cytokeratin 13 (green) along with p63 (red) in hiPSC-derived VFEC (i, k) and native VF mucosa (l). j Anti-p63 staining showing p63 + basal cells in hiPSC-derived VFEC. m, n Immunofluorescent staining showing pattern of expression of Cytokeratin 8 in hiPSC-derived VFEC (m) and human native VF mucosa (n). Scale bar = 200 μm. hiPSC human induced pluripotent stem cell, VF vocal fold
Fig. 7
Fig. 7
Characterization of structural and functional genes expressed in the hiPSC-derived VF mucosa. ac Double immunofluorescent staining for expression p63 (red) and Laminin alfa 5 (green) showing that hiPSC-derived VFEC form a basement membrane (a, b) similar to VFEC in human native VF mucosa (c). df Immunofluorescent staining comparing the expression pattern of E-Cadherin (red) in hiPSC-derived VF mucosa (d, e) and human native VF mucosa (f). gi Immunofluorescent staining comparing the expression pattern of MUC1 (green) in hiPSC-derived VF mucosa (g, h) and human native VF mucosa (i). jl Immunofluorescent staining comparing the expression pattern of MUC4 (green) in hiPSC-derived VF mucosa (j, k) and human native VF mucosa (l). mo Immunofluorescent staining comparing intensity of cell proliferation, anti-Ki67staining (green), in hiPSC-derived VF mucosa (m, n), and human native VF mucosa (o). Scale bar = 200 μm. hiPSC human induced pluripotent stem cell, VF vocal fold
Fig. 8
Fig. 8
Changes in expression of stratified markers after 5% CSE exposure for 1 week. a, b Hematoxylin–eosin staining showing morphology of the control VF epithelium (a) and 5% cigarette smoke extract exposed VF epithelium (b). ch Double immunofluorescent staining showing the expression of Cytokeratin 14 (green) and p63 gene (red) in control VF mucosa (c, e) and CSE exposed VF mucosa (f, h) and anti-p63 staining showing the p63 + basal cells in control VF mucosa (d) and CSE exposed VF mucosa (g). il Double immunofluorescent staining showing the expression of Cytokeratin 14 (green) along with GFP (red) in control VF mucosa (i, j) and CSE treated VF mucosa (k, l). White solid arrows point to downregulation of Cytokeratin 14 in the basal cellular compartment. m, n Double immunofluorescent staining showing the expression of Cytokeratin 13 (green) and p63 gene (red) in control VF mucosa (m) and CSE exposed VF mucosa (n). oq Immunofluorescent staining showing the pattern of expression of Cytokeratin 8 in control VF mucosa (o) and CSE exposed VF mucosa (p, q). Scale bars in the panels of a, b, c, d, f, g, m, n, o, and p = 200 μm. Scale bars in the panels of i, k = 100 μm. CSE cigarette smoke extract, wk week
Fig. 9
Fig. 9
Changes in expression structural and functional genes after 5% CSE exposure for 1 week. a, b Double immunofluorescent staining for expression p63 (red) and Laminin alfa 5 (green) in control VF mucosa (a) and CSE VF mucosa (b). c, d Immunofluorescent staining comparing the expression of E- Cadherin (red) in control VF mucosa with slightly more intense staining in the basal cell layer (c) and CSE treated VF mucosa (d). e, f Immunofluorescent staining comparing the expression of MUC1 (green) in control VF mucosa (e) with more intense MUC1 staining in the CSE VF mucosa (f). g, h Immunofluorescent staining comparing the expression of MUC4 (green) in control VF mucosa (g) with a slightly more intense MUC4 staining in the CSE VF mucosa (h). i, j Distribution of Ki67 + VFEC and VFF in control VF mucosa (i) and CSE exposed VF mucosa (j). CSE cigarette smoke extract, wk week
Fig. 10
Fig. 10
Transcript levels of characteristic stratified and epithelial markers after 5% CSE exposure for 1 week. a Quantitative assessment of cell proliferation in control VFEC and VFF vs VFEC and VFF exposed to the CSE. Error bars represent ± standard error of the mean, n = 3.Two-sample t tests confirmed statistical significant decreases in cell proliferation in CSE exposed VFEC only (p < 0.05, expressed as *). b Quantitative assessment of the cell number sorted by flow cytometry. Error bars represent ± standard error of the mean, n = 3. Two-sample t tests showed that there was no significant difference in cell numbers between control and CSE exposed VFEC and VFF (p-values were above the threshold, p > 0.05), indicating that CSE does not affect the viability. c Changes in the expression levels of selected epithelial genes: Cytokeratin 14, 13, 8, p63 gene, CDH1 (E-Cadherin), MUC1, MUC4 in control VFEC, and 5% CSE exposed VFEC. Cells were isolated from entire constructs in control and 5% CSE exposed experimental groups. We used two-sample t tests to assess statistical significance in tested genes. Increased expression levels of Cytokeratin 14, MUC1, and MUC4 in 5% CSE treated group were statistically significant (p < 0.05, expressed as *). Error bars represent ± standard error of the mean, n = 3. d Changes in expression levels in structural (Col1A1; Col1A2; HAS3) and functional (TGF beta and MMP-2) genes in VFF. Cells were isolated from entire constructs in control and 5% CSE exposed experimental groups. Two-sample t tests confirmed statistical significance in MMP-2 expression only (p < 0.05, expressed as *). P-values of other genes were above p > 0.05, suggesting the 5% CSE did not significantly change the morphology or function of VFF. Error bars represent ± standard error of the mean, n = 3. e Activation of pro-inflammatory genes, Il6 and Il8, in control and CSE exposed VFEC and VFF. VFEC and VFF were analyzed and evaluated independently, as they were sorted by the flow cytometry prior to RNA isolation. Two-sample t tests confirmed statistical significance in expression in pro-inflammatory genes in cigarette smoke extract exposed VFEC and VFF (p < 0.01, expressed as **). CSE cigarette smoke extract, VFEC vocal fold epithelial cells, VFF vocal fold fibroblasts, wk. week. Source data provided as a Source Data file

References

    1. Smith E, et al. Effect of voice disorders on quality of life. J. Med. Speech-Lang. Pathol. 1996;4:223–244.
    1. Benninger MS, Ahuja AS, Gardner G, Grywalski C. Assessing outcomes for dysphonic patients. J. Voice. 1998;12:540–550. doi: 10.1016/S0892-1997(98)80063-5. - DOI - PubMed
    1. Arnold GE. Vocal nodules and polyps: laryngeal tissue reaction to habitual hyperkinetic dysphonia. J. Speech Lang. Hear. Disord. 1962;27:205–217. doi: 10.1044/jshd.2703.205. - DOI - PubMed
    1. Dikkers FG, Hulstaert CE, Oosterbaan JA, Cervera-Paz FJ. Ultrastructural changes of basement membrane zone in benign lesions of the vocal folds. Acta Otolaryngol. 1993;113:98–101. doi: 10.3109/00016489309135774. - DOI - PubMed
    1. Kotby MN, Nassar AM, Seif EL, Helda EH, Saleh MM. Ultrastructural features of vocal fold nodules and polyps. Acta Otolaryngol. 1988;105:477–482. doi: 10.3109/00016488809119505. - DOI - PubMed

Publication types

MeSH terms