

CommonMind Consortium provides transcriptomic and epigenomic data for Schizophrenia and Bipolar Disorder
- PMID: 31551426
- PMCID: PMC6760149
- DOI: 10.1038/s41597-019-0183-6
CommonMind Consortium provides transcriptomic and epigenomic data for Schizophrenia and Bipolar Disorder
Abstract
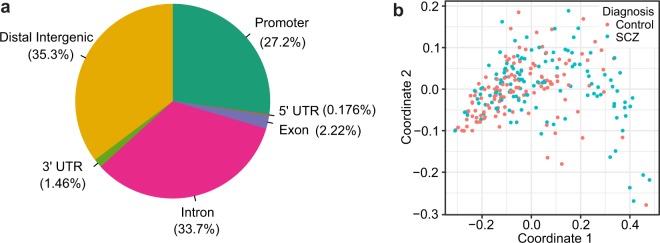
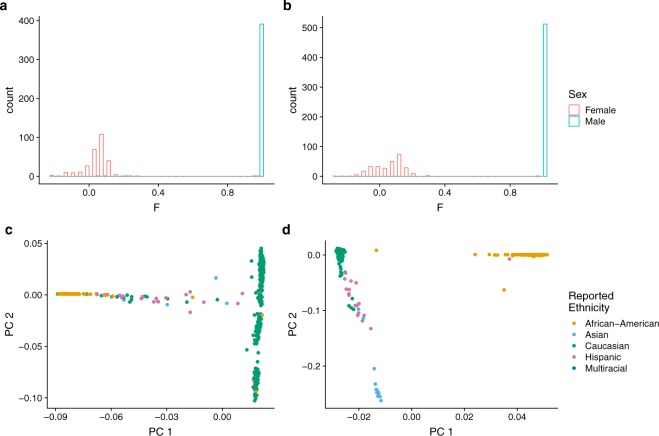
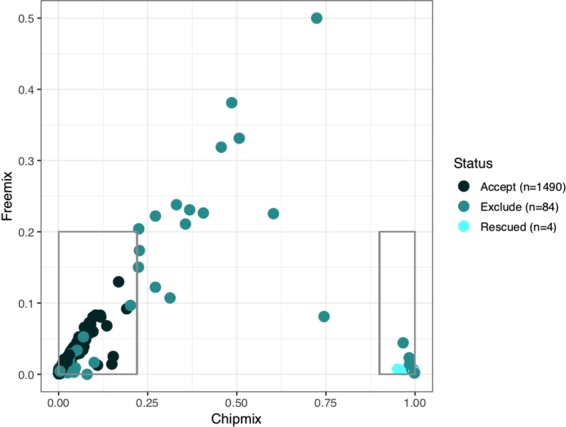
Schizophrenia and bipolar disorder are serious mental illnesses that affect more than 2% of adults. While large-scale genetics studies have identified genomic regions associated with disease risk, less is known about the molecular mechanisms by which risk alleles with small effects lead to schizophrenia and bipolar disorder. In order to fill this gap between genetics and disease phenotype, we have undertaken a multi-cohort genomics study of postmortem brains from controls, individuals with schizophrenia and bipolar disorder. Here we present a public resource of functional genomic data from the dorsolateral prefrontal cortex (DLPFC; Brodmann areas 9 and 46) of 986 individuals from 4 separate brain banks, including 353 diagnosed with schizophrenia and 120 with bipolar disorder. The genomic data include RNA-seq and SNP genotypes on 980 individuals, and ATAC-seq on 269 individuals, of which 264 are a subset of individuals with RNA-seq. We have performed extensive preprocessing and quality control on these data so that the research community can take advantage of this public resource available on the Synapse platform at http://CommonMind.org .
Conflict of interest statement
The authors declare no competing interests.
Figures
References
Publication types
MeSH terms
Grants and funding
- R01MH110921/U.S. Department of Health & Human Services | National Institutes of Health (NIH)/International
- U01 MH116442/MH/NIMH NIH HHS/United States
- R37 MH057881/MH/NIMH NIH HHS/United States
- MH06692/U.S. Department of Health & Human Services | National Institutes of Health (NIH)/International
- R01MH093725/U.S. Department of Health & Human Services | National Institutes of Health (NIH)/International
- AG05138/U.S. Department of Health & Human Services | National Institutes of Health (NIH)/International
- P50MH080405/U.S. Department of Health & Human Services | National Institutes of Health (NIH)/International
- AG02219/U.S. Department of Health & Human Services | National Institutes of Health (NIH)/International
- R37MH057881/U.S. Department of Health & Human Services | National Institutes of Health (NIH)/International
- R01MH085542/U.S. Department of Health & Human Services | National Institutes of Health (NIH)/International
- R01MH109897/U.S. Department of Health & Human Services | National Institutes of Health (NIH)/International
- R01 MH110921/MH/NIMH NIH HHS/United States
- P50MH084053S1/U.S. Department of Health & Human Services | National Institutes of Health (NIH)/International
- U01MH116442/U.S. Department of Health & Human Services | National Institutes of Health (NIH)/International
- U01MH103392/U.S. Department of Health & Human Services | National Institutes of Health (NIH)/International
- R01 MH109897/MH/NIMH NIH HHS/United States
- R01MH074313/U.S. Department of Health & Human Services | NIH | National Institute of Mental Health (NIMH)/International
- R01MH109677/U.S. Department of Health & Human Services | National Institutes of Health (NIH)/International
- R01 MH057881/MH/NIMH NIH HHS/United States
- S10 OD018522/OD/NIH HHS/United States
- R01 MH109677/MH/NIMH NIH HHS/United States
- R01-MH-075916/U.S. Department of Health & Human Services | National Institutes of Health (NIH)/International
- P50MH066392/U.S. Department of Health & Human Services | National Institutes of Health (NIH)/International
- R01MH097276/U.S. Department of Health & Human Services | National Institutes of Health (NIH)/International
- 27209/Brain and Behavior Research Foundation (Brain & Behavior Research Foundation)/International
- 26313/Brain and Behavior Research Foundation (Brain & Behavior Research Foundation)/International
- P50M096891/U.S. Department of Health & Human Services | National Institutes of Health (NIH)/International
LinkOut - more resources
Full Text Sources
Other Literature Sources
Medical
Miscellaneous
