. 2019 Sep 24;9(1):13789.
doi: 10.1038/s41598-019-50219-8.

Mice depleted for Exchange Proteins Directly Activated by cAMP (Epac) exhibit irregular liver regeneration in response to partial hepatectomy

Affiliations

Mice depleted for Exchange Proteins Directly Activated by cAMP (Epac) exhibit irregular liver regeneration in response to partial hepatectomy

Kathrine Sivertsen Åsrud et al. Sci Rep. .

Abstract

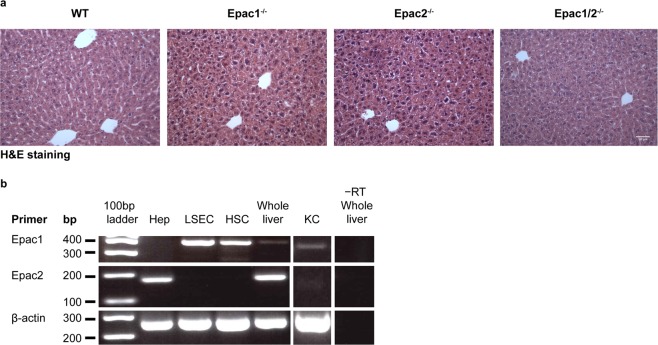
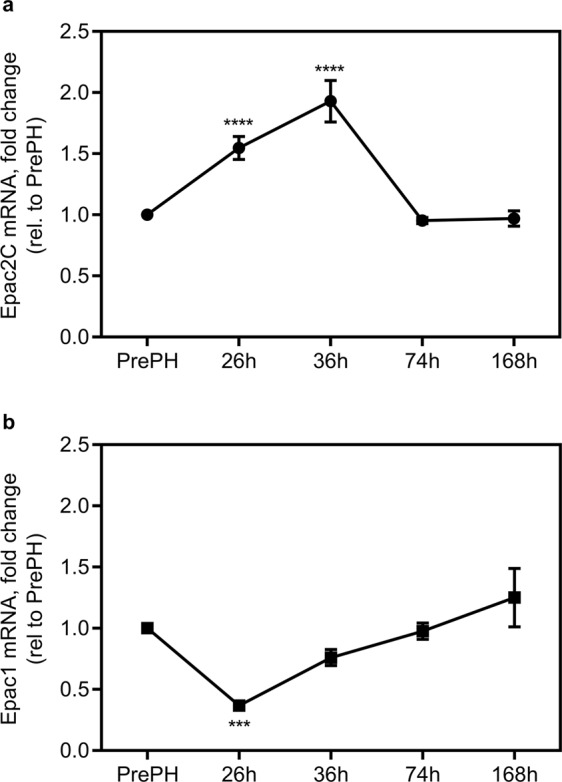
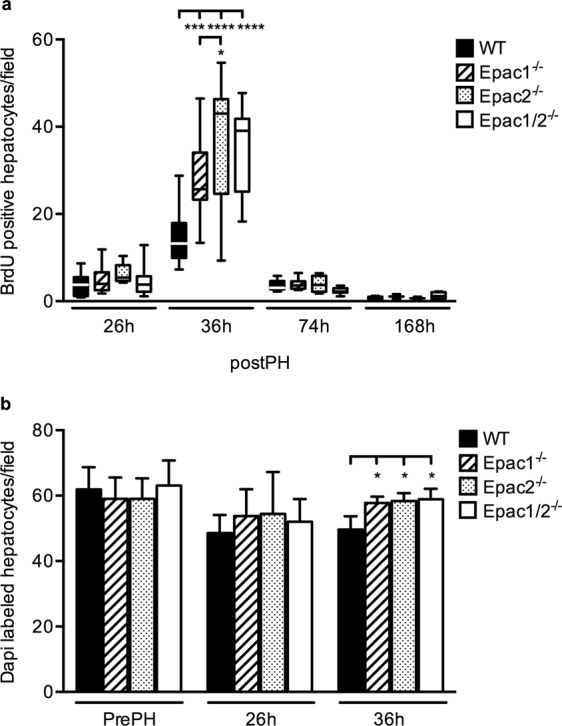
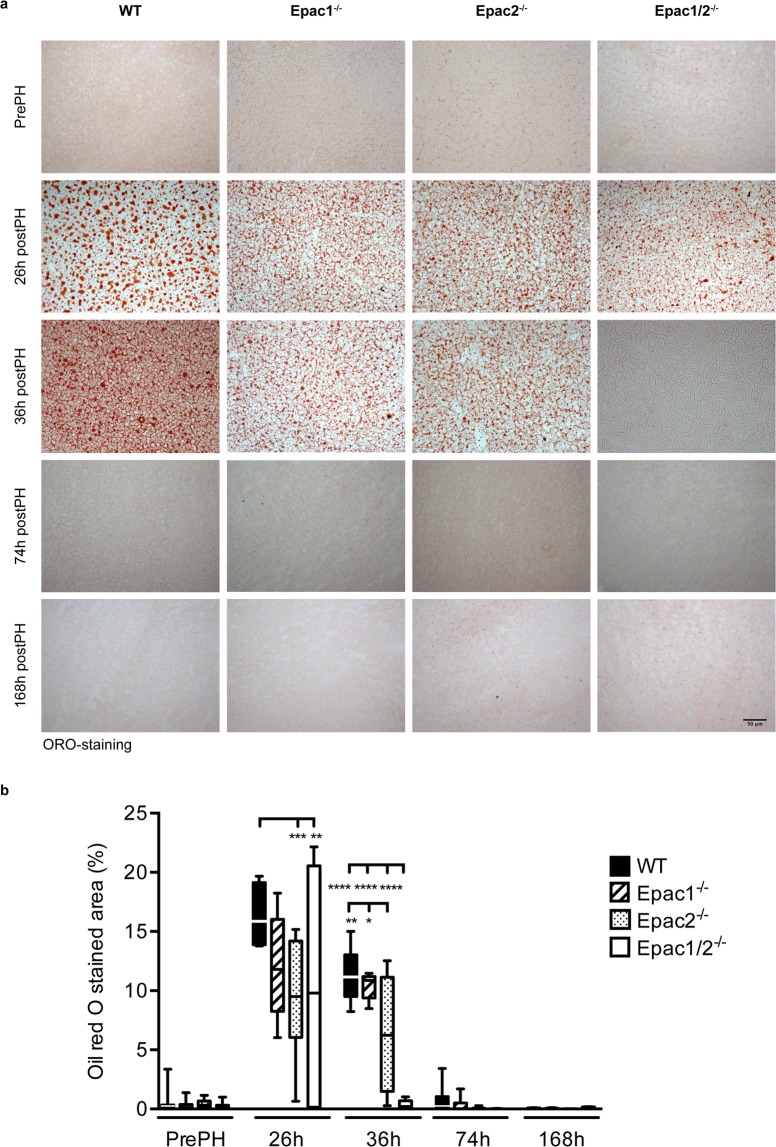
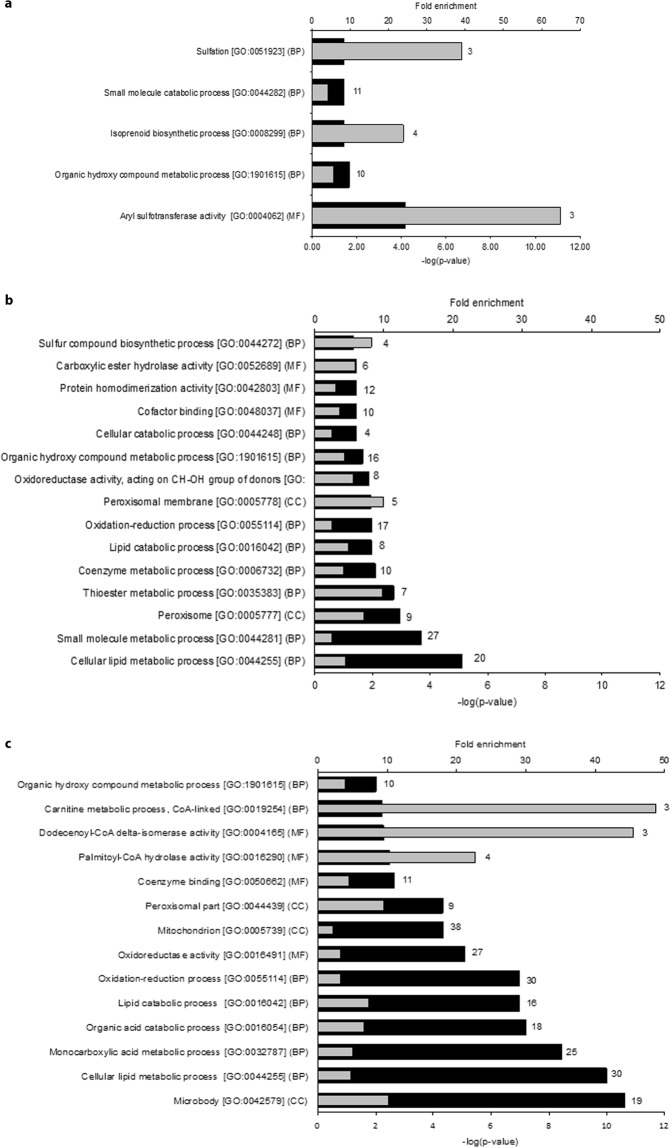
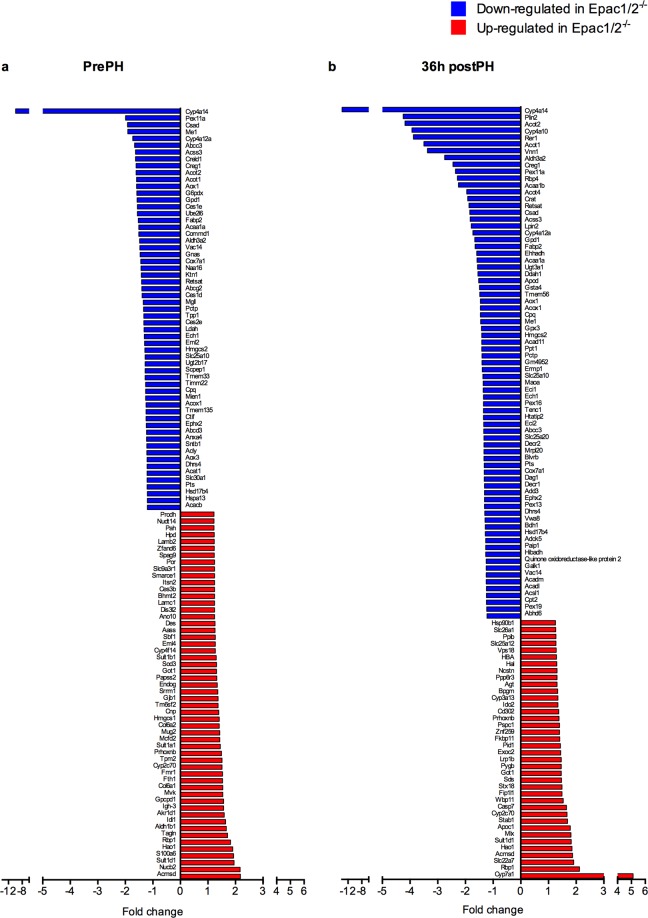
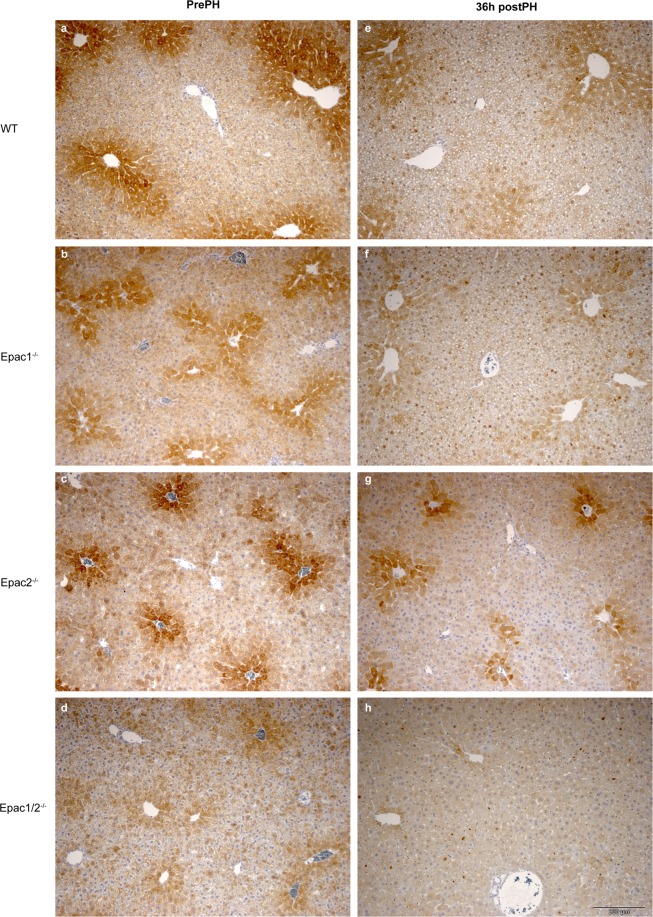
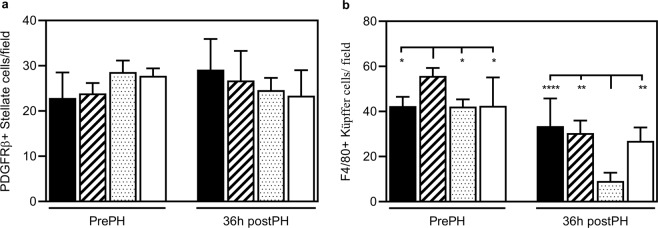
The exchange proteins directly activated by cAMP 1 and 2 (Epac1 and Epac2) are expressed in a cell specific manner in the liver, but their biological functions in this tissue are poorly understood. The current study was undertaken to begin to determine the potential roles of Epac1 and Epac2 in liver physiology and disease. Male C57BL/6J mice in which expression of Epac1 and/or Epac2 are deleted, were subjected to partial hepatectomy and the regenerating liver was analyzed with regard to lipid accumulation, cell replication and protein expression. In response to partial hepatectomy, deletion of Epac1 and/or Epac2 led to increased hepatocyte proliferation 36 h post surgery, and the transient steatosis observed in wild type mice was virtually absent in mice lacking both Epac1 and Epac2. The expression of the protein cytochrome P4504a14, which is implicated in hepatic steatosis and fibrosis, was substantially reduced upon deletion of Epac1/2, while a number of factors involved in lipid metabolism were significantly decreased. Moreover, the number of Küpffer cells was affected, and Epac2 expression was increased in the liver of wild type mice in response to partial hepatectomy, further supporting a role for these proteins in liver function. This study establishes hepatic phenotypic abnormalities in mice deleted for Epac1/2 for the first time, and introduces Epac1/2 as regulators of hepatocyte proliferation and lipid accumulation in the regenerative process.


Conflict of interest statement

The authors declare no competing interests.

Figures

Figure 1
Figure 1
Expression of Epac1/2 in liver cells. (a) H&E (20x) staining of liver sections from wt, Epac1−/−, Epac2−/− and Epac1/2−/− mice. Bar: 100 μm. (b) RT-PCR of Epac1 and Epac2 mRNA in hepatocytes (Hep), liver sinusoidal endothelial cells (LSEC), hepatic stellate cells (HSC), Küpffer cells (KC) and whole liver. −RT: without reverse transcriptase.
Figure 2
Figure 2
The expression of Epac2C mRNA is increased in liver after PH. qPCR analysis of (a) Epac2C and (b) Epac1 mRNA in liver pre-PH or 26 h, 36 h, 74 h and 168 h post-PH in wt mice. The CT values for resected tissue (4.39 ± 0.12 for Epac2C and 12.29 ± 0.38 for Epac1) were set to 1. Data are expressed as mean ± SD of three separate experiments performed in triplicates. One-way ANOVA with Dunnett’s adjustment for multiple comparisons was used to determine statistical differences. ***p < 0.001 and ****p < 0.0001: mRNA levels in wt livers pre-PH compared to mRNA levels in wt livers at the different postoperative time points (26 h, 36 h, 74 h or 168 h post-PH). F-statistics (a): F(4,9) = 75.57, p < 0.0001 and (b): F(4,10) = 24.50, p < 0.0001.
Figure 3
Figure 3
Increased BrdU-incorporation 36 h post-PH in Epac1−/−, Epac2−/− and Epac1/2−/− mice. (a) BrdU incorporation was analyzed in wt, Epac1−/−, Epac2−/− and Epac1/2−/−  mice post-PH for the indicated time points. Data is shown as box and whiskers with median and min to max whiskers, n = 2–13 mice/group (6–13 mice/group at 26 h and 36 h). (b) Quantification of DAPI staining pre-PH, 26 h and 36 h post-PH. Data is shown as mean ± SD, n = 3–9 mice/group. Two-way ANOVA with Bonferroni’s adjustment for multiple comparisons was used to determine statistical differences between genotypes within each time point. *p < 0.05, ***p < 0.001 and ****p < 0.0001. F-statistics; (a) F(9,104) = 5.331, p < 0.0001 and (b) F(6,55) = 1.436, p = 0.2176. (a) 36 h post-PH (mean ± SD): wt: 15.04 ± 6.61; Epac1−/−: 27.97 ± 10.22; Epac2−/−: 36.57± 15.32; Epac1/2−/−: 34.86 ± 9.37. (b): 36 h post-PH (mean ± SD): wt: 49.6 ± 4.1; Epac1−/−: 57.8 ± 1.9; Epac2−/−: 58.4 ± 2.4; Epac1/2−/−: 58.9 ± 3.2.
Figure 4
Figure 4
Epac1/2−/− mice are devoid of  fat vacuoles 36 h post-PH. ORO staining of sections from livers from wt, Epac1−/−, Epac2−/− and Epac1/2−/− mice pre- and post-PH as indicated (20x). (a) Representative images of ORO staining. (b) Quantification of ORO-staining. The median and left lateral lobes resected during surgery were used as control tissue in these experiments. Data are shown as box and whiskers with median and min to max whiskers, n = 4–8 mice/group post-PH and n = 17–23 mice/group pre-PH. Two-way ANOVA with Bonferroni’s adjustment for multiple comparisons was used to determine statistical differences between genotypes within each time point. *p < 0.05, **p < 0.01, ***p < 0.001 and ****p < 0.0001. F-statistics: F(12,149) = 5.152, p < 0.0001.
Figure 5
Figure 5
Functional annotation of differentially expressed proteins. GO enrichment analyses on proteins that were differentially expressed in wt and Epac1/2−/− mice (a/b) pre- or (c) 36 h post-PH. (a) Functional annotation of proteins with significantly higher expression pre-PH in Epac1/2−/− mice compared to wt. (b) Functional annotation of proteins with significantly lower expression pre-PH in Epac1/2−/− mice compared to wt. (c) Functional annotation of proteins with significantly lower expression post-PH in Epac1/2−/− mice compared to wt. Black bars indicate the respective p-values and grey bars indicate fold enrichment for the corresponding GO-term. The number of proteins annotated with each GO-term is shown behind each bar. BP: biological processes; MF: molecular function (MF); CC: cellular compartment.
Figure 6
Figure 6
Differentially expressed proteins in Epac1/2−/− mice compared to wt. The proteins that were differently expressed in Epac1/2−/− mice compared to wt mice (a) pre- and (b) post-PH are listed. Blue bars indicate proteins that were decreased in Epac1/2−/− mice compared to wt mice, and red bars indicate proteins that were increased in Epac1/2−/− mice compared to wt mice. Statistics: two-tailed student’s two-sample t-test and Z-statistics for FC, only when p < 0.05 for both it was considered significant.
Figure 7
Figure 7
Decreased expression of Cyp4A14 in Epac1/2−/− deficient mice. IHC analyses (DAB staining) to determine Cyp4a14 expression in liver sections from wt, Epac1−/−, Epac2−/− and Epac1/2−/− mice pre-PH (a–d) and 36 h post-PH (e–h). The antibody used also detects Cyp4a10 and Cyp4a12. 4–6 mice in each experimental group were analyzed (3 sections from each animal). Representative images are shown. Bar: 200 μm.
Figure 8
Figure 8
Altered KC number in Epac1−/− and Epac2−/− mice. The number of (a) PDGFβ-positive stellate cells and (b) F4/80-positive KCs was determined in the livers of wt, Epac1−/−, Epac2−/− and Epac1/2−/− mice pre- and 36 h post-PH. Two-way ANOVA with Tukey’s adjustment for multiple comparisons was used to determine statistical differences between genotypes within each time point. n = 4–6 mice per group, *p < 0.05, **p < 0.01, and ****p < 0.0001. F-statistics: (a) F(3,16) = 2.670, p = 0.0836 and (b) F(3,15) = 6.630, p = 0.0045.

Similar articles

Cited by

References

    1. Berthet J, Rall TW, Sutherland EW. The relationship of epinephrine and glucagon to liver phosphorylase. IV. Effect of epinephrine and glucagon on the reactivation of phosphorylase in liver homogenates. The Journal of biological chemistry. 1957;224:463–475. - PubMed
    1. Rui L. Energy metabolism in the liver. Comprehensive Physiology. 2014;4:177–197. doi: 10.1002/cphy.c130024. - DOI - PMC - PubMed
    1. Servillo G, Della Fazia MA, Sassone-Corsi P. Transcription factor CREM coordinates the timing of hepatocyte proliferation in the regenerating liver. Genes Dev. 1998;12:3639–3643. doi: 10.1101/gad.12.23.3639. - DOI - PMC - PubMed
    1. Sequera C, Manzano S, Guerrero C, Porras A. How Rap and its GEFs control liver physiology and cancer development. C3G alterations in human hepatocarcinoma. Hepat Oncol. 2018;5:HEP05. doi: 10.2217/hep-2017-0026. - DOI - PMC - PubMed
    1. de Rooij J, et al. Epac is a Rap1 guanine-nucleotide-exchange factor directly activated by cyclic AMP. Nature. 1998;396:474–477. doi: 10.1038/24884. - DOI - PubMed

Publication types

Substances