. 2019 Sep 24;9(1):13768.
doi: 10.1038/s41598-019-50336-4.

Bone loss caused by dopaminergic degeneration and levodopa treatment in Parkinson's disease model mice

Affiliations

Bone loss caused by dopaminergic degeneration and levodopa treatment in Parkinson's disease model mice

Kazuaki Handa et al. Sci Rep. .

Abstract

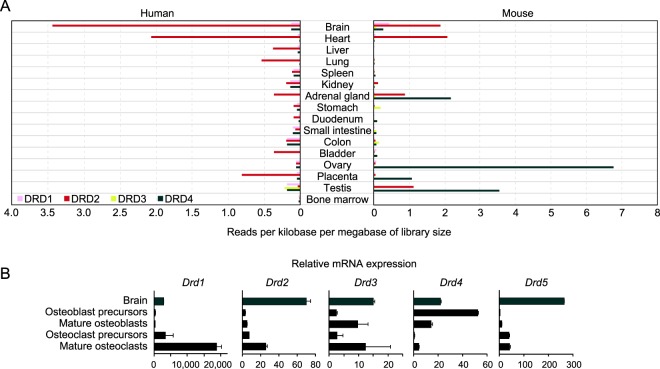
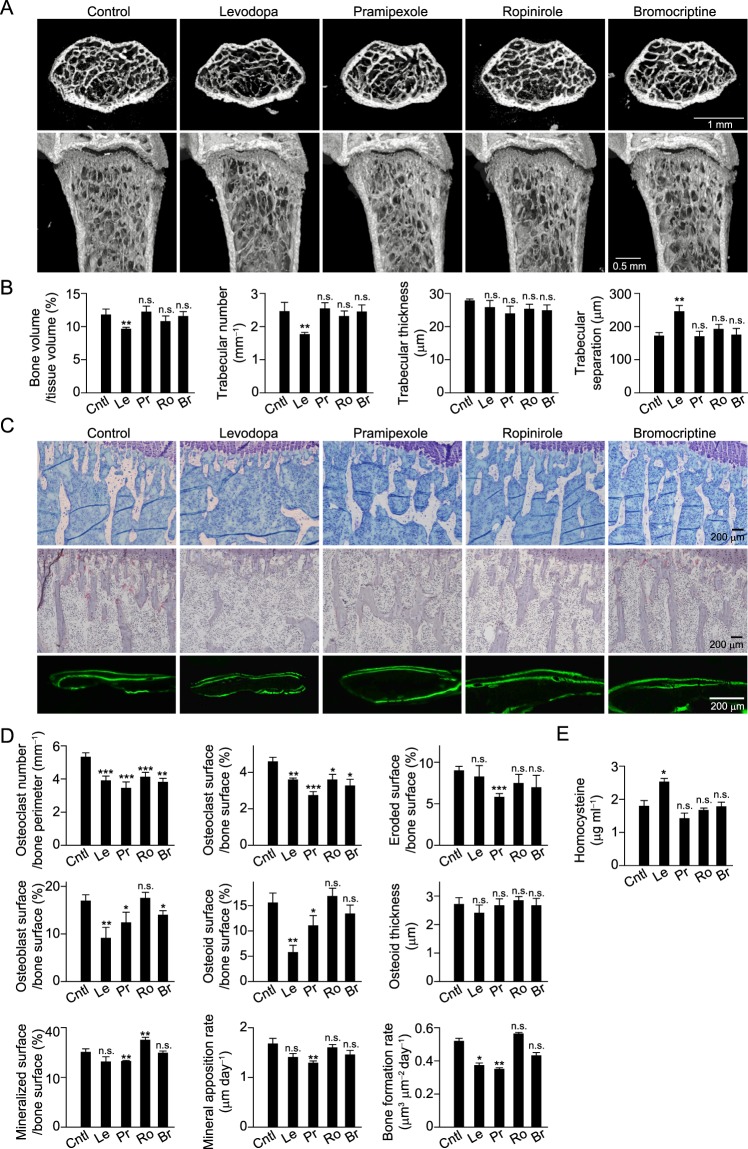
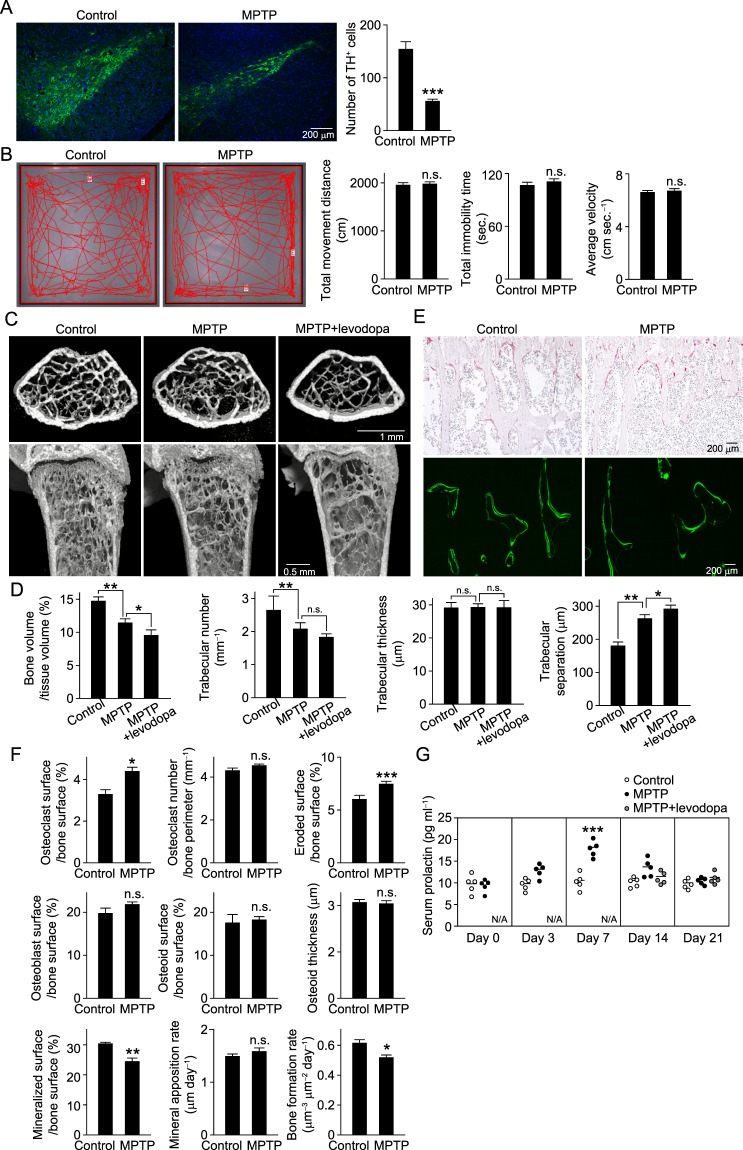
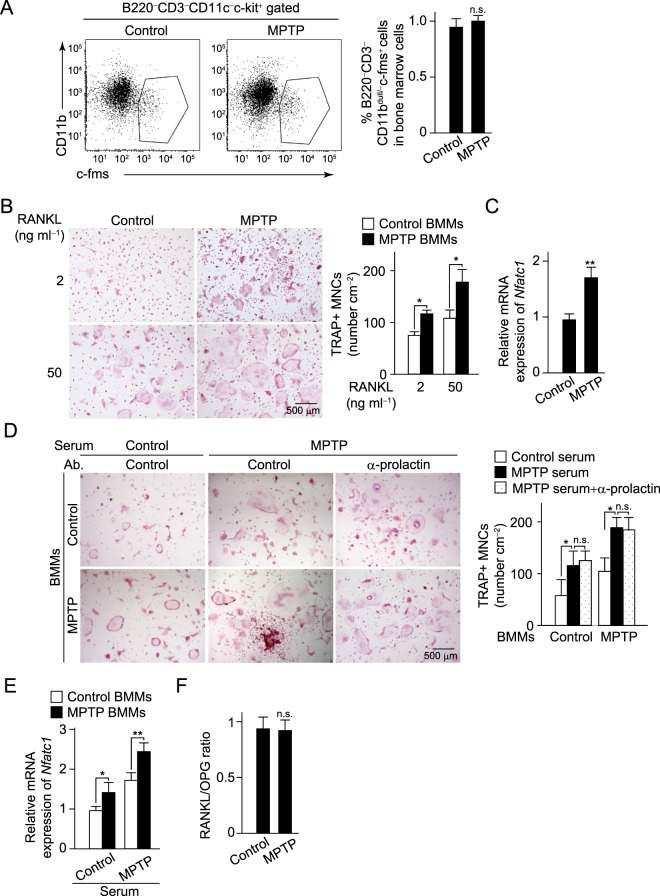
Accumulating evidence have shown the association of Parkinson's disease (PD) with osteoporosis. Bone loss in PD patients, considered to be multifactorial and a result of motor disfunction, is a hallmark symptom that causes immobility and decreased muscle strength, as well as malnutrition and medication. However, no known experimental evidence has been presented showing deleterious effects of anti-PD drugs on bone or involvement of dopaminergic degeneration in bone metabolism. Here, we show that osteoporosis associated with PD is caused by dopaminergic degeneration itself, with no deficit of motor activity, as well as treatment with levodopa, the current gold-standard medication for affected patients. Our findings show that neurotoxin-induced dopaminergic degeneration resulted in bone loss due to accelerated osteoclastogenesis and suppressed bone formation, which was associated with elevated prolactin. On the other hand, using an experimental model of postmenopausal osteoporosis, dopaminergic degeneration did not result in exacerbation of bone loss due to estrogen deficiency, but rather reduction of bone loss. Thus, this study provides evidence for the regulation of bone metabolism by the dopaminergic system through both gonadal steroid hormone-dependent and -independent functions, leading to possible early detection of osteoporosis development in individuals with PD.


Conflict of interest statement

The authors declare no competing interests.

Figures

Figure 1
Figure 1
Expression profile of dopamine receptors in human and mouse. (A) RNA profiling data sets based on the RNA-seq analyses for dopamine receptors, including dopamine receptor 1 (Drd1), Drd2, Drd3 and Drd4, published in BioProject at NCBI (Accession numbers: human, PRJEB4337; mouse, PRJNA66167). (B) mRNA expression of dopamine receptors in mouse calvarial cells and BMMs during osteoblast and osteoclast differentiation, respectively. Data shown were obtained from triplicate experiments.
Figure 2
Figure 2
In vitro effects of anti-parkinsonian drugs on osteoclasts and osteoblasts. (A) Effects of anti-parkinsonian drugs levodopa (Le), pramipexole (Pr), ropinirole (Ro), and bromocriptine (Br) on proliferation of osteoclast precursor cells (BrdU incorporation assay). Color bars indicate concentrations presented in (C). Dotted bars indicate 25, 2.5, 62.5, and 6.25 μg ml−1 for Le, Pr, Ro, and Br, respectively. (B) Inhibitory effects of anti-parkinsonian drugs on osteoclastogenesis. Le, 12.5 μg ml−1; Pr, 1.25 μg ml−1; Ro, 31.3 μg ml−1; Br, 3.13 μg ml−1. Representative images obtained from more than three independent experiments are shown. (C) Quantification of osteoclastogenesis shown in (B). (D) Effects of anti-parkinsonian drugs on expressions of essential transcription factors NFATc1 and osteoclastic marker genes including Ctsk and Oscar. For B–D, n = 8. (E) Effects of anti-parkinsonian drugs on proliferation of osteoblast precursor cells. Black, gray, and dotted bars indicate drug concentrations, as follows: Le: 1, 10, 100 μg ml−1; Pr: 5, 10, 50 μg ml−1; Ro: 10, 50, 100 μg ml−1; Br: 1, 10, 20 μg ml−1. (F) Effects of anti-parkinsonian drugs on osteoblast differentiation (left upper and middle; ALP activity) and bone nodule formation (left lower and right; Alizarin Red S staining). Representative images obtained from more than three independent experiments are shown. (G) Effects of anti-parkinsonian drugs on expressions of early osteoblastic marker gene ALP (Alpl) and essential transcription factors Runx2 and Osterix (Sp7). (H) Effects of anti-parkinsonian drugs on expressions of late osteoblastic marker genes including type I collagen (Col1a1), osteocalcine (Bglap) and bone sialoprotein (Ibsp). For E–G, n = 8, levodopa, 10 μg ml−1; pramipexole, 2.5 μg ml−1; ropinirol, 10 μg ml−1; bromocriptine, 4 μg ml−1. All data were obtained from triplicate experiments and values are shown as the mean ± s.e.m. Statistical analyses were performed using Student’s t-test (C) or ANOVA with Dunnett’s multiple-comparison test (B,EG). *P < 0.05; **P < 0.01; ***P < 0.001; n.s., not significant.
Figure 3
Figure 3
In vivo effects of anti-parkinsonian drugs on bone metabolism. (A) Representative μ-computed tomography (μCT) images of distal femurs of mice injected daily with saline (control, n = 8), levodopa (n = 6), pramipexole (n = 8), ropinirole (n = 9) or bromocriptine (n = 8) (upper, axial view of metaphyseal region; lower, longitudinal view). (B) Bone volume, trabecular number, trabecular thickness and degree of trabecular separation were determined by μCT analysis. (C) Bone histomorphometric analyses of tibiae obtained from control and anti-parkinsonian drug-injected mice. Representative images are shown. (D) Parameters for osteoclastic bone resorption and osteoblastic bone formation, as determined by bone morphometric analyses. (E) Serum level of homocysteine in control and anti-parkinsonian drug-injected mice determined by ELISA (n = 6). Statistical analyses were performed using ANOVA with Dunnett’s multiple-comparison test. *P < 0.05; **P < 0.01; ***P < 0.001; n.s., not significant. Error bars represent ± s.e.m.
Figure 4
Figure 4
Degeneration of dopaminergic neurons reduces bone mass. (A) Images of dopaminergic neurons positive for tyrosine hydroxylase (TH) in substantia nigra par compacta (SNpc) of control and MPTP-injected mice (left). Representative data are shown (control, n = 10; MPTP-injected, n = 10). Green: TH, blue: nuclei. Number of TH-positive neurons in SNpc (right). (B) Open field test results of control (n = 11) and MPTP-injected (n = 11) mice. Left image: moving traces of control and MPTP-injected mice during a 5-minute trial. Representative data are shown. Right: parameters, total movement distance, total immobility time, and average velocity were determined using an open-field test. (C) μCT images of distal femurs obtained from mice at 2 weeks after injection of saline (control, n = 8), MPTP (n = 6) or MPTP+levodopa (n = 8) (upper, axial view of metaphyseal region; lower, longitudinal view). Representative data are shown. (D) Bone volume, trabecular number, trabecular thickness and degree of trabecular separation were determined by μCT analysis. (E) Bone histomorphometric analyses of tibiae obtained from mice at 2 weeks after injection of saline (control, n = 8) or MPTP (n = 6). Upper; TRAP-staining image. Lower; Calcein double-labelled image. Representative data are shown. (F) Parameters for osteoclastic bone resorption and osteoblastic bone formation, as determined by bone morphometric analyses (control, n = 8; MPTP, n = 6). (G) Serum level of prolactin in control and anti-parkinsonian drug-injected mice determined by ELISA (control, n = 8; MPTP, n = 8). Statistical analyses were performed using Student’s t-test (A, B, F) or ANOVA with Dunnett’s multiple-comparison test (D). *P < 0.05; **P < 0.01; ***P < 0.001; n.s., not significant; N/A, not applicable. Error bars represent ± s.e.m.
Figure 5
Figure 5
Dopaminergic neurons suppress osteoclastogenesis. (A) The percentage of osteoclast precursor cells, characterized by the expression of the cell surface markers c-kit and c-fms, together with the absence or dull expression of CD11b, in bone marrow of control and MPTP-injected mice. Representative data (left) and quantification (right, control, n = 8; MPTP, n = 8) are shown. (B) Osteoclast differentiation of BMMs obtained from control and MPTP-injected mice. Left: representative images obtained from more than three independent experiments. Right: quantification of TRAP+ multinuclear osteoclasts (MNC) (control, n = 6; MPTP, n = 6). (C) mRNA expression of NFATc1 of cells obtained from control and MPTP-injected mice 2 days after RANKL stimulation (control, n = 8; MPTP, n = 8). (D) Osteoclast differentiation in presence of 2% serum obtained from control and MPTP-injected mice and the effect of anti-prolactin neutralizing antibody in the presence of MPTP serum (left). Left: representative images obtained more than three independent experiments. Right: quantification of TRAP+ MNC (control, n = 6; MPTP, n = 6; MPTP+anti-prolactin Ab, n = 6). (E) mRNA expression of NFATc1 of cells 2 days after RANKL stimulation in the presence of mouse serum (control, n = 8; MPTP, n = 8). (F) Ratio of RANKL/OPG in serum from control and MPTP-injected mice (control, n = 8; MPTP, n = 8). Statistical analyses were performed using Student’s t-test (AC, E,F) or ANOVA with Dunnett’s multiple-comparison test (D). *P < 0.05; **P < 0.01; n.s., not significant. Error bars represent ± s.e.m.
Figure 6
Figure 6
Dopaminergic neurons suppress osteoblastic bone formation. (A) Generation of alkaline phosphatase (ALP)-positive colony-forming units (CFU-ALP) and alizarin-red positive CFU (CFU-Ob) in the bone marrow cells obtained from control and MPTP-injected mice. Left: representative images obtained from more than three independent experiments. Right: quantification of ALP activity and bone nodule formation determined by alizarin red staining (control, n = 8; MPTP, n = 8). (B) The percentage of osteoblast progenitors characterized by the cell surface markers Sca-1 and PDGFRα, together with the absence of CD45 and Ter119, in bone marrow of control and MPTP-injected mice. Representative data (left) and quantification (right, control, n = 8; MPTP, n = 8) are shown. (C) Generation of CFU-ALP and CFU-Ob in the bone marrow cells in the presence of 2% serum obtained from control and MPTP-injected mice and the effect of anti-prolactin neutralizing antibody in the presence of MPTP serum (upper). Upper: representative images obtained from more than three independent experiments. Bottom: quantification of ALP activity and bone nodule formation determined by alizarin red staining (control, n = 8; MPTP, n = 8; MPTP+anti-prolactin Ab, n = 6). Statistical analyses were performed using Student’s t-test (A,B) ANOVA with Dunnett’s multiple-comparison test (C). *P < 0.05; **P < 0.01; n.s., not significant. Error bars represent ± s.e.m.
Figure 7
Figure 7
Ovariectomy (OVX)-induced bone loss moderated by degeneration of dopaminergic neurons. (A) μCT images of distal femurs obtained from sham-operated and OVX mice at 1 day after saline (control: sham, n = 10; OVX, n = 8) or MPTP injection (sham, n = 4; OVX, n = 10) (upper, axial view of metaphyseal region; lower, longitudinal view). Representative are shown. (B) Bone volume, trabecular number, trabecular thickness and degree of trabecular separation were determined by μCT analysis. (C) Bone histomorphometric analyses of tibiae obtained from sham-operated and OVX mice after saline (control: sham, n = 10; OVX, n = 8) or MPTP injection (sham, n = 4; OVX, n = 10). Representative data are shown. (D) Parameters for osteoclastic bone resorption and osteoblastic bone formation, as determined by bone morphometric analyses (control: sham, n = 10; OVX, n = 8, MPTP: sham, n = 4; OVX, n = 10). Statistical analyses were performed using ANOVA with Dunnett’s multiple-comparison test. *P < 0.05; **P < 0.01; ***P < 0.001; n.s., not significant. Error bars represent ± s.e.m.

Similar articles

Cited by

References

    1. Seeman E, Delmas PD. Bone quality–the material and structural basis of bone strength and fragility. N. Engl. J. Med. 2006;354:2250–2261. doi: 10.1056/NEJMra053077. - DOI - PubMed
    1. Okamoto K, et al. Osteoimmunology: The Conceptual Framework Unifying the Immune and Skeletal Systems. Physiol. Rev. 2017;97:1295–1349. doi: 10.1152/physrev.00036.2016. - DOI - PubMed
    1. Negishi-Koga T, Takayanagi H. Bone cell communication factors and Semaphorins. Bonekey Rep. 2012;19:183. doi: 10.1038/bonekey.2012.183. - DOI - PMC - PubMed
    1. Elefteriou F. Regulation of bone remodeling by the central and peripheral nervous system. Arch. Biochem. Biophys. 2008;473:231–236. doi: 10.1016/j.abb.2008.03.016. - DOI - PMC - PubMed
    1. Kalia LV, Lang AE. Parkinson’s disease. Lancet. 2015;386:896–912. doi: 10.1016/S0140-6736(14)61393-3. - DOI - PubMed

Publication types

MeSH terms