. 2019 Oct;22(10):1635-1648.
doi: 10.1038/s41593-019-0486-0. Epub 2019 Sep 23.

Fragmented mitochondria released from microglia trigger A1 astrocytic response and propagate inflammatory neurodegeneration

Affiliations

Fragmented mitochondria released from microglia trigger A1 astrocytic response and propagate inflammatory neurodegeneration

Amit U Joshi et al. Nat Neurosci. 2019 Oct.

Erratum in

Abstract

In neurodegenerative diseases, debris of dead neurons are thought to trigger glia-mediated neuroinflammation, thus increasing neuronal death. Here we show that the expression of neurotoxic proteins associated with these diseases in microglia alone is sufficient to directly trigger death of naive neurons and to propagate neuronal death through activation of naive astrocytes to the A1 state. Injury propagation is mediated, in great part, by the release of fragmented and dysfunctional microglial mitochondria into the neuronal milieu. The amount of damaged mitochondria released from microglia relative to functional mitochondria and the consequent neuronal injury are determined by Fis1-mediated mitochondrial fragmentation within the glial cells. The propagation of the inflammatory response and neuronal cell death by extracellular dysfunctional mitochondria suggests a potential new intervention for neurodegeneration-one that inhibits mitochondrial fragmentation in microglia, thus inhibiting the release of dysfunctional mitochondria into the extracellular milieu of the brain, without affecting the release of healthy neuroprotective mitochondria.


Conflict of interest statement

Competing Interests

Patents on P110 and its utility in HD, ALS and other neurodegenerative diseases have been filed by D.M‐R and A.U.J. The other authors declare that they have no conflict of interest.

Figures

Figure 1.
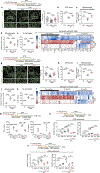
Figure 1.. Inhibition of Drp1/Fis1-mediated mitochondrial fission in vivo reduces sustained microglia and astrocytes activation and subsequent pro-inflammatory response in three models of neurodegenerative diseases in mice
(a) Age of initiation and length of sustained treatment (in months) with P110 or vehicle (Veh; dark red rectangles in the scheme) in mouse models of Alzheimer’s disease (AD; 5XFAD), Huntington’s disease (HD; R6/2) and amyotrophic lateral sclerosis (ALS; SOD1G93A). (b) Representative sections of hippocampus, striatum and spinal cord immunostained for glial fibrillary acidic protein (GFAP) and ionized calcium-binding adapter molecule 1 (Iba-1) in 5xFAD AD mice (markers of astrocytes and microglia activation, respectively), in R6/2 HD mice and SOD1 G93A ALS mice, respectively, treated with vehicle or P110, at 3 mg/kg/day for the time indicated in the red bars in (a). Representative of n = 5 mice per group; 2 sections per mouse. Immunohistochemistry of brains of the corresponding wildtype (WT) mice are provided on the left of each mouse model. Scale bar: 50 μm. Note: The tissue samples were from the mice used in our previous publications, , . (c) GFAP and (d) Iba-1 protein levels (determined by quantitating immunostaining) in the brain of each mouse model, presented as ratio to the corresponding WT mice. (e) Expression profiles for select pro- and anti-inflammation-related genes and mitochondrial biogenesis-related genes as analyzed by qPCR in the respective tissue samples. Blue and red denote upregulated and downregulated genes, respectively (n = 5 per mice, of 2 technical repeats). (f) Plasma concentrations of S100β protein, a peripheral marker of astrocyte activation and blood brain barrier integrity (n = 5 per mice group). (g-j) Protein levels of tumor necrotic factor α (TNFα), interleukin-6 (IL-6), IL-1α and IL-1β in tissue, in the respective tissue samples (n = 5 per mice group). Probability by one-way ANOVA and Benjamini, Krieger, and Yekutieli correction for multiple testing between each treatment group as above. All data are mean ± s.d.
Figure 2.
Figure 2.. Drp1/Fis1-mediated mitochondrial fragmentation and dysfunction are required to induce microglial inflammatory response in a model of HD (induced by cytotoxic poly glutamine chain, Q73) or LPS activation, in culture.
(a) Protocol of treatment for panels a-h (top) and representative photomicrographs of rat BV2 microglia, transiently expressing 23 poly glutamine repeats (Q23; control) or Q73 (HD model) for 48 hours, then treated with vehicle or P110 (1 μM/added once 24 hours after transfection in serum and antibiotic free DMEM and their mitochondria stained with anti-TOM20 (pseudo-color in yellow – for microglia); after 24 hours. Mitochondrial aspect ratio was quantified using a macro in Fiji (ImageJ) (b) Intracellular ATP levels and mitochondrial ROS levels quantified after 16 hours. (c) Levels of inflammasome components, nucleotide-binding oligomerization domain, leucine rich repeat and pyrin domain-containing 3 (NLRP3) and apoptosis-associated speck-like protein containing a CARD (ASC), present in mitochondrial fractions of Q23 and Q73 expressing BV2 microglia after 24 hours. (d) Total cellular ROS levels were quantified after 24 hours. (e) Oxidative phosphorylation (OXPHOS) and glycolysis rate (using Seahorse) measured in BV2 mouse microglia cell line transiently expressing Q23 or Q73 for 48 hours (HD model) and treated without or with P110 (1 μM every 24 hours) (f) TNFα and Il-1β levels in cell supernatants from Q23- or Q73-expressing BV2 microglia, treated as in (a) after 24 hours. (g) Mitochondria-associated Drp1 levels in the above BV2 cells, as a measure of Drp1 activation and (h) Drp1 phosphorylation levels at S616-Drp1 (a phosphorylation site correlating with Drp1 activation) or -S637-Drp1 (a site correlating with Drp1 inhibition) in Q23- or Q73-expressing BV2 microglia, treated as in (a) after 24 hours. (i) Above, the protocol of treatment for panels i-k and intracellular ATP levels in primary microglia from R6/2 or WT mice cultured and then treated with vehicle or P110 (1 μM) and stimulated without or with LPS (10ng/ml) for 24 hours in serum and antibiotic free DMEM. (j) Mitochondrial ROS levels and total ROS levels quantified in R6/2 or WT primary mouse microglia treated as in (i). (k) Levels of released TNFα and IL-1β into the culture media of primary mouse microglia cells treated as in (i). (l) Protocol of treatment for panels l-o (top) and photomicrographs of primary rat microglia primed with LPS (10ng//ml) for 3 hours followed by nigericin (1.2 μM)-treatment (LPS/Nig) in the presence or absence of P110 (1 μM, added 30 minutes prior to LPS) treated for 21 hours in serum and antibiotic free DMEM and mitochondrial aspect ratio was quantified. (m) Markers of microglial mitochondrial health including intracellular ATP levels, mitochondrial ROS levels, OXPHOS, rate of glycolysis, spare respiratory capacity and mitochondrial membrane potential were determined in these control or LPS-primed nigericin-treated microglia. (n) Levels of TNFα and IL-1 α in culture media, and C1q RNA levels in these controls or LPS-primed nigericin-treated primary rat microglia in the absence or presence of P110. (o) Nuclear translocation of Nuclear factor kappa-light-chain-enhancer of activated B cells (NFκB) in primary rat microglia, treated as in (l). Values underneath are fold change of NFκB staining. Probability was calculated by one‐way ANOVA (with Tukey’s post hoc test). All graphs represent mean ± s.d. Scale bar in a, l is 5 μm and in o is 50 μm. All experiments were performed in biologically independent replicates. a: n=3, each point indicates single mitochondria; b: n=7 (ATP), n=9 (MitoSOX); c: n=5 (NLRP3), n=4 (ASC); d-e: n=4; f: n=5; g: n=8; h: n=3; i-j: n=5; k: n=6 (TNFα), n=5 (IL-1β); l: n=3, each point indicates single mitochondria; m: n=4 (ATP), n=12 (MitoSOX), n=4 (OXHPHOS, Glycolysis, Spare Capacity), n=20 (TMRM); n: n=6; o: n=3.
Figure 3.
Figure 3.. Drp1/Fis1-mediated mitochondrial fragmentation and dysfunction are required to induce microglial inflammatory response in a model of ALS (by expressing cytotoxic SOD G93A) or in a model of AD (induced by treatment with oAβ1–42), in culture.
(a) Protocol of treatment for panels a-e (top) and representative photomicrographs (provided in pseudo-color in yellow, for microglia) and mitochondrial aspects in BV2 mouse microglia cell line transiently expressing human WT SOD1 (WT) or SOD1 G93A mutant (as an ALS model) for 48 hours treated as indicated. Intracellular ATP (b), ROS levels (c), and (d) mitochondrial oxygen consumption rate (OCR) and extracellular acidification rate (ECAR), measures of mitochondrial OXPHOS capacity and glycolysis, as determined using Seahorse, in BV2 expressing WT or mutant SOD1, as an ALS model after 24 hours in serum and antibiotic free DMEM. (e) Levels of released TNFα and IL-1β the culture media of the BV2 cells treated as in (a) were determined. (f) Protocol of treatment for panels f-k (top) and representative photomicrographs (pseudo-color in yellow, for microglia) and mitochondrial aspects of BV2 microglia treated with or without oligomeric Aβ42 (oAβ42) (1 μM) for 24 hours in the presence/absence of P110 (1 μM added once together with oAβ42) in serum and antibiotic free DMEM as a model of AD. Intracellular ATP (g), ROS levels (h), and (i) metabolic health in BV2 microglia treated with or without oAβ42; 1μM) for 24 hrs in defined medium in the presence or absence of P110 (1 μM, added 15 minutes prior to oAβ42). (j) Levels of released TNFα and IL-1β the culture media of cells treated as in (f) were determined. (k) Mitochondrial Drp1 levels and NLRP3 levels in BV2 microglia, treated with or without oligomeric oAβ42 (1 μM) for 24 hours in the presence/absence of P110 (1 μM added once together with oAβ42) in serum and antibiotic free DMEM, as a model of AD. Probability was calculated by one‐way ANOVA (with Tukey’s post hoc test). All graphs represent mean ± s.d. Scale bar: 5 μm. All experiments were performed in biologically independent replicates. a: n=3, each point indicates single mitochondria; b: n=3 c: n=7 (MitoSOX), n=4 (Total ROS); d: n=4; e: n=5; f: n=3, each point indicates single mitochondria; g: n=3; h: n=4; i: n=4 (OXPHOS), n=5 (Glycolysis); j: n=5; k: n=3.
Figure 4.
Figure 4.. Conditioned media of activated microglia with mitochondrial dysfunction propagate astrocyte activation to A1 pro-inflammatory state and dysfunction of mitochondria in cultured astrocytes, using multiple models of neurodegenerative diseases.
(a) Protocol of the experiment in panels a-f (top) and representative photomicrographs of mouse primary astrocytes treated with conditioned media from activated BV2 microglia (referred to microglial conditioned media or MCM from here on) expressing a non-pathological poly-glutamine repeats, Q23 (control), or a pathological poly-glutamine repeats, Q73 (for 48 hrs; HD model) and treated with vehicle or P110 for 24 hrs. The MCM was added to astrocytes for 24 hours and astrocytes were then stained with anti-TOM20 (provided in pseudo-color green, for astrocytes) and mitochondrial aspect was determined as in (Fig. 1c). (b) Intracellular ATP levels in astrocytes were determined after 24 hours incubation with MCM, and (c) mitochondrial membrane potential and (d) mitochondrial ROS levels were determined at 6 hours after MCM treatments of the astrocytes. (e) LDH release from the astrocytes was measured 48 hours after MCM treatments. (f) Heat map of RNA transcripts in the astrocytes 24 hours after MCM treatments. (g) Protocol of the experiment in panels g-l (top) and representative photomicrographs of mouse primary astrocytes (pseudo-color in green) treated for 12 hours with supernatant from BV2 microglia, expressing SOD1WT or SOD1G93A (MCM). The astrocytes were then stained with anti-TOM20 and mitochondrial aspect was determined as in (Fig. 1c). (h) Intracellular ATP levels at 24 hours, (i) mitochondrial membrane potential, using TMRM, and (j) mitochondrial ROS levels, using MitoSOX, were determined 6 hours after initiation of treatment with MCM. (k) LDH release measured 48 hours after MCM treatment. (l) Heat map of RNA transcripts of primary astrocytes primed by treatment with MCM. (m) Levels of released TNFα and IL-1β the culture media of cells treated as in (a and g) were determined. (n) Protocol of the experiment and mitochondrial ROS levels and total ROS levels were measured in primary astrocytes isolated from WT mice were treated with supernatant from WT/R6/2 mouse microglia, as in Fig. 2i. (o) Protocol of the experiment and mitochondrial ROS levels and total ROS levels were measured in primary astrocytes isolated from R6/2 mice were treated with supernatant from WT/R6/2 microglia treated as in Fig. 2i. Data were evaluated by one-way ANOVA and Holm-Sidak’s multiple comparisons test for multiple testing between each treatment group. All graphs represent mean ± s.d. Scale bar: 20 μm. Note that P110 treatment in the studies shown here and in Figs. 4–6 was restricted to the microglia. As the half-life of the peptide is >30 minutes, no peptide remained in the microglial conditioned media to directly affect the astrocytes or the neurons. All experiments were performed in biologically independent replicates. a: n=3, each point indicates single mitochondria; b: n=3; c-d: n=5; e: n=3; f: n=2; g: n=3, each point indicates single mitochondria; h: n=4; i-j: n=4; k: n=4; l: n=2; m: n=5; n: n=6; o: n=5.
Figure 5:
Figure 5:. Mitochondrial excessive fission and dysfunction in activated astrocytes
(a) Schematic of the experimental design using primary mouse astrocytes treated with conditioned media of LPS/Nigericin-activated mouse primary microglia (MCM) (top). Representative photomicrographs of primary rat astrocytes (pseudo-color in green) treated with MCM for 24 hours and then stained with anti-TOM20 and mitochondrial aspect was determined. (b) Intracellular ATP determined at 24 hours, and (c) mitochondrial membrane potential and (d) mitochondrial ROS levels determined 12 hours after MCM treatment. (e) LDH release measured 48 hours after MCM treatment. (f) Heat map of RNA transcripts in these astrocytes. (g) Schematic of the experimental design using primary rat astrocytes treated directly with combination of TNFα, Il-1α, and C1q without or with P110 or P259 (1 μM, added once, 15 minutes prior) or 20 μM Mdivi-1 (added once, 15 minutes prior) and then incubate for 24 hours in serum and antibiotic free DMEM (top). Representative photomicrographs of primary mouse astrocytes (pseudo-color in green) as in the scheme and then stained with anti-TOM20 and mitochondrial aspect was determined. (h) Intracellular ATP at 24 hours, (i) Mitochondrial membrane potential at 24 hours, (j) mitochondrial ROS at 24 hours, (k) LDH release measured at 48 hours and (l) heat map of RNA transcripts of treated rat primary astrocytes at 24 hours were determined as above. Data were evaluated by one-way ANOVA and Holm-Sidak’s multiple comparisons test for multiple testing between each treatment group. All graphs represent mean ± s.d. Scale bar: 20 μm. All experiments were performed in biologically independent replicates. a: n=3, each point indicates single mitochondria; b: n=3; c-d: n=5; e: n=4; f: n=2; g: n=3, each point indicates single mitochondria; h: n=5 (Control, Veh, P110) n=3 (P259, Mdivi-1); i: n=7 (Control, Veh, P110) n=4 (P259, Mdivi-1); j: n=6 (Control, Veh, P110) n=3 (P259, Mdivi-1); k: n=5 (Control, Veh, P110) n=3 (P259, Mdivi-1); l: n=2.
Figure 6.
Figure 6.. Dysfunctional extracellular mitochondria released from activated primary rat and mouse microglia or astrocytes or human primary monocyte-derived microglial cells in a Drp1/Fis1-specific manner.
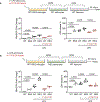
(a) Protocol of the experiment in panels a-c (top). (b) Levels of mitochondrial membrane potential and ATP in mitochondria-enriched pellet collected from cultured conditioned media of rat primary microglia, as depicted in the scheme. Extracellular mitochondria were removed from the media, using 0.2μm filters; MitoΔ. (c) Integrity of the extracellular mitochondria was analyzed for markers of outer-membrane proteins (TOM20 and VDAC) and cytochrome c, an inter-membrane space protein, that readily leaks out when outer mitochondrial membrane integrity is compromised. β-actin of the cell extracts from the corresponding plates was used as a loading control. (d) Protocol of the experiment and levels of mitochondrial membrane potential and ATP in mitochondria-enriched pellet collected from cultured conditioned media of primary microglia isolated from WT/R6/2 mice treated without or with P110 (1 μM, added once 15 minutes prior to LPS 0.5 μg/ml) and for 24 hours in serum and antibiotic free DMEM. (e) Protocol of the experiment and levels of mitochondrial membrane potential and ATP in mitochondria-enriched pellet collected from cultured conditioned media of transiently expressing Q23/Q73 (control and a HD model, respectively) or human WT SOD1 or SOD1 G93A mutant (control and an ALS model, respectively) for 48 hours treated without or with P110 (1 μM). (f) Protocol of the experiment for panels, levels of mitochondrial membrane potential and ATP in mitochondrial pellet collected from cultured conditioned media of model of human microglia. Extracellular mitochondria were removed from the media, using 0.2-μm filters; MitoΔ, as in (a). (g) Membrane potential and ATP levels of the extracellular mitochondria released from rat primary astrocytes treated with rat microglial conditioned media. Extracellular mitochondria were removed from the media, using 0.2-μm filters; MitoΔ. (h) The integrity of the extracellular astrocytic mitochondria was analyzed as in (c). Extracellular mitochondria were removed from the media, using 0.2-μm filters; MitoΔ. (i) The morphology and structural organization of the extracellular mitochondria were examined in electron microscope micrographs of pelleted mitochondria from the conditioned media of astrocytes. Scale bar: 200–500 nm, as indicated. (j) Protocol and membrane potential of the extracellular mitochondria released from primary rat astrocytes treated with as in Fig 5a; in addition to the Drp1/Fis1-selective inhibitor, cells were also treated with P259, a Mff/Drp1-selective inhibitor (1μM) or with Mdivi-1 (20 μM), a Drp1 GTPase inhibitor. (k) The integrity of the extracellular mitochondria was analyzed as in (c) and represented as a ratio to β-actin in total lysate. Extracellular mitochondria were removed from the media, using 0.2-μm filters; MitoΔ, as in (a). Data were evaluated by one-way ANOVA and Holm-Sidak’s multiple comparisons test for multiple testing between each treatment group. All graphs represent mean ± s.d. All experiments were performed in biologically independent replicates. b: n=12; c: n=3; d: n=9; e: n=7; f: n=13 (JC-1), n=7 (ATP); g: n=13 (JC-1), n=9 (ATP); h: n=3; i: n=2; j-k: n=3.
Figure 7.
Figure 7.. Propagation of mitochondrial dysfunction and cell death from activated microglia to neurons through astrocytes, by the released (extracellular) glial mitochondria.
(a) Schematic of the experimental design. (b) ATP levels, mitochondrial membrane potential using TMRM, mitochondrial ROS using MitoSOX, OCR measurement for OXPHOS, spare respiratory capacity and maximal respiration using seahorse, in rat primary cortical neurons treated with activated astrocyte conditioned medium (aACM; as in Supplementary Fig. 3a) that were activated by media from microglia treated as indicated by LPS/nigericin in the presence or absence of P110 (1 μM). Extracellular mitochondria from the microglial conditioned media were removed prior to transferring the microglial-conditioned media to the astrocytes, using 0.2-μm filters; MitoΔ. OCR, TMRM and MitoSOX were measured at 24 hrs. (c) Oxygen consumption of mouse primary neurons 24 hour after exposure to conditioned medium of astrocytes (ACM) that were treated with conditioned media of BV2 microglia, expressing Q73, or SOD1 G93A, or the corresponding controls; in the absence or presence of P110. (d) Scheme of the experimental protocol (top) and LDH release (a marker of neuronal cell death) from primary cortical rat neurons treated with rat activated ACM (aACM) and the consequence of removal of extracellular mitochondria (filtration through 0.2-μm filters; MitoΔ) released from the astrocytes, or removal of extracellular DNA released from the aACM (using DNase). (e) Scheme of the experimental protocol (top) and rat neuronal cell death (LDH release) induced by transferring of enriched preparation of extracellular mitochondria isolated from primary rat aACM that were treated by conditioned media (MCM) of primary rat microglia treated with LPS/Nig together with or without P110. Data were evaluated by one-way ANOVA and Holm-Sidak’s multiple comparisons test for multiple testing between each treatment group. All graphs represent mean ± s.d. All experiments were performed in biologically independent replicates. b: n=7 (naïve), n=10 (activated ACM) (ATP), n=14 (naïve), n=12 (activated ACM) (TMRM, MitoSOX), n=9 (Seahorse); c: n=6; d: n=13; e: n=9.
Figure 8.
Figure 8.. Drp1/Fis1-dependent propagation of neuronal mitochondrial dysfunction and neuronal cell death from R6/2 microglia to naïve mouse cortical neurons through WT or R6/2 astrocytes.
(a) Schematic of the experimental design using primary microglia (treated without or with LPS) that were isolated from R6/2 mice or their littermate WT mice. Mitochondrial ROS and LDH release in mouse primary cortical neurons treated with activated astrocyte conditioned medium (aACM) from WT mouse astrocytes. (b) The treatment protocol is as in (a), except that, in addition to the microglia, the primary astrocytes used were isolated from R6/2 mice, or the WT littermates, as indicated. All graphs represent mean ± s.d. Data were evaluated by one-way ANOVA and Holm-Sidak's multiple comparisons test. All experiments were performed in biologically independent replicates. a: n=5 (MitoSOX), n=4 (LDH); b: n=5.

References

    1. Aguzzi A & O’Connor T Protein aggregation diseases: pathogenicity and therapeutic perspectives. Nat Rev Drug Discov 9, 237–248 (2010). - PubMed
    1. Hayakawa K, et al. Transfer of mitochondria from astrocytes to neurons after stroke. Nature 535, 551–555 (2016). - PMC - PubMed
    1. Belanger M & Magistretti PJ The role of astroglia in neuroprotection. Dialogues Clin Neurosci 11, 281–295 (2009). - PMC - PubMed
    1. Chen Z & Trapp BD Microglia and neuroprotection. J Neurochem 136 Suppl 1, 10–17 (2016). - PubMed
    1. Crotti A & Glass CK The choreography of neuroinflammation in Huntington’s disease. Trends Immunol 36, 364–373 (2015). - PMC - PubMed

Publication types