. 2019 Oct;22(10):1677-1686.
doi: 10.1038/s41593-019-0502-4. Epub 2019 Sep 24.

Single-trial neural dynamics are dominated by richly varied movements

Affiliations

Single-trial neural dynamics are dominated by richly varied movements

Simon Musall et al. Nat Neurosci. 2019 Oct.

Abstract

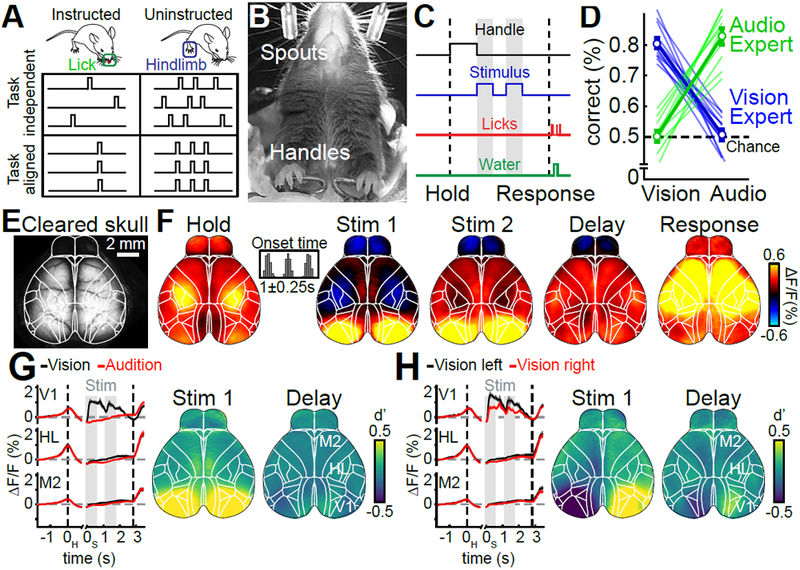
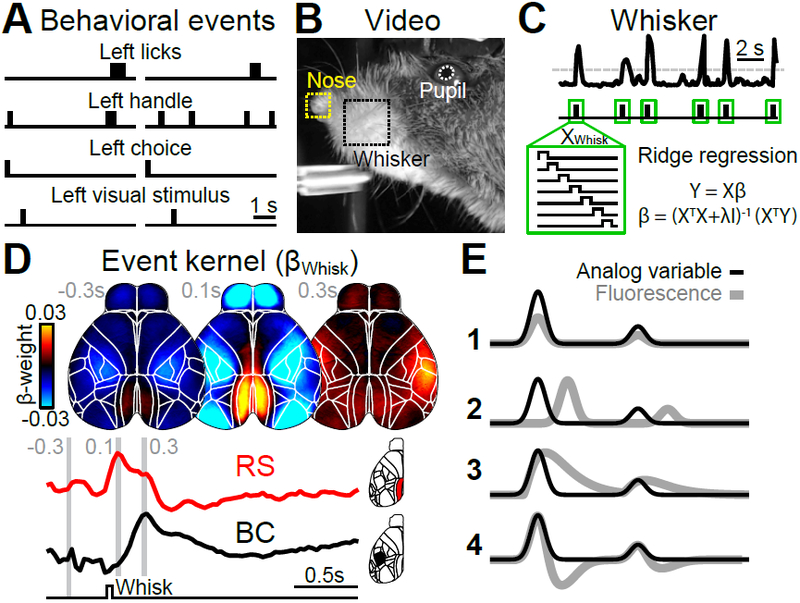
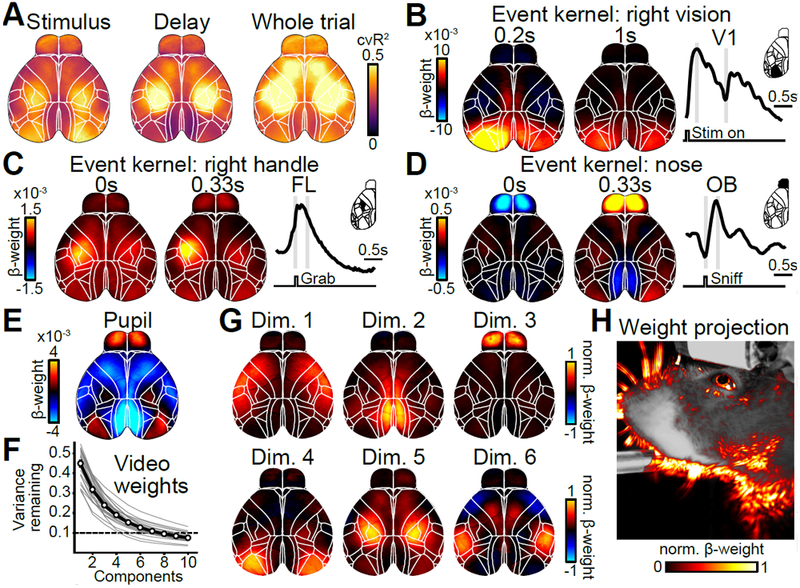
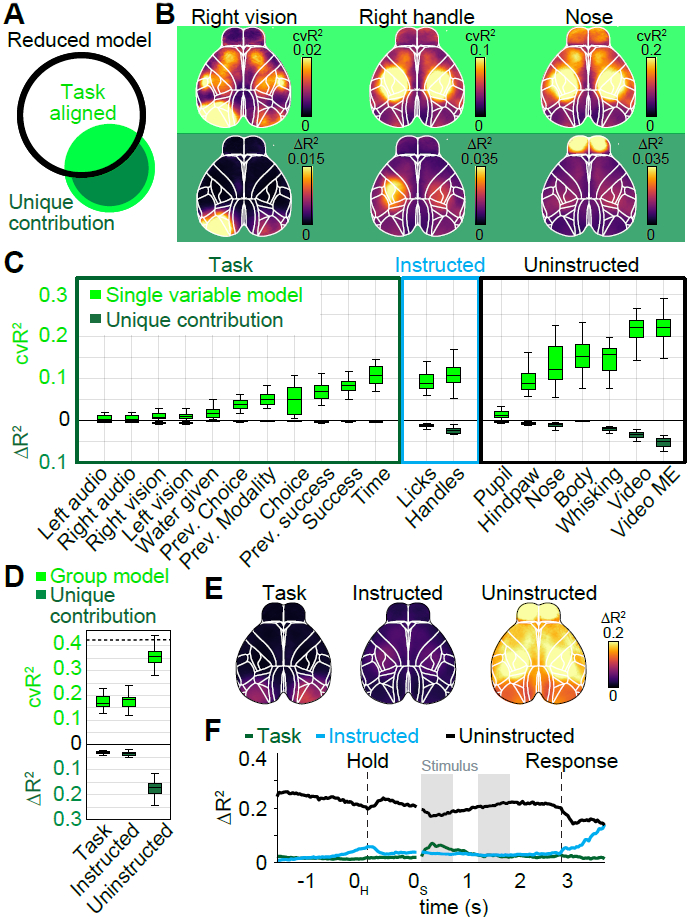
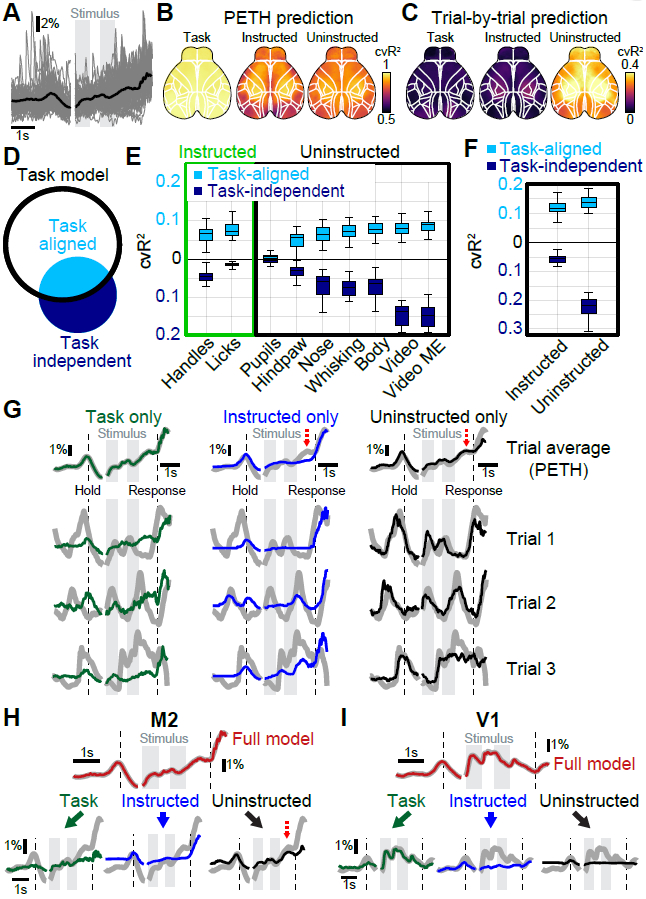
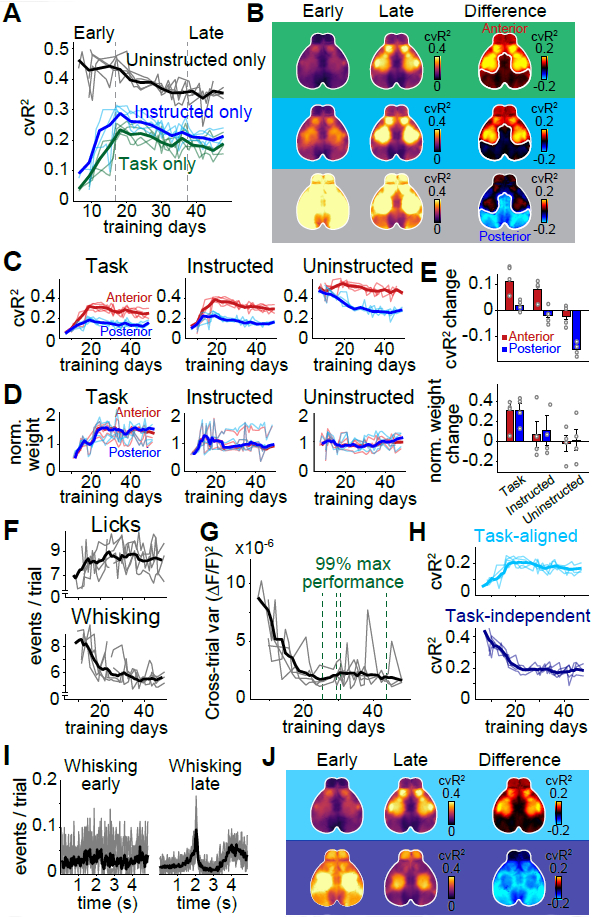
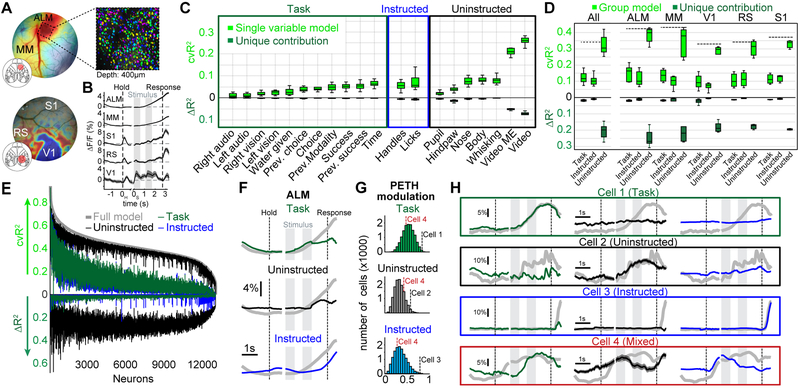
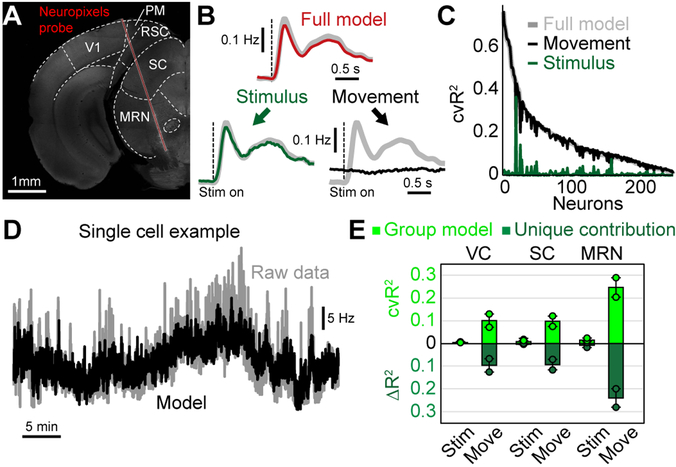
When experts are immersed in a task, do their brains prioritize task-related activity? Most efforts to understand neural activity during well-learned tasks focus on cognitive computations and task-related movements. We wondered whether task-performing animals explore a broader movement landscape and how this impacts neural activity. We characterized movements using video and other sensors and measured neural activity using widefield and two-photon imaging. Cortex-wide activity was dominated by movements, especially uninstructed movements not required for the task. Some uninstructed movements were aligned to trial events. Accounting for them revealed that neurons with similar trial-averaged activity often reflected utterly different combinations of cognitive and movement variables. Other movements occurred idiosyncratically, accounting for trial-by-trial fluctuations that are often considered 'noise'. This held true throughout task-learning and for extracellular Neuropixels recordings that included subcortical areas. Our observations argue that animals execute expert decisions while performing richly varied, uninstructed movements that profoundly shape neural activity.


Figures

Figure 1.
Figure 1.. Widefield calcium imaging during auditory and visual decision making.
(A) Schematic for the two main questions addressed in this work. Uninstructed movements are exemplified as ‘hindlimb’ but numerous movements are considered throughout this work. (B) Bottom view of a mouse in the behavioral setup. (C) Single-trial timing of behavior. Mice held the handles for 1s (±0.25s) to trigger the stimulus sequence. One second after stimulus end, water spouts moved towards the mouse so they could report a choice. (D) Visual experts (blue) had high performance with visual but chance performance with auditory stimuli. Auditory experts (green) showed the converse. Thin lines: animals, thick lines: mean. Error bars: mean±SEM; n=11 mice. (E) Example image of cortical surface after skull clearing. Overlaid white lines show Allen CCF borders. (F) Cortical activity during different task episodes. Shown are responses when holding the handles (‘Hold’), visual stimulus presentation (‘Stim 1&2'), the subsequent delay (‘Delay’) and the response period (‘Response’). In each trial, stimulus onset was pseudo-randomized within a 0.25-s long time window (inset). (G) Left: Traces show average responses in primary visual cortex (V1), hindlimb somatosensory cortex (HL) and secondary motor cortex (M2) of the right hemisphere during visual (black) or auditory (red) stimulation. Trial averages are aligned to both the time of trial initiation (left dashed line) and stimulus onset (gray bars). Right dashed line indicates response period, shading indicates SEM. Right: d’ between visual and auditory trials during first visual stimulus and the subsequent delay period. (H) Same as (G) but for correct visual trials on the left versus right side. (F-H) (n=22 sessions).
Figure 2.
Figure 2.. A linear model to reveal behavioral correlates of cortical activity.
(A) Two example trials, illustrating different classes of behavioral events. (B) Image of facial video data with 3 movement variables used in the model. (C) Absolute averaged motion energy in the whisker-pad over two trials, showing individual bouts of movement (top). Whisking events were inferred by thresholding (dashed line) and a time-shifted design matrix (XWhisk) was used to compute an event kernel (βWhisk). (D) Average βWhisk maps −0.3, 0.1 and 0.3 seconds relative to whisk onset (n=22 sessions). Whisking caused different responses across cortex, with retrosplenial (RS) being most active 0.1 seconds after whisk onset (red trace) and barrel cortex (BC) after 0.3 seconds (black trace). (E) A schematic analog variable (black) fitted to cortical activity (gray). Analog variables are linearly scaled to fit neural data instead of assuming a fixed event response structure (1). In contrast to the event kernel traces in (D), analog variables cannot account for neural responses that are shifted in time (2) or include additional response features (3-4).
Figure 3.
Figure 3.. Linear model predicts cortical activity with highly specific model variables.
(A) Maps of cross-validated explained variance for two task epochs and the whole trial. (B) Example weight maps of the event kernel for right visual stimuli, 0.2 and 1 seconds after stimulus onset. Trace on the right shows the average weights learned by the model for left V1. Gray lines indicate times of the maps on the left. (C) Same as in (B) but for the event kernel corresponding to right handle grabs, 0 and 0.33 seconds after event onset. (D) Same as in (C) but for the event kernel corresponding to nose movements in the olfactory bulb (OB). (E) Weight map for the analog pupil variable. (F) Cumulative remaining variance for PCs of model’s weight matrix for all video variables. Black line shows session average, gray line individual sessions. On average, >90% of all variance was explained by 8 dimensions (dashed line). n=22 sessions. (G) Widefield maps corresponding to the sparsened top 6 video-weight dimensions for an example session. (H) Influence of each behavioral video pixel on widefield data. The opacity and color of the overlay were scaled between the 0th and 99th percentile over all beta values.
Figure 4.
Figure 4.. Uninstructed movements dominate cortical activity.
(A) Black circle denotes information of a reduced model, lacking one variable. The single variable (green circle) has information that overlaps (light green) with the reduced model and a unique contribution (dark green) that increases the full model’s information. (B) Top row: Cross-validated explained variance (cvR2) maps for different single-variable models. Bottom row: Unique model contribution (ΔR2) maps for the same variables. (C) Explained variance for single model variables, averaged across cortical maps. Shown is either cvR2 (light green) or ΔR2 (dark green). The box shows the first and third quartiles, inner line is the median over 22 sessions, whiskers represent minimum and maximum values. Prev.: previous. (D) Explained variance for variable groups. Conventions as in (C). (E) ΔR2 map for each variable group. (F) ΔR2 for variable groups at each time-point, averaged across cortex. (B-F) (n=22 sessions).
Figure 5.
Figure 5.. Uninstructed movements make considerable task-aligned and task-independent contributions
(A) Example M2 data from a single animal. Black trace shows average over all trials, thin gray traces activity from 100 randomly selected trials. (B) Predictions of trial-average by different models that were based on a single variable group. Maps show cvR2 after averaging over all trials. (C) Predictions of trial-by-trial variability. Maps show cvR2 after averaging over all time-points within each trial. (D) Black circle denotes task-model information. A movement variable (blue circle) has information that overlaps with the task (light blue) and information that is task-independent (dark blue). (E) Explained variance for all movement variables. Shown is task-independent (dark blue) and task-aligned explained variance (light blue). Values averaged across cortex. The box shows the first and third quartiles, inner line is the median over 22 sessions, whiskers represent minimum and maximum values. (F) Task-aligned and task-independent explained variance for movement groups. Conventions as in (E). (G) M2 data (gray traces), predicted by different variable group models. PETHs (top row) are mostly well-explained by all three models. Single trials were only well predicted by uninstructed movements (right column, black). (H) The M2 PETH is accurately predicted by the full model (top trace, red). Reconstructing the data based on model weights of each variable group allows partitioning the PETH and revealing the groups’ respective contributions to the full model (bottom row). Red dashed arrow indicates an example PETH feature that is best-explained by uninstructed movements. (I) Same as in (H) but for V1 data. (A, G-H) (n=412 trials).
Figure 6.
Figure 6.. Cognitive and movement responses during learning
(A) cvR2 for uninstructed movement (black), task (green) and instructed movement (blue) models, from early to late in training (dashed lines). (B) cvR2 maps for each model, either early (left column) or late (middle column) in training. Right column shows the difference between early and late cvR2. White outlines show separation between ‘anterior’ and ‘posterior’ cortex, which behaved differently with regard to cvR2 change. (C) Changes in cvR2 for anterior (red) and posterior (blue) cortex for each model and training day. (D) Same as in (C) but for the sum of absolute weights in each model. Each model weight was normalized to the early training period. (E) Difference between early and late training data for cvR2 (top) and model weights (bottom). Error bars show the SEM. (F) Mean number of behavioral events per trial for each training day. Shown are event rates for licking (top) and whisking (bottom). (G) Trial-by-trial variance in widefield fluorescence across cortex for each training day. Green lines show the time when individual animals reached 99% of their maximum task performance. (H) Task-aligned (top) and task-independent cvR2 (bottom) for uninstructed movements. (I) PETH for whisking early versus late during training. n=10 sessions per condition from one mouse. Thin lines: sessions; thick lines: average. (J) Averaged cortical maps for task-aligned (top row) and task-independent cvR2 (bottom row). Left and middle columns show cvR2 early and late in training, right column shows their difference. Colors indicate the task-aligned contribution (top) or task independent contribution (bottom). (A-H, J) (n=4 mice, thin lines/circles: animals, thick lines/bar plots: mean).
Figure 7.
Figure 7.. Movements are important for interpreting single-neuron data.
(A) Example windows in M2 (top) and posterior cortex (bottom). Colors in top window indicate neural response strength during licking. Colors in bottom window indicate location of visual areas, based on retinotopic mapping. Top right picture shows example field-of-view in ALM with neurons colored randomly. (B) Population PETHs from different cortical areas averaged over all trials and recorded neurons. Shading indicates SEM. nALM=4571 neurons, nMM=6364 neurons, nV1=594 neurons, nRS=206 neurons, nS1=252 neurons. (C) Explained variance for single model variables. Shown is either all explained variance (light green) or unique model contribution (dark green). The box shows the first and third quartiles, inner line is the median over 10 mice, whiskers represent minimum and maximum values. Prev.: previous. (D) Explained variance for variable groups. Conventions as in (C). Left panel shows results for all areas, right panels show results for individual cortical areas. (E) Explained variance of variable groups for individual neurons, sorted by full-model performance (light gray trace). Traces above the horizontal axis reflect all explained variance and traces below show unique model contributions (similar to light and dark green bars in D). Colors indicate variable groups. (F) Partitioning of the ALM population PETH. Colors show contributions from different variable groups. Summation of all group contributions results in the original PETH (gray traces). (G) PETH modulation indices (MIs). Histograms show MIs for each variable group. Dashed lines show MI values for example cells in H. (H) PETH partitioning of single neurons. Boxes show example cells, most strongly modulated by the task (green), uninstructed movements (black), instructed movements (blue) or a combination of all three (red). Original PETHs in gray.
Figure 8.
Figure 8.. Uninstructed movements predict single-neuron activity in cortical and subcortical areas
(A) Coronal slice, −3.8 mm from bregma, showing the location of the Neuropixels probe in an example recording. We recorded activity in visual cortex (VC), superior colliculus (SC) and the midbrain reticular nucleus (MRN). (B) Population PETH averaged over all neurons and visual stimuli, n = 232 neurons. Gray traces show recorded data. Top red trace shows model reconstruction. Bottom: PETH partitioning of modeled data into stimulus (left, green trace) and movement (right, black trace) components. (C) Explained variance for all recorded neurons using either the full model (gray) or a movement- (black) or stimulus-only model (green). (D) Activity of a single example neuron over the entire session (~40 minutes). Gray trace is recorded activity, black is the cross-validated model reconstruction. (E) Explained variance for stimulus or movement variables in different brain areas. Shown is either all explained variance (light green) or unique model contribution (dark green). Bars represent the mean from 2 mice for VC, SC and MRN, respectively. Dots indicate the mean for each animal (on average 38.7 neurons per mouse and area). Error bars show the SEM.

References

    1. Shadlen MN & Newsome WT Motion perception: seeing and deciding. Proc Natl Acad Sci U S A 93, 628–633 (1996). - PMC - PubMed
    1. Maimon G & Assad JA A cognitive signal for the proactive timing of action in macaque LIP. Nat. Neurosci. 9, 948–955 (2006). - PubMed
    1. Horwitz GD, Batista AP & Newsome WT Representation of an abstract perceptual decision in macaque superior colliculus. J. Neurophysiol. 91, 2281–2296 (2004). - PubMed
    1. Gold JI & Shadlen MN The influence of behavioral context on the representation of a perceptual decision in developing oculomotor commands. J. Neurosci. 23, 632–651 (2003). - PMC - PubMed
    1. Roitman JD & Shadlen MN Response of neurons in the lateral intraparietal area during a combined visual discrimination reaction time task. J. Neurosci. 22, 9475–9489 (2002). - PMC - PubMed

Additional References

    1. Juavinett AL, Bekheet G & Churchland AK Chronically-implanted Neuropixels probes enable high yield recordings in freely moving mice. bioRxiv 406074 (2018). doi:10.1101/406074 - DOI - PMC - PubMed
    1. Ratzlaff EH & Grinvald A A tandem-lens epifluorescence macroscope: hundred-fold brightness advantage for wide-field imaging. J. Neurosci. Methods 36, 127–137 (1991). - PubMed
    1. Lerner TN et al. Intact-Brain Analyses Reveal Distinct Information Carried by SNc Dopamine Subcircuits. Cell 162, 635–647 (2015). - PMC - PubMed
    1. Pachitariu M et al. Suite2p: beyond 10,000 neurons with standard two-photon microscopy. bioRxiv 061507 (2016). doi:10.1101/061507 - DOI
    1. Jia H, Rochefort NL, Chen X & Konnerth A In vivo two-photon imaging of sensory-evoked dendritic calcium signals in cortical neurons. Nat Protoc 6, 28–35 (2011). - PubMed

Publication types