

Dynamic Orchestration of Brains and Instruments During Free Guitar Improvisation
- PMID: 31551723
- PMCID: PMC6738335
- DOI: 10.3389/fnint.2019.00050
Dynamic Orchestration of Brains and Instruments During Free Guitar Improvisation
Abstract
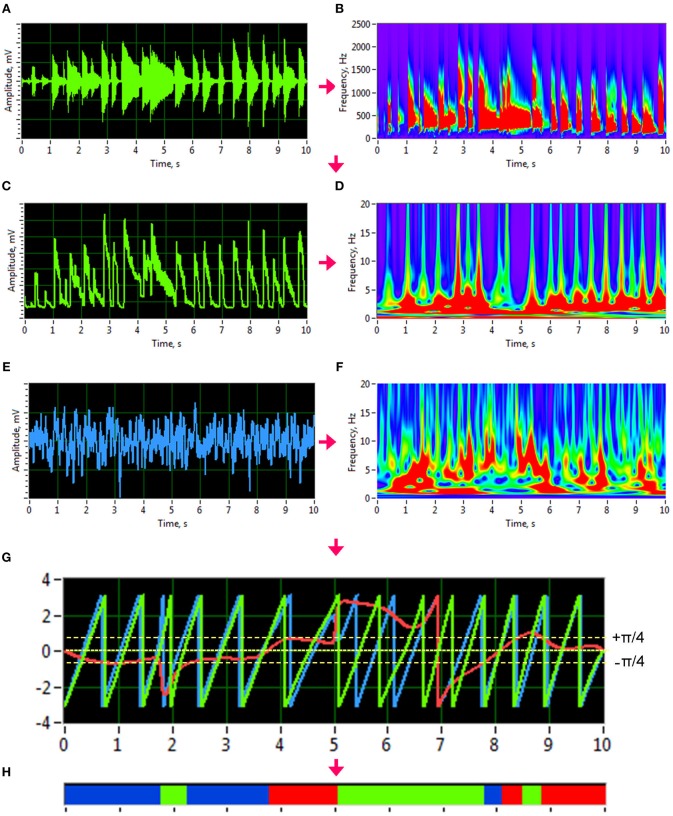
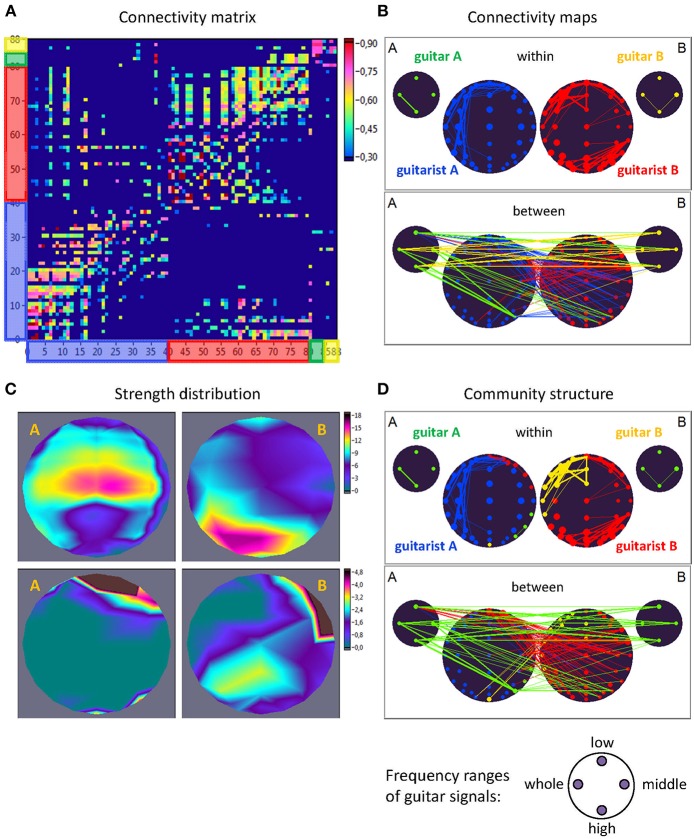
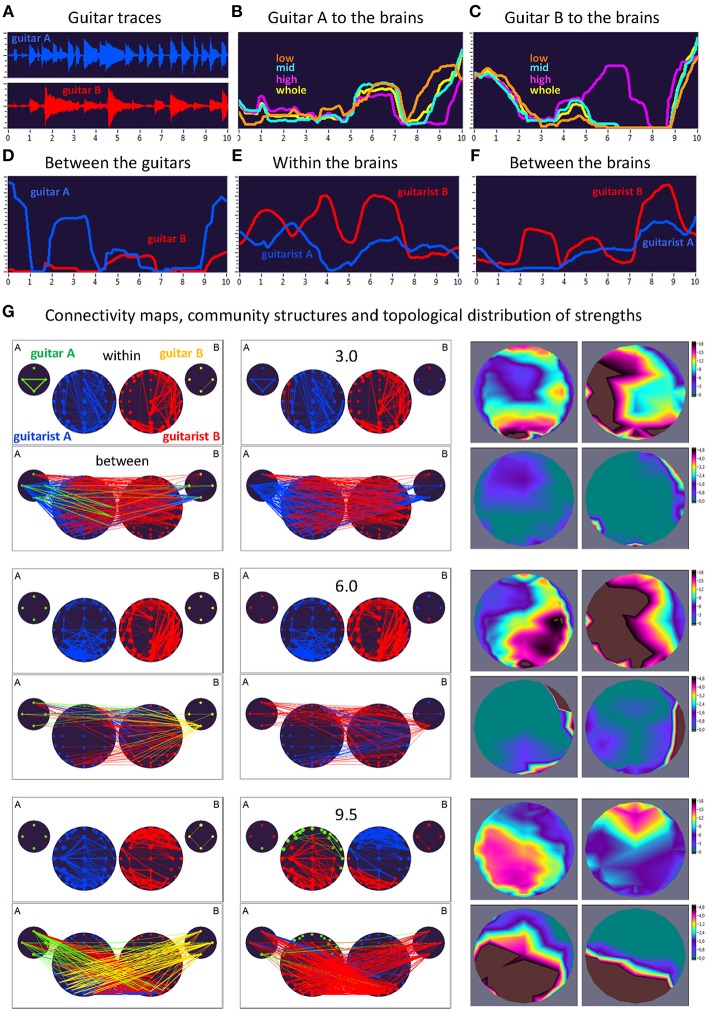
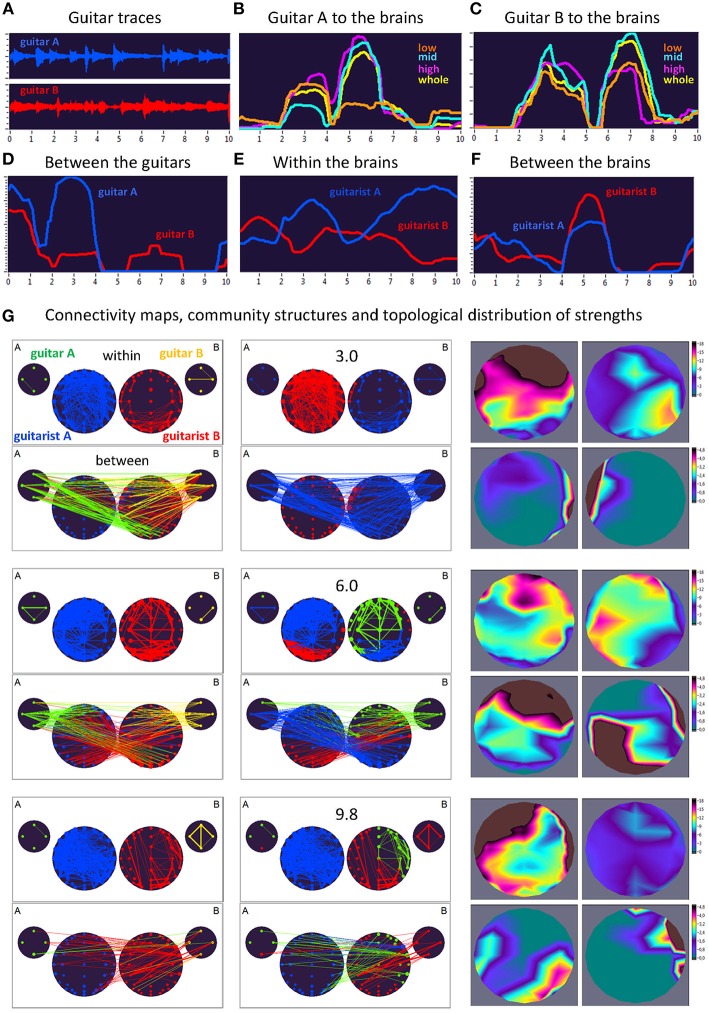
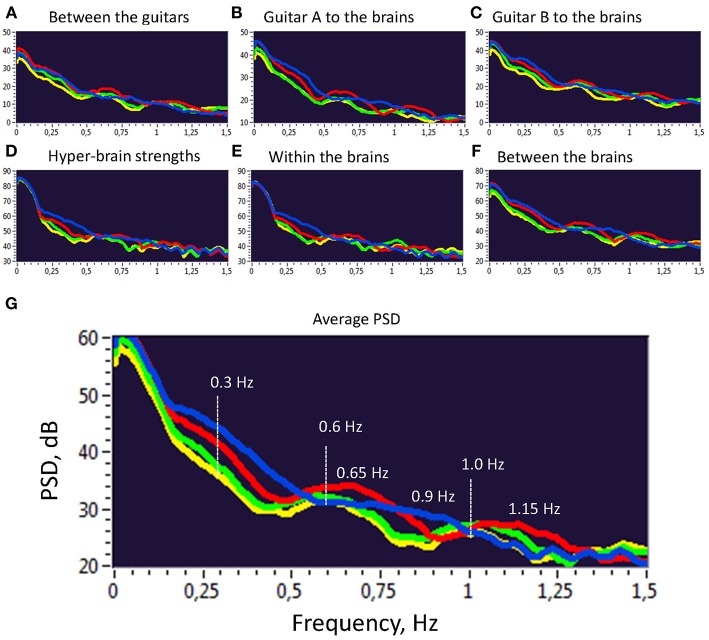
Playing music in ensemble requires enhanced sensorimotor coordination and the non-verbal communication of musicians that need to coordinate their actions precisely with those of others. As shown in our previous studies on guitar duets, and also on a guitar quartet, intra- and inter-brain synchronization plays an essential role during such interaction. At the same time, sensorimotor coordination as an essential part of this interaction requires being in sync with the auditory signals coming from the played instruments. In this study, using acoustic recordings of guitar playing and electroencephalographic (EEG) recordings of brain activity from guitarists playing in duet, we aimed to explore whether the musicians' brain activity synchronized with instrument sounds produced during guitar playing. To do so, we established an analytical method based on phase synchronization between time-frequency transformed guitar signals and raw EEG signals. Given phase synchronization, or coupling between guitar and brain signals, we constructed so-called extended hyper-brain networks comprising all possible interactions between two guitars and two brains. Applying a graph-theoretical approach to these networks assessed across time, we present dynamic changes of coupling strengths or dynamic orchestration of brains and instruments during free guitar improvisation for the first time. We also show that these dynamic network topology changes are oscillatory in nature and are characterized by specific spectral peaks, indicating the temporal structure in the synchronization patterns between guitars and brains. Moreover, extended hyper-brain networks exhibit specific modular organization varying in time, and binding each time, different parts of the network into the modules, which were mostly heterogeneous (i.e., comprising signals from different instruments and brains or parts of them). This suggests that the method capturing synchronization between instruments and brains when playing music provides crucial information about the underlying mechanisms. We conclude that this method may be an indispensable tool in the investigation of social interaction, music therapy, and rehabilitation dynamics.
Keywords: EEG hyperscanning; brain-instrument coupling; extended hyper-brain networks; graph-theoretical approach; intra- and inter-brain coupling; phase synchronization; social interaction.
Figures
Similar articles
-
Hyper-brain hyper-frequency network topology dynamics when playing guitar in quartet.Front Hum Neurosci. 2024 Jun 11;18:1416667. doi: 10.3389/fnhum.2024.1416667. eCollection 2024. Front Hum Neurosci. 2024. PMID: 38919882 Free PMC article.
-
Intra- and interbrain synchrony and hyperbrain network dynamics of a guitarist quartet and its audience during a concert.Ann N Y Acad Sci. 2023 May;1523(1):74-90. doi: 10.1111/nyas.14987. Epub 2023 Mar 27. Ann N Y Acad Sci. 2023. PMID: 36973939
-
Hyperbrain network properties of guitarists playing in quartet.Ann N Y Acad Sci. 2018 Mar 15. doi: 10.1111/nyas.13656. Online ahead of print. Ann N Y Acad Sci. 2018. PMID: 29543978
-
Collaborative Musical Creativity: How Ensembles Coordinate Spontaneity.Front Psychol. 2018 Jul 24;9:1285. doi: 10.3389/fpsyg.2018.01285. eCollection 2018. Front Psychol. 2018. PMID: 30087645 Free PMC article. Review.
-
Interactive Brain Activity: Review and Progress on EEG-Based Hyperscanning in Social Interactions.Front Psychol. 2018 Oct 8;9:1862. doi: 10.3389/fpsyg.2018.01862. eCollection 2018. Front Psychol. 2018. PMID: 30349495 Free PMC article. Review.
Cited by
-
Endogenous sources of interbrain synchrony in duetting pianists.Cereb Cortex. 2022 Sep 4;32(18):4110-4127. doi: 10.1093/cercor/bhab469. Cereb Cortex. 2022. PMID: 35029645 Free PMC article.
-
Neural Synchrony and Network Dynamics in Social Interaction: A Hyper-Brain Cell Assembly Hypothesis.Front Hum Neurosci. 2022 Apr 29;16:848026. doi: 10.3389/fnhum.2022.848026. eCollection 2022. Front Hum Neurosci. 2022. PMID: 35572007 Free PMC article.
-
Interpersonal neural synchrony and mental disorders: unlocking potential pathways for clinical interventions.Front Neurosci. 2024 Mar 11;18:1286130. doi: 10.3389/fnins.2024.1286130. eCollection 2024. Front Neurosci. 2024. PMID: 38529267 Free PMC article.
-
Interpersonal brain synchronization during face-to-face economic exchange between acquainted dyads.Oxf Open Neurosci. 2023 Jun 21;2:kvad007. doi: 10.1093/oons/kvad007. eCollection 2023. Oxf Open Neurosci. 2023. PMID: 38596234 Free PMC article.
-
Hyper-brain hyper-frequency network topology dynamics when playing guitar in quartet.Front Hum Neurosci. 2024 Jun 11;18:1416667. doi: 10.3389/fnhum.2024.1416667. eCollection 2024. Front Hum Neurosci. 2024. PMID: 38919882 Free PMC article.
References
-
- Biasutti M., Frezza L. (2009). Dimensions of music improvisation. Creat. Res. J. 21, 232–242. 10.1080/10400410902861240 - DOI
LinkOut - more resources
Full Text Sources
Research Materials